

Abstract
Old age is associated with a progressive decline of mitochondrial function and changes in nuclear chromatin. However, little is known about how metabolic activity and epigenetic modifications change as organisms reach their midlife. Here, we assessed how cellular metabolism and protein acetylation change during early aging in Drosophila melanogaster. Contrary to common assumptions, we find that flies increase oxygen consumption and become less sensitive to histone deacetylase inhibitors as they reach midlife. Further, midlife flies show changes in the metabolome, elevated acetyl‐CoA levels, alterations in protein—notably histone—acetylation, as well as associated transcriptome changes. Based on these observations, we decreased the activity of the acetyl‐CoA‐synthesizing enzyme ATP citrate lyase (ATPCL) or the levels of the histone H4 K12‐specific acetyltransferase Chameau. We find that these targeted interventions both alleviate the observed aging‐associated changes and promote longevity. Our findings reveal a pathway that couples changes of intermediate metabolism during aging with the chromatin‐mediated regulation of transcription and changes in the activity of associated enzymes that modulate organismal life span.
Keywords: ageing, acetylation, chromatin, metabolism
Subject Categories: Chromatin, Epigenetics, Genomics & Functional Genomics; Metabolism; Ageing
Introduction
When animals age, their mitochondrial function and hence cellular metabolism systematically decline, which results in a loss of cellular homeostasis and the occurrence of multiple disorders 1. Consistently, many mutations that impair mitochondrial function shorten life span 2. However, a reduction in mitochondrial activity through interference with the electron transport chain has also been shown to extend life span 3, 4. Similarly, caloric restriction (the reduced intake of energy through nutrition) leads to a longer life expectancy in a broad range of organisms 5, 6. These seemingly contradictory observations are difficult to reconcile with a simple model of generally declined metabolic activity as the predominant cause of aging. We therefore investigated the molecular changes that occur during the onset of aging in Drosophila melanogaster, a model organism that has been exploited for aging and metabolism research in the past and lends itself for a variety of interference regimes, aiming to promote longevity.
In eukaryotes, many key metabolites generated in mitochondria are used not only as energy source, but also as substrate for posttranslational modifications in response to internal and external stimuli. The dual function of these molecules directly couples central metabolism with cellular signaling networks and regulates homeostasis 7. Acetyl‐CoA is a key metabolite in the central metabolism and a cofactor for the acetylation of lysine residues (and other amines). Lysine acetylation is a key regulatory modification for many cytoplasmic metabolic enzymes as well as nuclear regulators of gene expression, most notably the histone proteins 7, 8. A connection between lysine acetylation and aging has already been suggested before by the observation that changes in the activity of the NAD+‐dependent deacetylases belonging to the sirtuin class can result in life span extension 9, 10. Their NAD+ dependency and the fact that lysine acetylation relies on the intracellular acetyl‐CoA levels 11 support the hypothesis that basic metabolism could be coupled to the aging process via lysine acetylation. However, it is unclear whether changes in the metabolic state of an organism trigger the process of aging, or whether other molecular changes induce the aging process, which in turn leads to metabolic alterations.
Besides its role in reversibly regulating metabolic enzyme activity 12, lysine acetylation has a major function in epigenetically regulating gene expression. Transcriptional deregulation and metabolic changes are both considered hallmarks of aging 13 and several epigenetic regulators are known to affect life span in many model systems 14, 15. A comparison between gene expression in young and old tissues shows increased transcriptional noise 16, 17, 18 and aberrant maturation of RNAs 19, 20, suggesting a general deterioration of the chromatin organization that underlies transcription control during aging.
These age‐dependent changes in gene expression can be attenuated by environmental influences such as caloric restriction, by mutations in epigenetic regulators, such as histone modifying enzymes 10, 21, 22, or by the overexpression of heterochromatin components 23. However, many of the age‐dependent changes have been investigated by comparing young to old animals, in which all physiological functions are already compromised to an extent that causal effects cannot be derived.
To investigate how metabolism, protein function, and gene expression are coupled at the onset of aging, we analyzed changes in metabolome, proteome, acetylome, epigenome, and transcriptome at a critical period known as the “premortality plateau” (or midlife) phase 24 in Drosophila melanogaster, which precedes the general metabolic and physiological decline observed in old age. These measurements allowed us to identify and validate potential genetic and physiological points of interference with the aging program and to promote life span extension.
Results
Metabolic profiles change and acetyl‐CoA levels increase as flies reach midlife
In order to measure how metabolic activity changes at an early stage of Drosophila aging, we measured the fly's oxygen consumption rate (OCR) in whole head tissue, rather than isolated mitochondria, as an indicator of physiological oxidative metabolism. Consistent with the observation that metabolic activity is lower in old flies 1, we detect a lower OCR in flies that are 7 weeks old, when 75% of the initial populations have died already (Figs 1A and B, and EV1A). Flies that reach the premortality plateau in midlife (90% survival) show a markedly reduced physical activity (4 weeks of age; Figs 1A and C, and EV1G), yet display a higher OCR in comparison with young flies (Figs 1D and EV1B–E). Inhibiting the mitochondrial respiratory chain by rotenone administration reduces the OCR, suggesting that the measured OCR in fly heads is mediated by mitochondrial respiration (Fig EV1F). We conclude that the midlife stage—where most individuals in the fly population are alive—is characterized by a reduced physical activity and an unexpected increase in mitochondrial respiration. To shed light on the molecular changes that cause these physiological alterations during early aging, we thus focused our systematic molecular analyses in this study on the comparison between young and midlife flies.
Figure 1. Whole head tissue of midlife Drosophila flies shows an increased oxygen consumption rate and displays an altered metabolism.

- In a mixed population, flies reach the end of a “premortality plateau phase” (PMP) at an age of 4 weeks, where 90% of the flies are still alive. We define this age as their “midlife” point. At this stage, the rate of the population decline accelerates from 1% (plateau) per day in the previous 10 days to 3.5% per day in the following 10 days. Median survival = 39 days, N = 260.
- Oxygen consumption rate (OCR) quantification shows a decreased OCR in old whole heads compared to young flies. Data were normalized to 1‐week‐old flies (young flies). N = 14 young vs. N = 12 old.
- At midlife, flies show a reduced physical activity compared to young flies. N = 7 young vs. N = 5 midlife.
- Oxygen consumption rate (OCR) quantification shows an increased OCR in midlife whole heads compared to young flies. Data were normalized to 1‐week‐old flies (young flies). N = 21 young vs. N = 24 midlife.
- Metabolite levels show increased levels of acetyl‐CoA and citrate/isocitrate compound in midlife flies. N = 6 per group.
- Enzymatic activity of citrate synthase and ATPCL is increased in midlife flies. CS, citrate synthase (Kdn); ATPCL, ATP citrate lyase. Data were normalized to young flies. N = 8 young vs. N = 9 midlife for CS and N = 6 young vs. N = 7 midlife for ATPCL.
Figure EV1. Technical parameters in young and midlife flies.

- Representative oxygen consumption rate profiles in young (blue circles) and old flies (black squares), showing lower consumption in the heads of 7‐week‐old flies. During an assay lasting 2 min, a series of 10 oxygen submeasurements (ticks) is taken. The slope of these 10 ticks is calculated to generate the oxygen consumption rate (OCR) measurement.
- Representative oxygen consumption rate profiles in young (blue circles) and midlife flies (red squares), showing higher consumption in the heads of 4‐week‐old flies.
- Negative control of wells containing buffer without any tissue. Background wells showed no changes in oxygen levels and served as background for all other measurements.
- Oxygen levels during the first tick of each measurement series were similar in wells containing young and midlife male fly heads. The pH during the first tick was similar in the wells of the two groups. N = 21 young and N = 24 midlife.
- Measurements of fly male heads show similar weight in young and midlife males. N = 6–7 per group.
- Addition of 5 μM rotenone, a complex I inhibitor, significantly decreases oxygen consumption. This result demonstrates that the rate of oxygen consumption being measured relates to oxygen consumed by the respiratory complexes. Data were normalized to the data point before the addition of rotenone. Dashed line indicates addition of the drug.
- Fly activity assay after 3 s. Distribution of flies across four sections of a vial following 3 s of flipping (Q4 is the section at the top of the vial). N = 7 young and N = 5 midlife.
Data information: Error bars in each graph indicate the SEM.
We first set out to ask whether an increased mitochondrial respiration leads to elevated energy production. We therefore applied a non‐targeted mass spectrometry‐based metabolomic profiling 25, 26, 27 to quantitate key cellular metabolites of glycolysis and the TCA cycle. Interestingly, we detected increased levels of acetyl‐CoA and citrate/isocitrate in midlife flies (Fig 1D), while the levels of acetate and ATP do not change. Consistent with higher levels of citrate/isocitrate and acetyl‐CoA, the specific activities of both citrate synthase (CS/Kdn), a marker for the mitochondrial metabolic activity, and ATP citrate lyase (ATPCL), the enzyme responsible for cytosolic acetyl‐CoA synthesis, are higher in midlife flies (Fig 1E).
Proteome acetylation but not protein abundance increases as flies reach midlife
We next tested whether the observed increase in acetyl‐CoA has a consequence on protein and histone acetylation during midlife. Head extracts probed with a pan‐acetyl‐lysine antibody showed an increase in some acetylated proteins in midlife flies (Fig 2A). To resolve the identity of the hyper‐acetylated proteins, we used a proteomic approach where peptides from acetylated proteins were enriched from extracts of young and midlife fly heads with the pan‐acetyl‐lysine antibody 8 and quantified by label‐free mass spectrometry (Dataset EV1). Among the 217 high‐confidence acetylation sites, 79 acetylation sites in 49 distinct proteins increase during aging, while only three decrease (Figs 2B and EV2A). GO analysis reveals that the majority of these hyper‐acetylated proteins have metabolic functions and are involved in the final steps of glycolysis, the TCA cycle, and oxidative phosphorylation (Dataset EV1). Importantly, in most cases, these changes were not due to changes in protein levels, since we detect similar levels for 1,138 proteins of the 1,238 analyzed between young and midlife flies (Fig EV2B and C, and Datasets EV1 and EV2). Notably, we detect no significant changes in the levels of most of the proteins associated with general metabolic pathways, such as glycolysis, the TCA cycle, and oxidative phosphorylation. These quantitative measurements thus reveal that that the onset of aging is characterized by increased metabolic rate, elevated acetyl‐CoA levels, and enhanced acetylation of key metabolic enzymes.
Figure 2. Midlife flies show higher protein acetylation and reduced OCR response to KDACi treatment.

- Representative Western blot showing a mildly altered protein acetylation pattern (anti‐AcK) between 1‐week‐old (young) and 4‐week‐old (midlife) flies. Tubulin served as a loading control. N = 4–5 per group. Tub, Tubulin.
- Heat map showing altered protein acetylation sites between young and midlife flies, based on the acetyl‐lysine‐enriched peptide fractions analyzed by MS and after normalization to protein input (detailed statistical method in extended Materials and Methods). N = 5 per group. fc, fold change.
- The lysine deacetylase inhibitor (KDACi) sodium butyrate (SB) induces a rapid increase in oxygen consumption in the heads of young flies, but this increase is milder in midlife flies. The dashed line indicates the addition of SB. Data were normalized to the measurement prior to addition of SB (100%) and collected after five cycles of measurements, corresponding to approximately 33 min. N = 9 young vehicle, N = 8 young SB, N = 9 midlife vehicle, and N = 7 midlife SB. **P < 0.01, ***P < 0.001. Unpaired two‐tailed t‐tests were used for calculating the P‐values. Error bars indicate the SEM.
- High sodium butyrate (SB)‐treated flies reach the end of the premortality plateau phase at earlier age of 11 days. Survival 90% control = 26 days, 15 mM SB = 24 days, 150 mM SB = 11 days. Median survival for control = 45 days, 15 mM SB = 41 days, 150 mM SB = 30. N = 357 (vehicle), 294 (15 mM SB), and 320 (150 mM SB). SB 15 mM log‐rank test, χ2 = 14.83, P = 0.0001. SB 150 mM log‐rank test, χ2 = 151.1, P < 0.0001.
Figure EV2. Proteomic analysis indicates similar profile of metabolic proteins in young and midlife flies and the KDAC inhibitor TSA increases OCR and has negative impact on life span in Drosophila .

- Quantification of lysine acetylation levels by mass spectrometry (MS) reveals a general increase in protein acetylation in midlife flies. The box represents the interval that contains the central 50% of the data with the line indicating the median. The length of the whiskers is 1.5 times the interquartile distance (IQD).
- Proteome analysis of the input samples by MS shows similar absolute levels for proteins involved in metabolic (in) and non‐metabolic (out) processes in 1‐week‐old (young) and 4‐week‐old (midlife) flies. The box represents the interval that contains the central 50% of the data with the line indicating the median. The length of the whiskers is 1.5 times the interquartile distance (IQD).
- Proteome heat map comparing the protein intensities (see Proteome acetylation but not protein abundance increases as flies reach midlife) of the input. N = 5 per group. fc, fold change.
- Trichostatin A (TSA) induces an increase in oxygen consumption in the heads of young flies. Data were normalized to the measurement prior to addition of TSA. N = 5 per group. Error bar indicates the SEM
- 400‐nM TSA‐treated male flies in mixed male/female population reach the end of the premortality plateau phase at a similar age of 4 weeks. However, 400‐nM TSA‐treated flies show reduced median and maximal life span. Survival for control = 53 days, 40 nM TSA = 47 days, 400 nM TSA = 45, N = 368 vehicle, 296 (40 nM TSA) and 326 (400 nM TSA). Log‐rank test of TSA40 nM, χ2 = 24.33, P < 0.0001. Log‐rank test of TSA400 nM, χ2 = 79.55, P < 0.0001.
Lysine deacetylase (KDAC) inhibitors affect oxidative metabolism
Because lysine acetylation is an important regulatory modification of many metabolic enzymes 8, 28, 29, 30, we wondered whether the pharmacological elevation of general protein acetylation through the global lysine deacetylase (KDAC) inhibitors sodium butyrate and TSA 8 would result in changes in OCR. Adding these KDAC inhibitors to isolated heads resulted in a rapid increase in OCR (Figs 2C and EV2D), which subsided after multiple OCR measurements. Heads prepared from midlife flies showed a less pronounced increase in OCR (Fig 2C). This may be due to the higher ground state protein acetylation of these enzymes in midlife, as a result of the elevated acetyl‐CoA levels (Fig 2A and B).
Our observation of a decreased respiratory responsiveness of midlife flies upon KDAC inhibitor treatment suggests that protein acetylation may regulate metabolic processes and is at least partly responsible for the increased OCR in midlife flies. Based on these results, we hypothesized that sustained high levels of protein acetylation might restrict life span. To test this prediction, we pharmacologically increased protein acetylation by supplementing the fly food with sodium butyrate or TSA. Consistent with our hypothesis that an increase in protein acetylation is an early sign of aging, premature hyper‐acetylation by a continuous treatment of flies with high doses of KDAC inhibitors results in a significant reduction in life span (Figs 2D and EV2E).
Histone acetylation signature is different in midlife flies
In addition to an increase in general protein acetylation, changes in metabolism and of acetyl‐CoA levels in midlife flies are expected to have an impact on the acetylation levels of histones, which play a central role in the regulation of gene expression. To avoid the poly‐acetylated epitope bias of commonly used antibodies 31, we quantified changes in the major acetylation sites on histones H4 (K5, K8, K12, and K16) and H3 (K9, K14, K18, and K23) using a recently developed targeted mass spectrometry approach 32. Comparing young to midlife flies, we observed moderate but consistent increases of H4K12ac, H3K9ac, H3K9acK14ac, and H3K23ac, whereas H4K8ac and H3K18ac were reduced (Fig 3A). In line with our results, daily consumption of the KDAC inhibitor sodium butyrate results not only in short premortality plateau phase, but also with higher histone acetylation levels after 11 days (Fig EV3). These results support the involvement of histone acetylation during aging 33, 34 and its susceptibility to metabolic changes, such as an increased level of acetyl‐CoA 11, 35, 36 or changes in the levels of the deacetylase substrate NAD+ 37 .
Figure 3. Histone acetylation is changed during midlife, while cooler temperature reverses midlife‐associated metabolic and histone acetylation levels.

- Quantification of major acetylation sites on histones H3 and H4 in young and midlife flies. Midlife flies display a transformed histone acetylation profile including elevation (H4K12, H3K9, H3K9/14, and H3K23) and reduction (H4K8 and H3K18). Data were normalized to 1‐week‐old (young) flies. N = 15–22 (histone 4) and N = 12–19 (histone 3) per group.
- Male flies show a gradual increased life span and prolonged premortality plateau phase at various length of exposure to 18°C (cold) compared to the 25°C (control) ambient temperature. Survival 90% control = 28 days, cold = 58 days. Median survival for control = 38 days, cold = 80 days. N = 295 (control) and 238 (cold). Log‐rank test, χ2 = 527.1, P < 0.0001.
- Comparison of the activity of key metabolic enzymes between midlife flies grown at 18°C and 25°C. Midlife flies grown at 25°C have lower CS and ATPCL activity to midlife flies at 25°C. CS, citrate synthase; ATPCL, ATP citrate lyase. N = 9 midlife vs. N = 6 cold midlife for CS and N = 7 midlife vs. N = 6 cold midlife for ATPCL.
- Metabolite levels show reduced levels of citrate and ATP in midlife flies at 18°C. The levels of acetyl‐CoA are not significantly different despite a trend of reduced levels in 18°C flies. N = 6 midlife vs. N = 5 cold midlife.
- Midlife flies grown at 18°C show a general reduction in histone acetylation states including acetylation states which are increased upon aging (Fig 3A—H4K12, H3K9, H3K9/14 and H3K23). Of note, H4K8 is increased in midlife when flies are kept at 18°C. N = 16–21 (histone 4) and N = 13–16 (histone 3) per group.
Figure EV3. Daily consumption of the KDAC inhibitor sodium butyrate (SB) increases histone acetylation in 11‐day‐old flies.

Quantification of a mono‐, di‐, tri‐, and tetra‐acetylation states of histone H4 in vehicle and SB‐treated flies, showing an increase in all states in high SB treatment. Unpaired two‐tailed t‐tests were used for calculating the P‐values. *P < 0.05, ***P < 0.001. Error bars indicate the SEM.
Lower temperature exposure reverts aging‐associated changes in metabolism and epigenetics
Several physiological conditions have been shown to affect life span in Drosophila, ranging from caloric restriction 38 to raising flies in complete darkness 39, to raising flies at reduced temperature 40. As the reduced temperature resulted in the most robust life span extension in D. melanogaster males (Fig 3B), we used this regimen to analyze the molecular changes during physiological life span extension. Lowering the ambient temperature also has been shown to reduce daily OCR levels by lowering overall metabolic activity 40. In agreement with the hypothesis that changes in metabolism promote early aging, we observed a reduced activity of key metabolic enzymes and a moderate decrease in citrate/isocitrate at lower temperature after 4 weeks of age, when flies kept at 25°C have already reached the premortality plateau (Fig 3C and D). Notably, although ATPCL activity is decreased, we observed only a non‐significant decrease in total acetyl‐CoA, which may be due to the fact that under those conditions other pathways contribute to the overall production of acetyl‐CoA. As our measurements do not distinguish between cytosolic and mitochondrial acetyl‐CoA, it may well be that a putative drop in cytosolic acetyl‐CoA is compensated by a less efficient mitochondrial metabolism when measuring total levels in the cells.
We next asked whether keeping flies at lower temperatures also affects the aging‐associated histone acetylation signatures. Indeed, we observed that the histone acetylation signatures that were elevated in midlife flies at 25°C are reduced when flies are kept at lower temperature (Fig 3E). However, we also observe a reduction in other acetylation sites, suggesting a more general and broad decrease in acetylation at lower ambient temperatures. Altogether, our data reveal that flies kept in a cooler environment delay the end of the PMP (i.e., reach midlife later), display a reduced activity of key metabolic enzymes, contain lower levels of key metabolites, and show a reduced and reverted acetylation signature at specific histone lysine residues. Although lowering the temperature likely affects multiple pathways to increase life span, these data are in line with our observation that increased Drosophila longevity correlates with decreases in metabolic activity, ATPCL activity, and changes in histone acetylation patterns.
Reduced activity of ATPCL extends the life span of Drosophila males
In order to gain more insight into life span modulation that might better transfer to higher organisms that regulate body temperature, we tested whether a reduction in ATPCL activity has a consequence on the onset of mortality and promotes life span. As expected, flies carrying one hypomorphic atpcl allele, which has reduced levels of atpcl RNA due to a P‐element insertion in the first intron 41, display a 20% reduction in ATPCL activity (Fig 4A) and in transcript levels (Fig EV4A). When analyzing the metabolome, we found only 75 metabolites that were significantly different between young wild‐type and +/atpcl mutant flies (Fig 4B and Dataset EV3). In contrast, 439 metabolites differed in midlife flies (Fig 4B and Dataset EV3). We found an enrichment for downregulated metabolites belonging to citric acid cycle and purine metabolism in midlife +/atpcl mutant. This suggests a more profound role for ATPCL in regulating the metabolism of midlife flies. Therefore, we further analyzed changes in the midlife flies using a targeted MS approach, focusing on some key metabolites. We found that acetyl‐CoA and succinate were reduced in midlife +/atpcl, while citrate/isocitrate and ATP levels showed similar concentrations (Fig 4C). In line with lower ATPCL activity, midlife +/atpcl mutants show reduced levels of some histone acetylations at midlife compared to wild‐type flies (Fig 4D).
Figure 4. Genetic attenuation of ATPCL reduces midlife histone acetylation and promotes Drosophila life span.
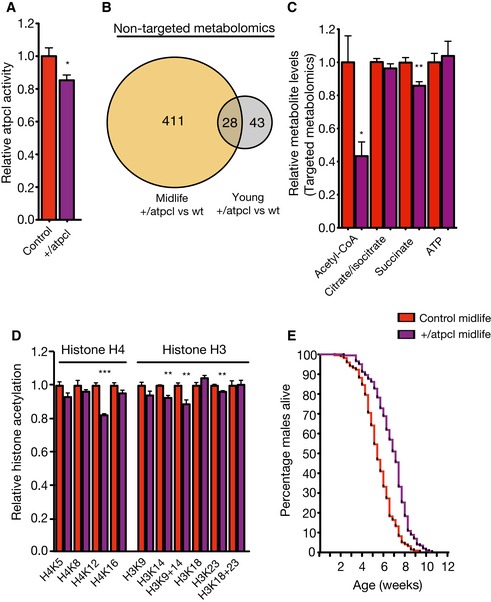
- ATPCL mutant male flies show reduced ATPCL activity at their 4th week. N = 7 per group.
- Non‐targeted metabolome reveals 71 significantly altered metabolites in young wild‐type vs. young +/atpcl mutants, while 439 metabolites are altered in the midlife groups out of 1,658 metabolite compounds. N = 6 per group.
- Targeted metabolite measurements show decreased acetyl‐CoA and succinate in midlife +/atpcl mutants. N = 4–6 per measurement.
- Quantification of histone H3 and H4 acetylation in +/atpcl mutants at 4 weeks of age (midlife). Age‐associated hyper‐acetylated histone states are reduced in +/atpcl mutant flies (H4K12, H3K14, H3K9/14 and H3K23). N = 5–6 per group.
- +/atpcl male flies show an increased mean life span and slower mortality rates in midlife. Survival 90% control = 26 days, +/atpcl = 30 days, Median survival for control = 38 days, +/atpcl = 50 days. N = 220 (control) and 202 (+/atpcl). Log‐rank test, χ2 = 67.87, P < 0.0001.
Figure EV4. Reduced ATPCL prolongs life span of male flies living without females.

- The mutant atpcl allele we used (Bloomington 11055) consists of a P‐element insertion between the 5′ UTR of isoforms E/D and the 5′ UTR of isoforms F/G. RT–PCR reveals a 20% decrease in midlife atpcl heterozygote mutants (+/atpcl) compared to wild‐type control. N = 5–6 per group. Unpaired two‐tailed t‐tests were used for calculating the P‐values. *P < 0.05. Error bars indicate the SEM.
- +/atpcl male flies in homogenous male population show increased mean life span and latency at arrival to accelerated population decline. Survival 90% control = 18 days, atpcl = 28 days. Median survival for control = 33 days, atpcl = 45 days, N = 198 (control) and 212 (Atpcl). Log‐rank test, χ2 =43.99. P < 0.0001. Unpaired two‐tailed t‐tests were used for calculating the P‐values.
Since +/atpcl flies show lower ATPCL activity and lower histone acetylation, we measured their life span. Remarkably, mutant +/atpcl males show a longer PMP and an increased life span (Fig 4E in mixed population with females, and Fig EV4B as homogeneous male population). This further supports the link between metabolic activity, epigenetic changes, and early aging by an increased production of cytosolic acetyl‐CoA.
Reduced levels of the KAT Chameau (HBO1, KAT7) extend life span of Drosophila males
The level of acetylation of histone H4 at K12 changes significantly when flies reach the premortality plateau. Notably, this acetylation site has been linked to aging before 34. We were thus curious to see whether reducing the activity of the lysine acetyltransferase responsible for this modification might alter life span. In a systematic screen that we performed recently 32, we identified the nuclear acetyltransferase Chameau as the enzyme that contributes most to the cellular levels of the H4K12ac mark in Drosophila cells. We therefore determined the life span of an isogenic fly strain heterozygous for a deletion of exons 8–10 of the chm gene 42. These exons span the catalytic MYST domain (Fig EV5A). Consistently, the mutation led to a 50% reduction in the chm mRNA as extracted from a transcriptome analysis of the fly strain (Fig 5A) and confirmed by quantitative RT–PCR (Fig EV5A). As expected from our screening, the +/chm flies show a substantial decrease in the levels of the H4K12ac mark (Fig 5B) when compared to wild‐type flies.
Figure EV5. Reduced Chameau enzymatic activity prolongs life span of male flies living without females.

- The mutant chm allele we used removes the catalytic, histone acetyltransferase MYST domain spanning exons 8–10. N = 6–8 per group. ***P < 0.001. Unpaired two‐tailed t‐tests were used for calculating the P‐values.
- Density plot showing decreased fold change of shared upregulated genes in chm mutants.
- Chm male flies in homogenous male population show increased mean life span and latency at arrival to accelerated population decline. Survival 90% control = 25 days, chm = 41 days. Median survival for control = 50 days, chm = 56 days, N = 296 (control) and 318 (chm). Log‐rank test, χ2 = 36.83, P < 0.0001.
- Fly activity assay after 8 s. Distribution of flies across five sections of a vial following 8 s of flipping (Q5 is the section at the top of the vial). N = 7.
Data information: Error bars in each graph indicate the SEM.
Figure 5. Mutation of the nuclear lysine acetyltransferase Chameau reduces midlife histone H4 lysine 12 acetylation, moderates age‐associated transcriptome deregulation, promotes Drosophila life span, and moderates the loss in physical activity.

- The mutant chm allele we used removes the catalytic, histone acetyltransferase MYST domain. The chm mutants consistently display 50% mRNA reduction in young (7 days) and midlife (22 days) when compared to wild‐type flies. N = 5 young wt, N = 6 young chm mutants, N = 4 midlife wt, and N = 6 midlife chm mutants.
- MS‐based quantification of histone H4 and H3 acetylation reveals a specific reduction in H4K12ac in male chm heterozygous mutants at 22 days of age (midlife). N = 7 per group.
- RNA‐seq analysis reveals 1,758 significantly altered genes during wild‐type aging and 1,319 altered genes during chm aging process. A total of 920 genes are common to both aging processes. N = 5 young wt, 6 young chm mutants, 4 midlife wt, and 6 midlife chm mutants.
- Shared age‐associated downregulated genes display similar fold change response in wild‐type and chm aging. In contrast, the upregulated genes display higher fold change in wild‐type aging compared with +/chm aging.
- Chm male flies show increased mean life span and slower mortality rates in midlife. Survival 90% control = 20 days, chm = 22 days. Median survival for control = 34 days, chm = 42 days, N = 180 (control) and 175 (chm). Log‐rank test, χ2 = 37.15, P < 0.0001.
- Midlife chm mutants display increased activity compared to midlife control N = 7.
- Double chm/atpcl mutant displays similar life span to +/atpcl mutant. Survival 90% +/atpcl = 39 days, chm/atpcl = 35 days. Median survival for +/atpcl = 57 days, chm/atpcl = 54 days, N = 256 (+/atpcl) and 301 (chm/atpcl). Log‐rank test, χ2 = 3.19.
Aging has been associated with changes in gene expression 38 and with an increase in transcriptional noise 16, 43. As histone acetylation has an important function in regulating gene expression, we measured the changes in gene expression upon chm mutation in young and midlife flies. In line with previous studies 15, 38, the expression of 1,949 (20% of detected transcripts) genes significantly changed during aging in wild‐type flies and 1,307 (13%) had an altered expression level in +/chm mutant flies (Fig 5C and Dataset EV4), with an overlap of 973 genes that change in both strains. Interestingly, the 355 genes that were downregulated during aging in the wild‐type and chm flies showed similar degrees of repression, whereas the upregulated 618 genes showed a smaller increase in chm mutants when compared to wild‐type flies (Figs 5D and EV5B). These data suggested an attenuation of age‐associated stimulation of transcription in chm mutants. Consistent with a potential role of H4K12ac‐mediated gene expression changes during early aging, we observe a significant life span extension in male flies with reduced levels of Chameau (Fig 5E in mixed population with females and Fig EV5C in a homogenous male population). Interestingly, midlife chm mutant male flies also display higher physical activity compared to age‐matched wild‐type flies (Figs 5F and EV5D). The chm mutant thus partially rescues the midlife‐associated reduction in physical activity (Fig 1C). A double chm/atpcl mutant does not display increased life span compared to +/atpcl, suggesting that ATPCL and Chameau are epistatic to each other and might promote longevity via similar mechanisms (Fig 5G).
Discussion
The process of aging is characterized by a deterioration of multiple interconnected cellular pathways, which makes the identification of molecular mechanisms of phenotypic aging and death particularly difficult 13. Many molecular analyses have focused on the comparison of young and old organisms, which resulted in the formulation of nine hallmarks of aging ranging from telomere shortening and epigenetic alterations, to differences in nutrient sensing and stem cell depletion 13. While many of these experiments have identified valuable paths toward life span extension, such studies face the complication that old individuals suffer from the progressive deterioration of multiple cellular systems, which can make it challenging to distinguish primary from secondary effects. To identify changes involved in the onset of aging, we compared D. melanogaster flies at young age and during midlife at the onset of a premortality plateau, when most individuals of a population are still alive.
Increased oxygen consumption rate at midlife
Surprisingly, heads from midlife flies consume more oxygen than the young ones. This is in apparent contradiction to the general observation of a reduced metabolism when animals age 1, which we also observe in old flies. There are several possible explanations for this unexpected finding. In many studies, the oxygen consumption rate was extrapolated from measurements of isolated mitochondria, which may lack crucial extra‐mitochondrial signals when investigated in isolation, whereas we have measured activity in isolated fly heads. Alternatively, flies may change their feeding behavior when reaching midlife, or switch from an anaerobic to a more aerobic metabolism due to their decreased activity, which is consistent with higher levels of metabolites generated by oxidative processes in midlife flies. Finally, the metabolic changes may be due to a feed‐forward activation of metabolic enzymes that become stimulated by hyper‐acetylation 44. Our observation that the treatment of isolated fly heads with KDAC inhibitors increases OCR within minutes suggests that such a direct feed‐forward mechanism might indeed exist. The finding that midlife flies have a higher ground state of acetylation and are less susceptible to a stimulation by KDAC inhibitors argues for similar acetylation events triggered by KDAC inhibitor treatment and aging.
Histone acetylation changes in midlife flies correlate with acetyl‐CoA levels
The increased level of acetyl‐CoA in midlife flies correlates with a very specific change in the histone modification pattern as flies reach midlife. As we cannot distinguish between mitochondrial and cytosolic acetyl‐CoA, the substrate for acetyltransferases, the observed correlation may not be causal. However, we also observe an increased activity of the main enzyme for the synthesis of cytosolic acetyl‐CoA, ATPCL 11, in midlife flies, and therefore assume that the cytosolic acetyl‐CoA level is indeed higher when flies reach midlife. Interestingly, this increased activity is not caused by increased protein synthesis of ATPCL (Fig EV2C, Dataset EV2), but potentially by posttranslational mechanisms such as a hyper‐acetylation. This is also supported by the observation that a fly strain heterozygous for an atpcl mutation shows only a 15% reduction in ATPCL activity, suggesting that there is a substantial degree of posttranscriptional regulation of this enzymatic activity. Such a regulation of ATPCL has also been proposed to stimulate lipid synthesis and tumor growth 45. Our findings that a fly strain carrying a mutation in the ATPCL gene has an extended life span and a delayed onset of aging further confirm the importance of extra‐mitochondrial acetyl‐CoA for the regulation of aging. Interestingly, the reduction in ATPCL has a much stronger effect on the metabolism of midlife animals when compared to young animals. The effects we observed analyzing head tissue of Drosophila melanogaster are in line with earlier reports that the targeted depletion of an unrelated acetyl‐CoA synthase in fly neurons extends life span 46, 47. It will be interesting to resolve the physiological effects of ATPCL mutation on the metabolome, the histone acetylation, and the transcriptome in isolated neurons.
A mutation of the H4K12 acetyltransferase Chameau extends life span
The ATPCL mutation results in a rather specific change in histone acetylation and does not affect all acetylation sites to the same degree. In midlife animals, the ATPCL mutation has the strongest effect on H4K12ac—an acetylation site that had been implicated in age‐dependent memory impairment 34 and transcriptional elongation 48 and which is increased when flies reach their premortality plateau phase. This may be due to modulation of the enzymatic properties of Chameau or of a corresponding deacetylase. An increased activity in several deacetylases has been shown to extend life span in various organisms 14 and higher concentrations of the sirtuin cofactor NAD+ 9, 49 have been shown to be beneficial for life span extension. However, the effect of sirtuins on life span continues to be debated 10, 13, 50 and their effect has so far not been associated with a particular histone modification pattern. The quantitative analysis of specific histone modifications in this study has allowed us to identify Chameau as an enzyme responsible for the increased modification in midlife flies 32. It is worth mentioning that the chm mutant allele is homozygous lethal and the beneficial effect on life span is more pronounced in males than in females, suggesting that Chameau has additional function, which are not yet fully understood. However, the fact that a reduction in the activity of the acetyltransferase Chameau robustly promotes longevity in male flies supports our hypothesis that this enzyme has an active role in modulating life span at least in Drosophila males.
A mutation of chm attenuates age‐associated transcriptional changes
Previous studies demonstrated that old flies show an impaired transcriptome surveillance, as manifested in increased transcriptional noise 16 and expression of aberrant or immature mRNAs 19, 20, 38. We find substantial changes in the transcriptional profile as flies reach midlife, suggesting that the differential regulation of gene expression is one of the early hallmarks of the aging process. It remains to be explored how specific changes in gene expression integrate with regulatory modifications and metabolic activity. Chameau appears to promote the expression of a large number of genes particularly during the midlife period genes. Conceivably, the enhanced H4K12 acetylation leads to widespread chromatin opening, with positive effects for the transcription of specific genes. A side effect of this loosening of chromatin structure may be the increased transcriptional noise, which might compromise a variety of physiological functions (Fig 6, middle panel). Considering the localization of H4K12ac at the gene body of highly expressed genes 48, it will be interesting to investigate whether the increased transcription during midlife is due to a higher rate of transcript elongation or a higher activity of cryptic promoters. We hypothesize that the attenuation of this effect in chm mutant flies is the cause for their extended life span (Fig 6, right panel). A similar effect is also seen in ATPCL mutant flies, and the observation that life span is not further extended if the ATPCL and chm alleles are combined suggests that the two enzymes may act in the same pathway.
Figure 6. A model for early changes in aging based on a putative metabolism—histone acetylation axis in flies.

In young flies, the metabolic state and the variation in gene expression are well balanced. When flies reach midlife, metabolic increases in oxidative phosphorylation, citrate synthase, and ATPCL activity result in higher acetyl‐CoA levels. The higher acetyl‐CoA results in increased histone acetylation followed by misregulation of the transcriptome. Attenuating the metabolism–histone acetylation axis by a reduction in ATPCL activity, or of the KAT Chameau, moderates age‐associated transcriptomic changes, leading to a life span extension.
Early aging is characterized by multiple, system‐wide changes of the metabolome, the proteome, the epigenetic profiles, and the transcriptome
Our data provide an overview of the metabolic, proteomic, and transcriptomic changes that occur as flies reach the premortality plateau phase. Conceivably, metabolic processes are linked to changes in gene expression through differential protein acetylation, in general, and histone acetylation, in particular. We currently cannot unambiguously distinguish whether the shift in metabolic activity upon fly aging precedes the increases in protein/histone acetylation, or whether increases in protein/histone acetylation result in specific metabolic changes. Most likely, both principles affect each other in a complex network of feedback and feed‐forward loops. Indeed, many mitochondrial enzymes that have been shown to be acetylated in response to metabolic changes either gain or lose enzymatic activity 30, 51.
Considering the high conservation of central metabolism, metabolic regulation, and epigenetics between flies and humans, our data raise the possibility that small molecule regulators of acetyl‐CoA production or consumption, or changes in the activity of selective acetyltransferase functions, could prolong a healthy midlife also in humans. Our model organism data reveal a potential alternative strategy that could extend midlife and delay aging‐associated homeostatic decline in humans.
Materials and Methods
Flies
Flies (Canton) of mixed population of males and females (except the survival curves in Figs EV4B and EV5C, where males were in single sex population) were housed in 12‐h dark/light cycle at 25 or 18 degrees, in 60% humidity and with free access to food (water, 1.2% agar, 1.8% yeast, 1% soja, 2.2% sugar syrup, 8% corn extract, 8% malt extract, 0.24% Nipagin, and 6.25 μl/l of propionic acid and yeast extra powder) and with an addition of yeast powder. The food was changed every 2–3 days. For the experiments including cold temperature, the food was changed every 2 days. For cold temperature, flies were kept in 25°C and were moved to 18°C 4 days after enclosing. For sodium butyrate (Sigma)/TSA (Sigma) experiments, flies were kept in normal conditions for the first 3 days after enclosing before introduced to sodium butyrate/TSA food. For sodium butyrate/TSA experiments, no extra yeast powder was added (no ext). Atpcl flies were purchased from Bloomington (Stock 11055). The chm mutants were obtained from the laboratory of Yacine Graba 52.
Both mutants were crossed for 7–9 generations to their respective control group without balancers (cn1;ry42 for Atpcl and 2202U for chm). The double mutant strain chm/Atpcl was generated by crossing a cyo/chm;2202U strain with a cyo/Atpcl;cn1;ry42 strain and then compared with a +/Atpcl strain generated by a cross of a cyo/+;2202U strain with a cyo/Atpcl;cn1;ry42 to prevent effects due to different strain backgrounds. For the survival curves, equal number of males and females were introduced to a vial unless stated otherwise and the number of dead male flies was counted every 2–3 days or 2 days for 18°C (cold) experiments. For 18°C experiment, flies spent their development stages at 25°C and divided 4 days after enclosing at 25°C or 18°C. For the molecular experiments, flies were anaesthetized with CO2 and males were separated from females before sacrificing the flies unless stated otherwise.
Oxygen consumption assays in whole tissue
Male flies were anesthetized on ice‐cold metal platform. Fly heads were removed and placed on a net (Seahorse Bioscience), carefully centered, and then inserted in a well (16 heads/well). Each well was filled with 700 μl of Seahorse buffer containing 2.5% glucose. During the preparation, the cart bridge was calibrated according to the manufacture instruction. The plate was calibrated at 31–33°C. Measurements of oxygen consumption were taken in cycles of 3‐min mixing, 2‐min delaying phase, and 2‐min measurements at 31–33°C. A 2‐min measurement was divided into 10 submeasurement referred to as ticks. The data shown in Figs 2B and EV2A are at the fifth measurement.
For direct injections, 77 μl of fresh assay buffer was injected. A stock solution of fresh sodium butyrate (Sigma) of 100 mM was dissolved in the assay buffer before injection and was pH‐adjusted. As such, the final concentration was 10 mM. Rotenone (Sigma) was dissolved in DMSO and stock solution of 50 μM was prepared in the assay buffer. As such, the final concentration was 5 μM. TSA (Sigma) was dissolved in DMSO and stock solution of 10 μM was prepared in the assay buffer. As such, the final concentration was 1 μM.
Oxygen consumption rate (OCR) was calculated with AKOS algorithm as previously described 53, while the sodium butyrate/TSA OCR was calculated with “Fixed” algorithm (Seahorse website) due to lower amount of oxygen, resulting from high oxygen consumption.
Fly physical activity measurements
For the data in Fig 1B, a vial was divided into four equal sections (“1” bottom of the vial, “4” top of the vial). Young and midlife males were flipped into the marked vial and the number of flies in each quadrat was measured after 3 s. The score of the performance was calculated based on the average of total flies. In order to create a better resolution in midlife experiments in data in Fig 5F, a vial was divided into equal five sections (“1” bottom of the vial, “5” top of the vial) instead of four and the number of flies was measured after 8 s instead of 3 s.
Metabolome analysis by mass spectrometry
Thirty milligrams of fly head tissues was collected for this experiment and stored at −80°C for 2–3 days before processing. Tissue was homogenized and polar metabolites extracted by vigorous vortexing with glass beads in 8 ml of a 40:40:20% (v/v) acetonitrile:methanol:water solution and incubation on ice for 2 h. To correct for sample loss during purification, samples were spiked with fully 13C‐labeled Escherichia coli metabolome extract as described previously 25. Debris of the pooled extracts was removed by centrifugation and samples were dried under vacuum using a SpeedVac (Christ GmbH, Osterode am Harz, Germany). Dried metabolites were resuspended in 100 μl of deionized water.
For non‐targeted MS approach, samples were analyzed by flow‐injection time‐of‐flight mass spectrometry with an Agilent 6550 QToF instrument (Agilent, Santa Clara, CA, USA) operated in negative ionization mode at 4 GHz high resolution in a range from 50 to 1,000 m/z using published settings 26. The mobile phase was 60:40 isopropanol:water (v/v) and 1 mM NH4F at pH 9.0 supplemented with 10 nM hexakis (1H, 1H, 3H‐tetrafluoropropoxy) phosphazine and 80 nM taurocholic acid for online mass correction. Spectral processing, ion annotation as selected deprotonated metabolites based on accurate mass within 0.001 Da, and normalization by U‐13C isotopomers were performed using MATLAB 2014b (The Mathworks, Natick, MA, USA) as described previously 26, 27. The resulting metabolites were analyzed by MetaboAnalyst 2.0 for enriched pathway analysis 54.
For targeted metabolomics 25, the metabolites were separated by ion‐pairing ultrahigh performance liquid chromatography (UPLC) using a Waters Acquity UPLC with a Waters Acquity T3 end‐capped reverse‐phase column (dimensions: 150 mm × 2.1 mm × 1.8 μm), followed by metabolite detection on a tandem mass spectrometer (Thermo TSQ Quantum Ultra triple quadrupole, Thermo Fisher Scientific). Peak detection and identification were performed using in‐house software. A dilution series of a standard solution containing over 80 metabolites and 13C internal standard was prepared and measured in parallel.
Enzymatic activity assay for citrate synthase and ATPCL
Assays were performed as previously described 55, 56 with the following adjustments. Thirty milligrams of fly heads was homogenized in 450 μl homogenizing buffer in the presence of 15 mM SB and 60 μM sirtinol, sonicated 2 × 5 s in low power, and rotated for 20 min on ice. Supernatant was collected following centrifugation of 20,000 g for 10 min. For ATPCL, 30 μl of the lysates was added to assay buffer. For citrate synthase assay, 10 μl was added. Samples were measured using a Varian‐Cary UV‐Vis 50 spectrophotometer. The enzymatic activity was normalized to total protein amount.
Western blots
A total of 25 male heads were collected and snap‐frozen. The heads were homogenized in high salt buffer (50 mM Tris–HCl pH 7.5, 500 mM NaCl, 1 mM EDTA, 0.1% NP‐40, and 20% glycerol) and supernatant was collected. A total of 15% of the supernatant was loaded on each gel lane (12%). Immunoblots were performed using fluorescent secondary antibodies (Licor) and data were quantified as previously described 34. Antibody for lysine acetylation was from Immunochem (ICP0380, 1:1,000).
Sample preparation and mass spectrometry for acetylome analysis
Fly samples were prepared as previously described 8, 57 with the following modifications. Briefly, 100 mg of male fly heads was homogenized in 1.4 ml homogenizing buffer (50 mM Tris–HCl pH 7.5, 500 mM NaCl, 1 mM EDTA, 0.1% NP‐40, and 20% glycerol) in the presence of 15 mM sodium butyrate and 60 μM of sirtinol (Tocris) and then added with 200 μl of 6 M urea/2 M thiourea. The proteins were digested for 4 h with 10 μg of Lys‐C (Wako) at 25°C, followed by overnight incubation (ON) with 300 μg trypsin (Worthington). Following the peptide isolation, peptide amount was measured by a nanodrop. Equal amount of peptides was enriched for acetylated peptides with 45 μl Ac‐K beads (ICP0388, Immunechem) overnight. Beads were washed 4× in PBS–Tween 0.1% followed by 4× in PBS. Finally, peptides were eluted with 125 μl of TFA 0.1% and were concentrated to a final volume of 17 μl. As input, 15 μl of each sample was taken before the enrichment for acetylated lysines and was diluted in TFA 0.1% and around 30 μg was desalted. From the resulting desalted samples, 3 μg was analyzed by mass spectrometry as described below.
Acetylome mass spectrometry
Tryptic peptides were separated in an Ultimate 3000 HPLC system (Dionex) as described elsewhere 58 with minor modifications. The effluent from the HPLC was directly electrosprayed into a LTQ Orbitrap XL mass spectrometer (Thermo Fisher Scientific). The MS instrument was operated in data‐dependent mode. Survey full‐scan MS spectra (from m/z 300–2,000) were acquired in the Orbitrap with R = 60,000 at m/z 400 (after accumulation to a “target value” of 500,000 in the linear ion trap). The 6 most intense peptide ions with charge states between 2 and 4 were sequentially isolated to a target value of 10,000 and fragmented by collision‐induced dissociation (CID) and recorded in the linear ion trap. For all measurements with the Orbitrap detector, three lock‐mass ions were used for internal calibration 57. Typical MS conditions were as follows: spray voltage, 1.5 kV; no sheath and auxiliary gas flow; heated capillary temperature, 200°C; normalized CID energy 35%; activation q = 0.25; and activation time = 30 ms.
Proteins were identified and quantified using Maxquant 1.4.1.2 (Database, Swissprot 57.10; Taxonomy, Drosophila melanogaster), with default settings except: variable modifications = oxidation (M), acetylation (K), and acetylation (N‐term); unique and razor, min. peptides = 1; match between windows = 2 min.
The intensities of the acetylation peptides were normalized to the intensities of its protein from the input sample. Statistical analysis was performed only for acetylated peptides present in at least 3 biological replicas per group. The mass spectrometry proteomics data have been deposited to the ProteomeXchange consortium 59 via the PRIDE partner repository with the dataset identifier PXD003318.
Data mining
GO gene ontology associations were obtained from an amiGO (www.geneontology.org/) Drosophila database (Submission Date: 7/17/2012). KEGG pathway enrichment analysis was performed using the functional annotation tool of the Database for Annotation, Visualization, and Integrated Discovery (DAVID) with a score threshold of 0.05.
Quantification of histone acetylation
Histones were acid‐extracted (0.2 M sulfuric acid) from 100 to 150 fly heads, resolved by 15% SDS–PAGE, acetylated in gel with d6‐acetic anhydride (99%D, Sigma, D3AA) and digested with trypsin. The D3AA step derivatives non‐modified lysines to acetyl‐lysine containing a mass shift of +3, which allows the distinction of it from an endogenous (cellular) acetylation. Tryptic peptides were desalted using Stagetip and injected in an Ultimate HPLC system (Dionex). Peptides were separated with a gradient from 5% to 60% acetonitrile in 0.1% formic acid over 40 min at 300 nl/min on a C18 analytical column (75 μm i.d. ×15 cm, packed in‐house with ReproSil‐Pur C18 AQ 2.4 μm; Doctor Maisch). The effluent from the HPLC was directly electrosprayed into a LTQ Orbitrap Classic mass spectrometer (Thermo Fisher Scientific). The MS instrument was programmed to acquire survey full‐scan MS spectra (m/z 718–730 for H4 only, m/z 270–1,600 for H3 + H4) in the Orbitrap with resolution R = 15,000 at m/z 400 (after accumulation to a “target value” of 500,000 in the linear ion trap) followed by the isolation to a target value of 10,000 and fragmentation by collision‐induced dissociation of the masses described in Feller et al 32. Typical MS conditions were spray voltage, 1.5 kV; no sheath and auxiliary gas flow; heated capillary temperature, 200°C; normalized collision‐induced dissociation energy 35%; activation q = 0.25; and activation time = 30 ms. For detailed method, see reference 32.
Quantitative real‐time PCR
RT–PCR was performed using a Roche 480 light cycler. The cDNA was generated using the SuperScript III First‐Strand synthesis kit (Invitrogen). The RT–PCR results for ATPCL, chm region exon 1, and exons 8–10 were normalized to the levels of actin 5c.
The primers for ATPCL were as follows: 5′‐CCC TTA GGG GTT TTG GAA TC‐3′ and 5′‐AAT GTT ATG CCG GGT ACT GG‐3′. The primers for chm exon 1 region were as follows: 5′‐CAA TGG GCA GTT CCA CTG TA‐3′ and 5′‐GGA TTG CTC GGT TTG TTA GC‐3′, and for chm exons 8–10 region were as follows: 5′‐CAA TAT CCA GCC GAG CTC AT‐3′ and 5′‐AGC CAA GAA TTC GTC ATC GT‐3′. The primers for actin 5c were as follows: 5′‐CAG AGC AAG CGT GGT ATC CT‐3′ and 5′‐GTG TGG TGC CAG ATC TTC T‐3′.
RNA‐seq assays
Total RNA was prepared from 25 to 30 fly heads using 0.5 ml Qiazol (Qiagen) according to manufacturer's instructions. 2.5 μg of RNA was used for polyA selection and subsequent RNA purification was achieved with RNeasy mini columns (Qiagen). Libraries were prepared using New England Biolabs reagents according to protocols (E7490, E6150, E7525, E6111, E7442, E7335). The ligation was done at 16°C overnight with regular ligase (M0202) and high‐fidelity PCR mix (M0541) was used for amplification. Quantifications and quality controls were done with Qubit RNA HS detection kit (Life Technologies) and the RNA 6000 pico kit and DNA 2000 kits (Agilent). 50‐bp single reads were obtained on an Illumina HiSeq sequencer on average 30 million reads per sample at the Sequencing Core facility of the LMU (La Fuga). Alignment was performed using Tophat2 v2.0.5 60 against the reference genome (BDGP5.74) with an average alignment rate of 92%. Reads were counted at genomic features (i.e., exons) using the summarizeOverlaps function in the GenomicAlignments R/Bioconductor package. Differential expression tests were performed using the EdgeR package and significant differences were called with an FDR cutoff 0.05 61, 62. Transcriptomic data were deposited at the genome expression omnibus repository (GEO) with the accession number GSE75216.
Statistical analysis
The nature of our study was explorative, and thus our experiments had no prespecified effect size. As such, the sample number for most of the experiment was at least five per biological condition. For the novel techniques of targeted mass spectrometry histone acetylation quantification and oxygen consumption analysis in young vs. midlife, we used at least 10 biological replicates.
In general, sample preparation involved randomization during preparation and analysis. Similarly, flies for survival curves were randomly collected for the various experiments and were flipped in random order throughout the life span assays.
Each of the survival curves consisted at least of 4–6 different vials per condition. Overall, most survival experiments were repeated at least 2–3 times. For the chm mutants survival experiments, two further (four in total) survival experiments were done by two co‐authors, which were blinded for the identity of the flies (wild‐type or chm mutant).
Unless otherwise stated, the data were analyzed with unpaired two‐tailed Student's t‐test. The quantitative analysis of acetylomes was based on label‐free intensity measurements by mass spectrometry. Data analysis was performed using R/Bioconductor (bioconductor.org) with standard parameters if not indicated otherwise. We removed acetylated peptides from analyses if more than 50% of the samples in one group had missing data. The remaining missing data points were imputed by k‐nearest neighbor (package “imputation”, k = 1). Imputation was performed within each age group for the acetylated peptides and the corresponding input proteins, respectively. The log2 ratio of acetylated peptide intensity and input protein intensity served as acetylation enrichment measure. Differential acetylation was estimated using a linear model (package “limma”) taking into account the two different batches of experiments (n = 4 and n = 1). Using the procedure by Benjamini & Hochberg, the resulting P‐values were adjusted for multiple testing. The same approach was taken to address differential expression on the level of the input proteins.
Author contributions
SP, AI, and AGL designed the study. SP coordinated the experiments and carried out the majority of wet‐laboratory procedures. CF and IF developed the mass spectrometry protocol for histone acetylation. CF designed the histone experiments together with SP, analyzed the histone data, and proposed the Chameau experiments. IF performed MS measurements. ES, CK, and LB assisted with the oxygen consumption tests. TSt performed the statistical analysis and generated the figures for the acetylome. TSc, CR, and MSN performed the RNA‐seq and TSc generated the RNA‐seq figures. MSN prepared total RNA from flies and performed RT‐Q‐PCR. CR oversaw the RNA‐Seq library preparation, TSc analyzed the RNA‐seq data and generated the corresponding figures. DCS and US conducted the metabolites mass spectrometry experiments. MP and PBB provided fly stocks and reagents and critically commented on fly genetics experiments. TK oversaw the metabolic activity assays. AI and AGL supervised the project; SP, CF, AI, and AGL wrote the manuscript and all authors revised and approved the final version.
Conflict of interest
The authors declare that they have no conflict of interest.
Supporting information
Expanded View Figures PDF
Dataset EV1
Dataset EV2
Dataset EV3
Dataset EV4
Review Process File
Acknowledgements
We thank Carla Margulies and her team for extensive experimental support with Drosophila and members of A.I.'s team for help with proteomic tools. We would like also to thank Silke Krause, Zdenka Stanic, Ira Brandstetter, Anna Purcarea, and Grete Reisenauer for the assistance in the laboratory work and Jürg Mueller for providing the control fly strain for the atpcl mutant flies. We thank the sequencing unit of the Laboratory for Functional Genome Analysis (La Fuga, Gene Center, LMU) for performing next generation sequencing. A.G.L. was funded by the LMU, the Bavarian research network BioSysNet, and the ERA‐NET Neuron project FOODforTHOUGHT. A.G.L. and A.I. were funded by a grant from the European Union FP7 Network of Excellence EpiGeneSys (Project 257082), the DFG Excellence Clusters CIPSM and SyNergy, as well as the DFG Collaborative Research Center 1064 (projects A3 and Z3). In addition, A.I. acknowledges funds from the EU FP7 network STATegra (grant agreement 306000). P.B.B. acknowledges the European Research Council (grant agreement 293948). T.K. acknowledges funding from the German Federal Ministry of Education and Research (BMBF, grant no. 01GM1113A) to the German Network for Mitochondrial Disorders (mitoNET) and from EU FP7 to the TIRCON project (grant agreement no. 277984). L.B. and E.S. have been funded by the German Federal Ministry of Education and Research (Infrafrontier grant 01KX1012) and by the Helmholtz Alliance for Mental Health in an Aging Society (HA‐215). D.C.S was funded by the MetaNetX project of the Swiss Initiative for Systems Biology (SystemsX.ch) evaluated by the Swiss National Science Foundation. C.F. was a fellow of the International Max Planck Research School in Munich (IMPRS‐LS) and is currently funded by a DFG postdoctoral fellowship (1544/1‐1). S.P. is funded by an AXA Research Fund postdoctoral fellowship. C.K and M.S.N were supported by the AXA Research Fund grant provided to S.P.
EMBO Reports (2016) 17: 455–469
References
- 1. Wallace DC (2005) A mitochondrial paradigm of metabolic and degenerative diseases, aging, and cancer: a dawn for evolutionary medicine. Annu Rev Genet 39: 359–407 [DOI] [PMC free article] [PubMed] [Google Scholar]
- 2. Trifunovic A, Wredenberg A, Falkenberg M, Spelbrink JN, Rovio AT, Bruder CE, Bohlooly‐Y M, Gidlöf S, Oldfors A, Wibom R et al (2004) Premature ageing in mice expressing defective mitochondrial DNA polymerase. Nature 429: 417–423 [DOI] [PubMed] [Google Scholar]
- 3. Dillin A, Hsu A‐L, Arantes‐Oliveira N, Lehrer‐Graiwer J, Hsin H, Fraser AG, Kamath RS, Ahringer J, Kenyon C (2002) Rates of behavior and aging specified by mitochondrial function during development. Science 298: 2398–2401 [DOI] [PubMed] [Google Scholar]
- 4. Rea SL, Ventura N, Johnson TE (2007) Relationship between mitochondrial electron transport chain dysfunction, development, and life extension in Caenorhabditis elegans . PLoS Biol 5: e259 [DOI] [PMC free article] [PubMed] [Google Scholar]
- 5. Weindruch R, Walford RL, Fligiel S, Guthrie D (1986) The retardation of aging in mice by dietary restriction: longevity, cancer, immunity and lifetime energy intake. J Nutr 116: 641–654 [DOI] [PubMed] [Google Scholar]
- 6. Fontana L, Partridge L, Longo VD (2010) Extending healthy life span–from yeast to humans. Science 328: 321–326 [DOI] [PMC free article] [PubMed] [Google Scholar]
- 7. Gräff J, Tsai L‐H (2013) Histone acetylation: molecular mnemonics on the chromatin. Nat Rev Neurosci 14: 97–111 [DOI] [PubMed] [Google Scholar]
- 8. Choudhary C, Kumar C, Gnad F, Nielsen ML, Rehman M, Walther TC, Olsen JV, Mann M (2009) Lysine acetylation targets protein complexes and co‐regulates major cellular functions. Science 325: 834–840 [DOI] [PubMed] [Google Scholar]
- 9. Mouchiroud L, Houtkooper RH, Moullan N, Katsyuba E, Ryu D, Cantó C, Mottis A, Jo Y‐S, Viswanathan M, Schoonjans K et al (2013) The NAD(+)/sirtuin pathway modulates longevity through activation of mitochondrial UPR and FOXO signaling. Cell 154: 430–441 [DOI] [PMC free article] [PubMed] [Google Scholar]
- 10. Guarente L (2000) Sir2 links chromatin silencing, metabolism, and aging. Genes Dev 14: 1021–1026 [PubMed] [Google Scholar]
- 11. Wellen KE, Hatzivassiliou G, Sachdeva UM, Bui TV, Cross JR, Thompson CB (2009) ATP‐citrate lyase links cellular metabolism to histone acetylation. Science 324: 1076–1080 [DOI] [PMC free article] [PubMed] [Google Scholar]
- 12. Guan K‐L, Xiong Y (2011) Regulation of intermediary metabolism by protein acetylation. Trends Biochem Sci 36: 108–116 [DOI] [PMC free article] [PubMed] [Google Scholar]
- 13. López‐Otín C, Blasco MA, Partridge L, Serrano M, Kroemer G (2013) The hallmarks of aging. Cell 153: 1194–1217 [DOI] [PMC free article] [PubMed] [Google Scholar]
- 14. Benayoun BA, Pollina EA, Brunet A (2015) Epigenetic regulation of ageing: linking environmental inputs to genomic stability. Nat Rev Mol Cell Biol 16: 593–610 [DOI] [PMC free article] [PubMed] [Google Scholar]
- 15. Zahn JM, Kim SK (2007) Systems biology of aging in four species. Curr Opin Biotechnol 18: 355–359 [DOI] [PMC free article] [PubMed] [Google Scholar]
- 16. Bahar R, Hartmann CH, Rodriguez KA, Denny AD, Busuttil RA, Dollé MET, Calder RB, Chisholm GB, Pollock BH, Klein CA et al (2006) Increased cell‐to‐cell variation in gene expression in ageing mouse heart. Nature 441: 1011–1014 [DOI] [PubMed] [Google Scholar]
- 17. Sen P, Dang W, Donahue G, Dai J, Dorsey J, Cao X, Liu W, Cao K, Perry R, Lee JY et al (2015) H3K36 methylation promotes longevity by enhancing transcriptional fidelity. Genes Dev 29: 1362–1376 [DOI] [PMC free article] [PubMed] [Google Scholar]
- 18. Vermulst M, Denney AS, Lang MJ, Hung C‐W, Moore S, Mosely AM, Thompson WJ, Madden V, Gauer J, Wolfe KJ et al (2015) Transcription errors induce proteotoxic stress and shorten cellular lifespan. Nat Commun 6: 8065 [DOI] [PMC free article] [PubMed] [Google Scholar]
- 19. Harries LW, Hernandez D, Henley W, Wood AR, Holly AC, Bradley‐Smith RM, Yaghootkar H, Dutta A, Murray A, Frayling TM et al (2011) Human aging is characterized by focused changes in gene expression and deregulation of alternative splicing. Aging Cell 10: 868–878 [DOI] [PMC free article] [PubMed] [Google Scholar]
- 20. Nicholas A, de Magalhaes JP, Kraytsberg Y (2010) Age‐related gene‐specific changes of A‐to‐I mRNA editing in the human brain. Mech Ageing Dev 131: 445–447 [DOI] [PMC free article] [PubMed] [Google Scholar]
- 21. Siebold AP, Banerjee R, Tie F, Kiss DL, Moskowitz J, Harte PJ (2010) Polycomb Repressive Complex 2 and Trithorax modulate Drosophila longevity and stress resistance. Proc Natl Acad Sci 107: 169–174 [DOI] [PMC free article] [PubMed] [Google Scholar]
- 22. Greer EL, Maures TJ, Hauswirth AG, Green EM, Leeman DS, Maro GS, Han S, Banko MR, Gozani O, Brunet A (2010) Members of the H3K4 trimethylation complex regulate lifespan in a germline‐dependent manner in C. elegans . Nature 466: 383–387 [DOI] [PMC free article] [PubMed] [Google Scholar]
- 23. Larson K, Yan S‐J, Tsurumi A, Liu J, Zhou J, Gaur K, Guo D, Eickbush TH, Li WX (2012) Heterochromatin formation promotes longevity and represses ribosomal RNA synthesis. PLoS Genet 8: e1002473 [DOI] [PMC free article] [PubMed] [Google Scholar]
- 24. Tamura T, Chiang A‐S, Ito N, Liu H‐P, Horiuchi J, Tully T, Saitoe M (2003) Aging specifically impairs amnesiac‐dependent memory in Drosophila. Neuron 40: 1003–1011 [DOI] [PubMed] [Google Scholar]
- 25. Buescher JM, Moco S, Sauer U, Zamboni N (2010) Ultrahigh performance liquid chromatography‐tandem mass spectrometry method for fast and robust quantification of anionic and aromatic metabolites. Anal Chem 82: 4403–4412 [DOI] [PubMed] [Google Scholar]
- 26. Fuhrer T, Heer D, Begemann B, Zamboni N (2011) High‐throughput, accurate mass metabolome profiling of cellular extracts by flow injection‐time‐of‐flight mass spectrometry. Anal Chem 83: 7074–7080 [DOI] [PubMed] [Google Scholar]
- 27. Sévin DC, Sauer U (2014) Ubiquinone accumulation improves osmotic‐stress tolerance in Escherichia coli . Nat Chem Biol 10: 266–272 [DOI] [PubMed] [Google Scholar]
- 28. Hebert AS, Dittenhafer‐Reed KE, Yu W, Bailey DJ, Selen ES, Boersma MD, Carson JJ, Tonelli M, Balloon AJ, Higbee AJ et al (2013) Calorie restriction and SIRT3 trigger global reprogramming of the mitochondrial protein acetylome. Mol Cell 49: 186–199 [DOI] [PMC free article] [PubMed] [Google Scholar]
- 29. Peek CB, Ramsey KM, Levine DC, Marcheva B, Perelis M, Bass J (2015) Circadian regulation of cellular physiology. Meth Enzymol 552: 165–184 [DOI] [PMC free article] [PubMed] [Google Scholar]
- 30. Zhao S, Xu W, Jiang W, Yu W, Lin Y, Zhang T, Yao J, Zhou L, Zeng Y, Li H et al (2010) Regulation of cellular metabolism by protein lysine acetylation. Science 327: 1000–1004 [DOI] [PMC free article] [PubMed] [Google Scholar]
- 31. Rothbart SB, Lin S, Britton L‐M, Krajewski K, Keogh M‐C, Garcia BA, Strahl BD (2012) Poly‐acetylated chromatin signatures are preferred epitopes for site‐specific histone H4 acetyl antibodies. Sci Rep 2: 489 [DOI] [PMC free article] [PubMed] [Google Scholar]
- 32. Feller C, Forne I, Imhof A, Becker PB (2015) Global and specific responses of the histone acetylome to systematic perturbation. Mol Cell 57: 559–571 [DOI] [PubMed] [Google Scholar]
- 33. Dang W, Steffen KK, Perry R, Dorsey JA, Johnson FB, Shilatifard A, Kaeberlein M, Kennedy BK, Berger SL (2009) Histone H4 lysine 16 acetylation regulates cellular lifespan. Nature 459: 802–807 [DOI] [PMC free article] [PubMed] [Google Scholar]
- 34. Peleg S, Sananbenesi F, Zovoilis A, Burkhardt S, Bahari‐Javan S, Agis‐Balboa RC, Cota P, Wittnam JL, Gogol‐Doering A, Opitz L et al (2010) Altered histone acetylation is associated with age‐dependent memory impairment in mice. Science 328: 753–756 [DOI] [PubMed] [Google Scholar]
- 35. Gut P, Verdin E (2013) The nexus of chromatin regulation and intermediary metabolism. Nature 502: 489–498 [DOI] [PubMed] [Google Scholar]
- 36. Katada S, Imhof A, Sassone‐Corsi P (2012) Connecting threads: epigenetics and metabolism. Cell 148: 24–28 [DOI] [PubMed] [Google Scholar]
- 37. Imai S, Armstrong CM, Kaeberlein M, Guarente L (2000) Transcriptional silencing and longevity protein Sir2 is an NAD‐dependent histone deacetylase. Nature 403: 795–800 [DOI] [PubMed] [Google Scholar]
- 38. Pletcher SD, Macdonald SJ, Marguerie R, Certa U, Stearns SC, Goldstein DB, Partridge L (2002) Genome‐wide transcript profiles in aging and calorically restricted Drosophila melanogaster. Curr Biol 12: 712–723 [DOI] [PubMed] [Google Scholar]
- 39. Allemand R, Cohet Y, David J (1973) Increase in the longevity of adult Drosophila melanogaster kept in permanent darkness. Exp Gerontol 8: 279–283 [DOI] [PubMed] [Google Scholar]
- 40. Miquel J, Lundgren PR, Bensch KG, Atlan H (1976) Effects of temperature on the life span, vitality and fine structure of Drosophila melanogaster. Mech Ageing Dev 5: 347–370 [DOI] [PubMed] [Google Scholar]
- 41. Spradling AC, Stern D, Beaton A, Rhem EJ, Laverty T, Mozden N, Misra S, Rubin GM (1999) The Berkeley Drosophila Genome Project gene disruption project: single P‐element insertions mutating 25% of vital Drosophila genes. Genetics 153: 135–177 [DOI] [PMC free article] [PubMed] [Google Scholar]
- 42. Miotto B, Sagnier T, Berenger H, Bohmann D, Pradel J, Graba Y (2006) Chameau HAT and DRpd3 HDAC function as antagonistic cofactors of JNK/AP‐1‐dependent transcription during Drosophila metamorphosis. Genes Dev 20: 101–112 [DOI] [PMC free article] [PubMed] [Google Scholar]
- 43. de Magalhães JP, Curado J, Church GM (2009) Meta‐analysis of age‐related gene expression profiles identifies common signatures of aging. Bioinformatics 25: 875–881 [DOI] [PMC free article] [PubMed] [Google Scholar]
- 44. Wellen KE, Thompson CB (2012) A two‐way street: reciprocal regulation of metabolism and signalling. Nat Rev Mol Cell Biol 13: 270–276 [DOI] [PubMed] [Google Scholar]
- 45. Lin R, Tao R, Gao X, Li T, Zhou X, Guan K‐L, Xiong Y, Lei Q‐Y (2013) Acetylation stabilizes ATP‐citrate lyase to promote lipid biosynthesis and tumor growth. Mol Cell 51: 506–518 [DOI] [PMC free article] [PubMed] [Google Scholar]
- 46. Eisenberg T, Schroeder S, Andryushkova A, Pendl T, Küttner V, Bhukel A, Mariño G, Pietrocola F, Harger A, Zimmermann A et al (2014) Nucleocytosolic depletion of the energy metabolite acetyl‐coenzyme a stimulates autophagy and prolongs lifespan. Cell Metab 19: 431–444 [DOI] [PMC free article] [PubMed] [Google Scholar]
- 47. Mariño G, Pietrocola F, Eisenberg T, Kong Y, Malik SA, Andryushkova A, Schroeder S, Pendl T, Harger A, Niso‐Santano M et al (2014) Regulation of autophagy by cytosolic acetyl‐coenzyme A. Mol Cell 53: 710–725 [DOI] [PubMed] [Google Scholar]
- 48. Wang Z, Zang C, Rosenfeld JA, Schones DE, Barski A, Cuddapah S, Cui K, Roh T‐Y, Peng W, Zhang MQ et al (2008) Combinatorial patterns of histone acetylations and methylations in the human genome. Nat Genet 40: 897–903 [DOI] [PMC free article] [PubMed] [Google Scholar]
- 49. Gomes AP, Price NL, Ling AJY, Moslehi JJ, Montgomery MK, Rajman L, White JP, Teodoro JS, Wrann CD, Hubbard BP et al (2013) Declining NAD(+) induces a pseudohypoxic state disrupting nuclear‐mitochondrial communication during aging. Cell 155: 1624–1638 [DOI] [PMC free article] [PubMed] [Google Scholar]
- 50. Burnett C, Valentini S, Cabreiro F, Goss M, Somogyvári M, Piper MD, Hoddinott M, Sutphin GL, Leko V, McElwee JJ et al (2011) Absence of effects of Sir2 overexpression on lifespan in C. elegans and Drosophila. Nature 477: 482–485 [DOI] [PMC free article] [PubMed] [Google Scholar]
- 51. Cimen H, Han M‐J, Yang Y, Tong Q, Koc H, Koc EC (2010) Regulation of succinate dehydrogenase activity by SIRT3 in mammalian mitochondria. Biochemistry 49: 304–311 [DOI] [PMC free article] [PubMed] [Google Scholar]
- 52. Grienenberger A, Miotto B, Sagnier T, Cavalli G, Schramke V, Geli V, Mariol MC, Berenger H, Graba Y, Pradel J (2002) The MYST domain acetyltransferase Chameau functions in epigenetic mechanisms of transcriptional repression. Curr Biol 12: 762–766 [DOI] [PubMed] [Google Scholar]
- 53. Gerencser AA, Neilson A, Choi SW, Edman U, Yadava N, Oh RJ, Ferrick DA, Nicholls DG, Brand MD (2009) Quantitative microplate‐based respirometry with correction for oxygen diffusion. Anal Chem 81: 6868–6878 [DOI] [PMC free article] [PubMed] [Google Scholar]
- 54. Xia J, Sinelnikov IV, Han B, Wishart DS (2015) MetaboAnalyst 3.0–making metabolomics more meaningful. Nucleic Acids Res 43: W251–W257 [DOI] [PMC free article] [PubMed] [Google Scholar]
- 55. Fischer JC, Ruitenbeek W, Gabreëls FJ, Janssen AJ, Renier WO, Sengers RC, Stadhouders AM, ter Laak HJ, Trijbels JM, Veerkamp JH (1986) A mitochondrial encephalomyopathy: the first case with an established defect at the level of coenzyme Q. Eur J Pediatr 144: 441–444 [DOI] [PubMed] [Google Scholar]
- 56. Srere PA (1959) The citrate cleavage enzyme. I. Distribution and purification. J Biol Chem 234: 2544–2547 [PubMed] [Google Scholar]
- 57. Masri S, Patel VR, Eckel‐Mahan KL, Peleg S, Forne I, Ladurner AG, Baldi P, Imhof A, Sassone‐Corsi P (2013) Circadian acetylome reveals regulation of mitochondrial metabolic pathways. Proc Natl Acad Sci 110: 3339–3344 [DOI] [PMC free article] [PubMed] [Google Scholar]
- 58. Forné I, Ludwigsen J, Imhof A, Becker PB, Mueller‐Planitz F (2012) Probing the conformation of the ISWI ATPase domain with genetically encoded photoreactive crosslinkers and mass spectrometry. Mol Cell Proteomics 11: M111.012088. [DOI] [PMC free article] [PubMed] [Google Scholar]
- 59. Vizcaíno JA, Deutsch EW, Wang R, Csordas A, Reisinger F, Ríos D, Dianes JA, Sun Z, Farrah T, Bandeira N et al (2014) ProteomeXchange provides globally coordinated proteomics data submission and dissemination. Nat Biotechnol 32: 223–226 [DOI] [PMC free article] [PubMed] [Google Scholar]
- 60. Kim D, Pertea G, Trapnell C, Pimentel H, Kelley R, Salzberg SL (2013) TopHat2: accurate alignment of transcriptomes in the presence of insertions, deletions and gene fusions. Genome Biol 14: R36 [DOI] [PMC free article] [PubMed] [Google Scholar]
- 61. Robinson MD, Oshlack A (2010) A scaling normalization method for differential expression analysis of RNA‐seq data. Genome Biol 11: R25 [DOI] [PMC free article] [PubMed] [Google Scholar]
- 62. Love MI, Huber W, Anders S (2014) Moderated estimation of fold change and dispersion for RNA‐seq data with DESeq2. Genome Biol 15: 550 [DOI] [PMC free article] [PubMed] [Google Scholar]
Associated Data
This section collects any data citations, data availability statements, or supplementary materials included in this article.
Supplementary Materials
Expanded View Figures PDF
Dataset EV1
Dataset EV2
Dataset EV3
Dataset EV4
Review Process File