Abstract
Study Objectives:
Sound level meter is the gold standard approach for snoring evaluation. Using this approach, it was established that snoring intensity (in dB) is higher for men and is associated with increased apnea-hypopnea index (AHI). In this study, we performed a systematic analysis of breathing and snoring sound characteristics using an algorithm designed to detect and analyze breathing and snoring sounds. The effect of sex, sleep stages, and AHI on snoring characteristics was explored.
Methods:
We consecutively recruited 121 subjects referred for diagnosis of obstructive sleep apnea. A whole night audio signal was recorded using noncontact ambient microphone during polysomnography. A large number (> 290,000) of breathing and snoring (> 50 dB) events were analyzed. Breathing sound events were detected using a signal-processing algorithm that discriminates between breathing and nonbreathing (noise events) sounds.
Results:
Snoring index (events/h, SI) was 23% higher for men (p = 0.04), and in both sexes SI gradually declined by 50% across sleep time (p < 0.01) independent of AHI. SI was higher in slow wave sleep (p < 0.03) compared to S2 and rapid eye movement sleep; men have higher SI in all sleep stages than women (p < 0.05). Snoring intensity was similar in both genders in all sleep stages and independent of AHI. For both sexes, no correlation was found between AHI and snoring intensity (r = 0.1, p = 0.291).
Conclusions:
This audio analysis approach enables systematic detection and analysis of breathing and snoring sounds from a full night recording. Snoring intensity is similar in both sexes and was not affected by AHI.
Citation:
Levartovsky A, Dafna E, Zigel Y, Tarasiuk A. Breathing and snoring sound characteristics during sleep in adults. J Clin Sleep Med 2016;12(3):375–384.
Keywords: breathing, obstructive sleep apnea, sex, snoring, sound analysis
INTRODUCTION
Breathing sounds are generated by air turbulence in the upper airway due to increased airway resistance during sleep.1–7 Inspiratory breathing sounds can vary significantly across sleep and between subjects; in some cases the sounds may be soft (sound intensity < 40 dB), but in others it can be loud.8–16 Intense breathing sounds are commonly referred to as snoring.10,13–16 The most accepted estimate for the prevalence of chronic snoring is 40% in adult men and 20% in adult women, although the variability is extremely large.16 Early work has shown a poor correlation between measured loudness of snoring and subjective appreciation by different observers. It is recognized that to a large extent snoring is “in the ear of the beholder”.14
Several studies have addressed the issue of detection of snoring sounds from a recorded audio signal during sleep using signal processing and pattern recognition algorithms.10,17–23 Recently, we showed that audio-based features, extracted from audio recordings, can accurately detect, not only snoring sounds, but also sleep breathing sound events (intensity > 20 dB) even in a very quiet environment, with accuracy > 98%.10 We also found that more than 97% of the snoring events occurred during inspiration; expiratory sound events are not common, confirming earlier reports.9,21 This approach of detection of breathing sounds was further validated to reliably estimate apnea-hypopnea index (AHI)24 and sleep-wake activity25 in laboratory and at-home environments.26,27
BRIEF SUMMARY
Current Knowledge/Study Rationale: It is commonly thought that snoring intensity is greater for men than for women and it is correlated with apnea-hypopnea index (AHI); however, these claims were not critically investigated. In this study, we performed a systematic analysis of breathing and snoring sound characteristics using a novel signal-processing algorithm and analyze breathing and snoring sounds.
Study Impact: Here, we used an objective valid breathing and snoring feature analysis and provided evidence that although snoring index is sex dependent, snoring intensity is similar across sexes and is not correlated with AHI.
It is commonly known that snoring intensity (dB) is higher for men than for women13,21 and it is correlated with AHI.9,13,15,21,28 However, some studies reported that there was no difference in the maximal snoring sound intensity between women and men.29 To our knowledge, these claims were not completely investigated because the sound level meter that has been used in all of these studies captures all the sounds in the room and not just the relevant inspiratory sounds of snoring. Obstructive sleep apnea (OSA) is associated with fragmented sleep that affects the overall sound due to movement noises, expiratory sounds not related to snoring, coughs, etc. It is possible that the reported correlation between AHI and sound intensity15,28 are not solely related to snoring per se. In the current study we extracted inspiratory breathing-sound features during sleep, from the time and frequency domain, using a validated approach that enables discrimination between inspiratory breathing and snoring sounds (the signal of interest) and other sounds (noise events).10 Here, we analyzed the effect of sex, OSA severity, and sleep stages on the feature characteristics of inspiratory breathing and snoring sounds during whole-night polysomnography (PSG).
METHODS
Setting
The study was conducted in the university affiliated sleep-wake disorder center and biomedical signal-processing laboratory. The Institutional Review Committee of Soroka University Medical Center approved this study protocol (protocol number 10621).
Subjects
We consecutively recruited a total of 121 adults aged 19 through 86 y (41/80 women/men) referred to the Sleep-Wake Unit for routine PSG study for sleep disorders diagnosis between February 2009 and March 2012. Subjects reported to the laboratory at 20:30 and were discharged at 06:00 the following morning. They were encouraged to maintain their usual daily routine and to avoid any caffeine and/or alcohol intake on the day of the study. The questionnaires were completed prior to the PSG study. Each individual's lifestyle, sleeping habits, and clinical history were recorded using a standardized self-administered questionnaire.30–32 The Epworth Sleepiness Scale (ESS) was used to evaluate daytime sleepiness.33
Polysomnography Study
The laboratory environment was sleep-friendly according to recommendations of the National Sleep Foundation.34 PSG study (SomniPro 19 PSG, Deymed Diagnostic, Hronov, Czech Republic) included electroencephalography (referential derivations, international 10–20 system, C3/A2, C4/A1, and O2/ A1, O1/A2), electrooculography, electromyography, electro-cardiography, respiratory activity (abdomen and chest effort belts – respiratory inductance plethysmography), and oxygen saturation. Simultaneous video monitoring was digitally recorded. An apnea was defined as > 90% decrease in the amplitude of airflow. Hypopnea was defined as > 50% decrease in the amplitude of airflow associated with an arousal and/ or ≥ 4% oxygen desaturation. A minimum event duration of 10 sec was required. AHI was calculated as the number of respiratory events per hour of sleep. OSA group was defined as AHI ≥ 10 events per hour; AHI < 10 events per hour was defined as the comparison group. Scoring34 was done by a trained technologist and underwent a second scoring by one of the investigators (AT).
Sound Acquisition
Acoustic signals were recorded using a non-contact directional microphone (RØDE, NTG-1, Silverwater, Australia) placed 1 m above the bed and connected to a digital audio recording device (Edirol R-4 Pro, Bellingham, WA, USA). The acquired audio signals were stored along with the PSG signals for later analysis. Each recorded signal was digitized and synchronized with PSG study onset to enable full night audio signal acquisition. Sound intensity (dBA) calibration of the audio-recorded signals was performed using a sound generator (sinus wave at 1 kHz) and an A-weighted sound level meter (Quest Technology 2700, Orlando, FL, USA). This calibration process was carefully validated across data collection. Audio signal processing was performed using MATLAB (R-2012b, The MathWorks, Inc, Natick, MA, USA).
Sounds Analysis
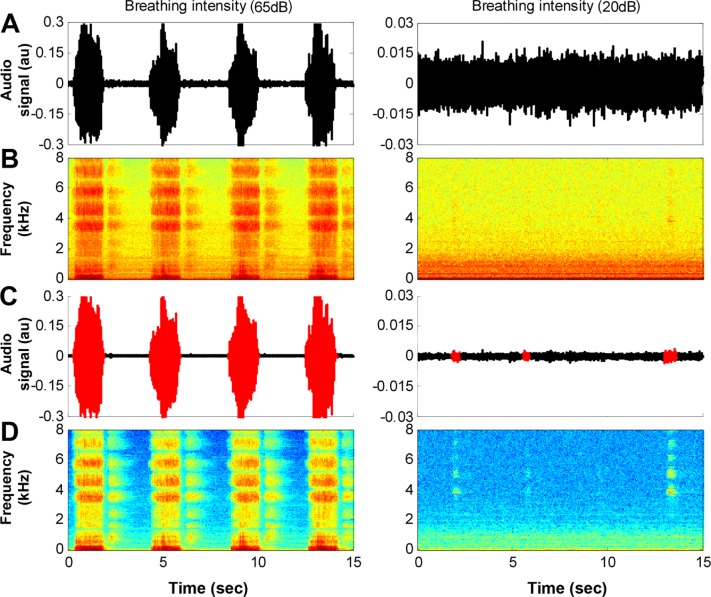
We developed a system for analyzing breathing and snoring sound properties comprising a non-contact microphone, digital audio recording device, and an algorithm that calculates breathing features from a whole-night audio signal (Figure 1). After the conclusion of the PSG study, the audio signal was enhanced by a background noise reduction algorithm.10,25 Using audio signal processing and pattern recognition techniques, breathing sound events were automatically located, segmented, and isolated using our breathing detection system10 that can detect low intensity (> 20 dB) breathing sounds (Figure 2). Because there is a considerable amount of breathing sound events below 40 dB (and above 20 dB), for the purpose of this study the analysis was performed for the entire set of detected breathing sounds (range: 20–85 dB). Breathing sounds may occur during inspiration and/or expiration. We analyzed the inspiratory sounds events since 97.5 ± 2.2% of noisy breathing cycles during sleep occurred during inspiration and these events were much louder than the expiratory sound events.10 This system was validated to distinguish breathing sounds from irrelevant noises, such as movements, linen noises, speech, and other interferences. This system's average detection rate (accuracy) was 98.2% with sensitivity of 98.0% (breathing sound as a breathing sound) and specificity of 98.3% (noise as noise).10 In the absence of a conclusive definition, the following description of snoring was defined for this study: snoring is relatively loud breathing sounds (> 50 dB) during sleep.14,15
Figure 1. Block diagram of audio data handling and analysis.
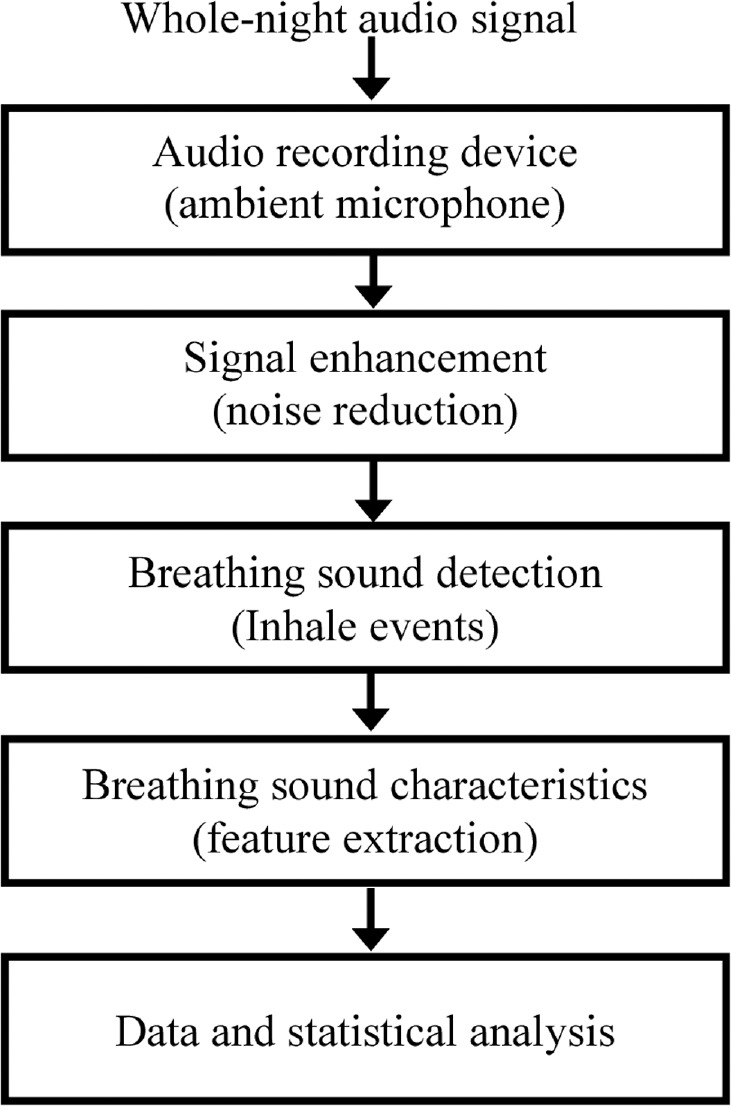
Whole-night audio signal, acoustic signals were recorded using a noncontact directional microphone connected to a digital audio recording device that was synchronized with polysomnography (PSG) recordings. Signal enhancement, following the completion of the PSG study, the audio signal was enhanced by a background noise reduction algorithm. Breathing sound detection, using audio signal processing and pattern recognition techniques, inhale sound events (> 20 dB) were distinguished from irrelevant noises, such as movements, linen noises, and speech. Breathing sound events were automatically located and segmented. Breathing sound characteristics, acoustic features such as sound intensity (dB), breathing sound duration (sec), breathing energy (dB × sec), and frequency centroid (Hz) were calculated for each inhale breathing sound event. Data and statistical analysis, breathing sound features were analyzed separately for women and men in the comparison and obstructive sleep apnea (OSA) groups.
Figure 2. An example of 15-sec interval of audio signal.
Left column illustrates loud snoring signal; right column illustrates very quiet breathing. (A) Raw audio signal; note that the quiet breathing (right panel) is hidden by the background noise (amplitude was magnified for this display). (B) The corresponding spectrogram (frequency components) of the raw audio signal in (A). (C) Same audio signals following background noise reduction and inhale breathing detection (in red); note that the very quiet breathing sounds were detected (right panel). (D) The corresponding spectrogram of the filtered audio signal in (C).
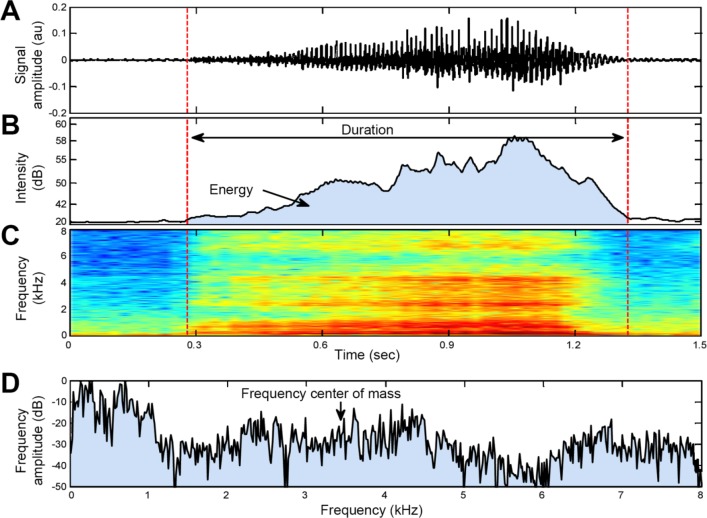
Using the detected breathing events, four acoustic features were developed and extracted per subject (Figure 3). These four features are calculated from the time and spectral domains for each inhale breathing sound event. The features are: (1) sound intensity (dB), (2) event duration (sec), (3) acoustic energy (dB × sec), and (4) frequency center of mass (frequency centroid, Hz). For further details about feature equations, see the online supplementary file in Dafna et al.10
Figure 3. Example of breathing features analyzed.
(A) Audio signal of one inhale breathing sound; (B) Sound intensity curve of the audio signal associated with breathing loudness as perceived by the human ear; (C) Spectrogram of the audio signal (kHz). Data are presented in a color map, hot colors represent high amplitudes; (D) Spectrum of the audio signal, calculated from the segmented audio signal (in A). The arrow indicates the frequency centroid (center of mass). Dashed vertical lines represent the automatic segmentation of the sound event and the duration feature. The energy (in B) is indicated by the area under the intensity curve.
Data and Statistical Analysis
Statistical analyses were performed using SPSS software (IBM, Armonk, New York, USA) for Windows (version 20). Continuous variables are presented as mean with standard deviation; comorbidities are presented as prevalence percentage. From the whole-night audio recordings, inhaled breathing sound features were extracted and sound features were analyzed for women and men in the two groups. The number of breathing and snoring sounds index was calculated per hour of sleep and separately for stage 2 (S2), stage 3 + stage 4 (slow wave sleep, SWS), and rapid eye movement sleep (REM). The percent of breaths leading to snoring (% snoring) was calculated for each sleep stage. The Mann-Whitney U test was used to determine the statistical significance of all the continuous variables, including patient characteristics, PSG features, and acoustic parameters of breathing sounds. Two-way analysis of variance (ANOVA-2) for repeated measures was used to examine the effect of sex and sleep time (hours) on breathing or snoring index (events/h) during sleep, using post hoc comparisons by Tukey test. Pearson correlation was used to examine the relationships between breathing or snoring sound features and patient characteristics such as age, AHI, and number of arousal (Ar) and awakening (Aw) events per hour of sleep (Ar + Aw index). For the correlation analysis, the values of breathing or snoring sound features were calculated as an average value for each subject, using the entire breathing sound event dataset, and the upper quarter and top 1% of most loud sound events dataset. In order to explore the noises that may be related to sleep fragmentation that are associated with OSA, Pearson correlation was used for the analysis of nonbreathing sounds (average intensity value of top 10% of noise events) and their relation to AHI. In order to avoid technician-induced noises in the study, the noise analysis was conducted between lights off and lights on. Data are presented as mean ± standard error of the mean unless indicated otherwise. The null hypothesis was rejected at the 5% level.
RESULTS
Subjects
The demographics and PSG findings of the subjects included in this study are shown in Table 1. Women with OSA are 10 y older than women without OSA (p < 0.05) and men with OSA have higher body mass index (BMI) compared to men without OSA (p < 0.05). All groups had similar total sleep time and sleep efficiency. However, as expected, both men and women with OSA had 250% more Ar + Aw index events compared to comparison groups (p < 0.01).
Table 1.
Subject characteristics.
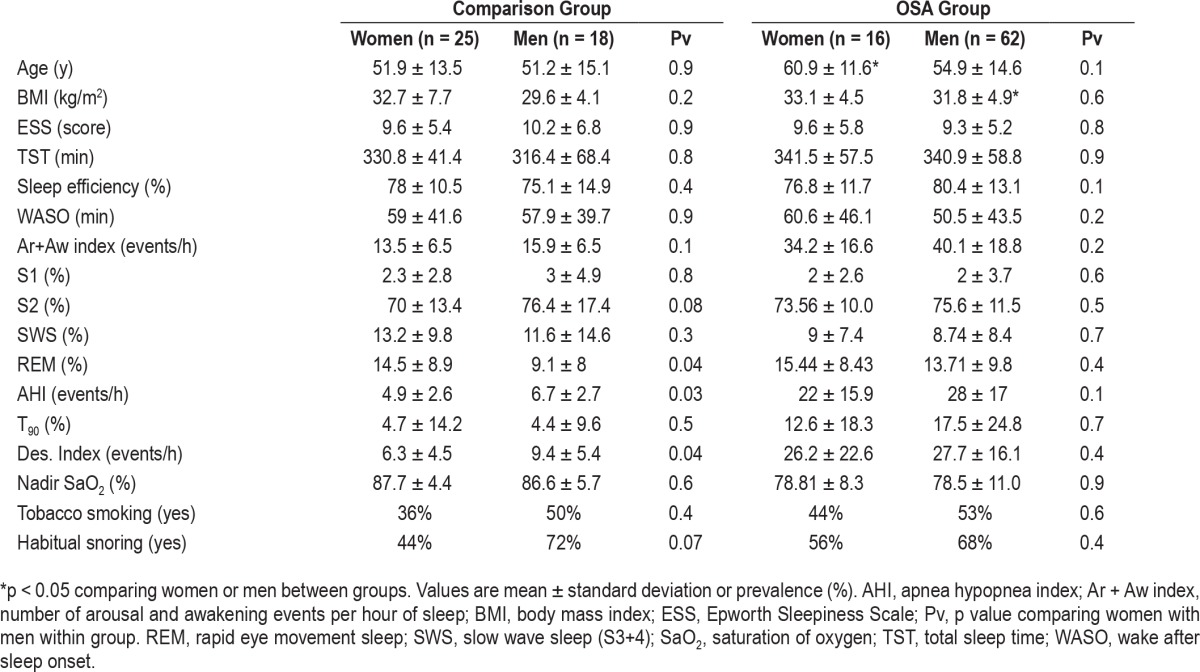
The whole night mean respiratory rate (calculated from inductance plethysmography) was 16.4 ± 2.5 (breaths/min) and no significant differences were found between sexes or groups. The AHI of women and men of the comparison group were 4.9 ± 2.6 (events/h) and 6.7 ± 2.7 (events/h), respectively, with no significant sex differences. Both women and men with OSA had significantly higher AHI relative to the comparison group (p < 0.01). Ar + Aw index positively correlated with AHI (r = 0.91, p < 0.001). Both sexes in the OSA group spent more time with oxygen saturation below 90% (p < 0.01), had higher desaturation index ≥ 4% (p < 0.01), and lower nadir saturation of oxygen (p < 0.01) relative to the comparison group. Both groups reported similar tobacco smoking and habitual snoring with no sex differences.
Acoustic Characteristics of Breathing Sounds
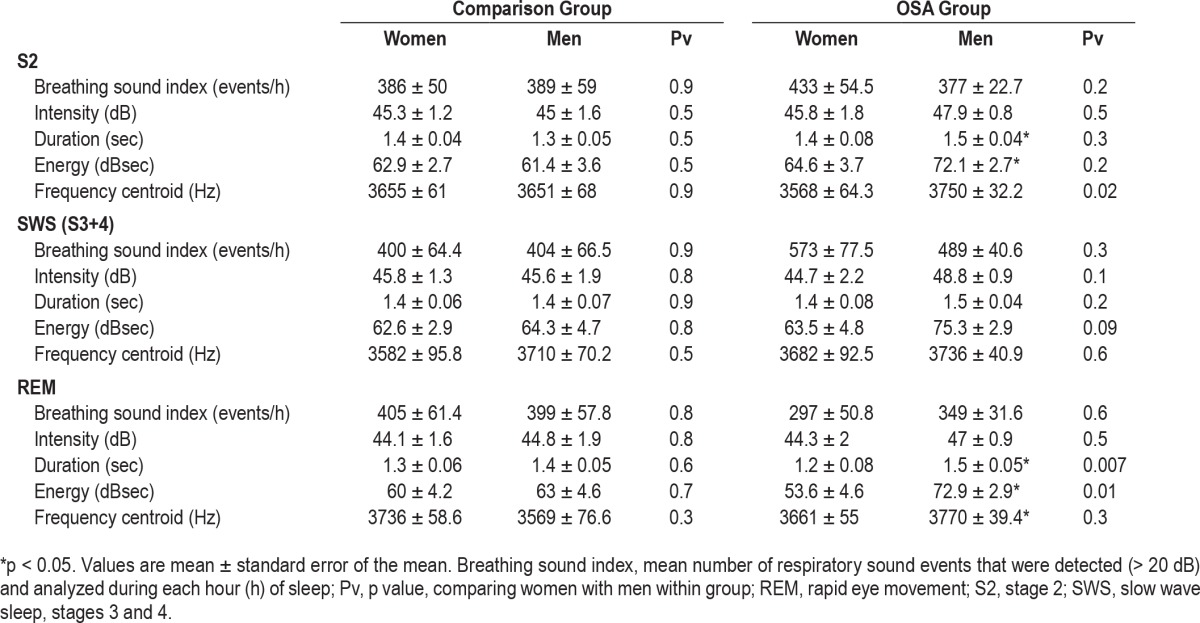
Detection of total breathing sound (intensity > 20 dB) events during sleep was statistically similar in both sexes regardless of OSA. The total number of detected breathing sound events during sleep for women in the comparison group and OSA group was 2,428 ± 340 (events) and 2, 744 ± 296 (events), respectively, and for men 2,278 ± 410 (events) and 2,476 ± 151 (events), respectively. In both sexes breathing sound index was higher in the second hour of the PSG study in comparison to the first hour (p = 0.04; Figure 4A). Breathing sound index did not change during the duration of the PSG study in both sexes (Figure 4A). Table 2 summarizes acoustic characteristics of the breathing sounds. No significant differences were found between comparison and OSA groups regarding mean breathing sound index and intensity in both sexes. Men with OSA have longer breathing duration (p < 0.05) and higher energy (p < 0.05) compared to men in the comparison group. The frequency centroid was higher in men with OSA compared to women with OSA (p < 0.05) during S2. During REM, men with OSA have longer breathing duration (p < 0.05) and higher energy (p < 0.05) than women with OSA. In the comparison group, no differences were found in breathing intensity (45 ± 1.1 versus 46.1 ± 2 dB, respectively, p = 0.6) between subjects with BMI < 30 and subjects with BMI ≥ 30.
Figure 4. Breathing and snoring index for each hour of sleep.
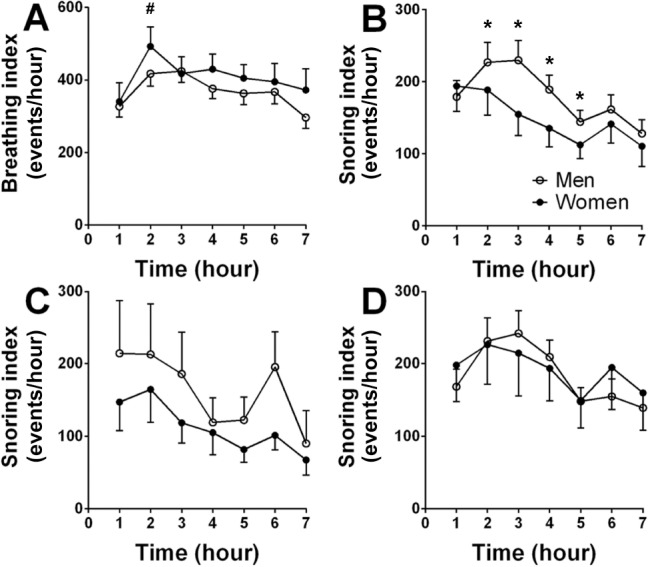
(A) Breathing sound (> 20 dB) index of all subjects. (B) Snoring (> 50 dB) index of all subjects. (C) Snoring index of the comparison group. (D) Snoring index of the OSA group. #significant change of breathing sound index between second and first hour of sleep in both sexes (p = 0.04); *significant sex differences (p = 0.01). Snoring index (B) significantly declined during sleep (p < 0.01). Significant differences were determined by two-way analysis of variance. Values are mean ± standard error of the mean
Table 2.
Analysis of breathing sounds during sleep.
Acoustic Characteristics of Snoring Sounds
The mean number of snoring events for women in the comparison group and OSA group was 594 ± 127 and 1,042 ± 265 (p = 0.14); for men in the comparison group and OSA group the mean number of snoring events was 902 ± 310 and 1,023 ± 143 (p = 0.4), respectively. Snoring index was higher in SWS (p < 0.03, ANOVA-2; Figure 5A) compared to S2 and REM; men have higher snoring index than women in all sleep stages (p < 0.05, ANOVA-2). When combining the groups (OSA and comparison group) and all sleep stages, the % snoring (relative to inductance plethysmography determined respiratory rate) in men and women was 17.4 ± 2.1% and 11.5 ± 2.0% (p < 0.05), respectively. Although the average % snoring was higher in OSA than in control groups (in S2 and SWS, Table 3) in both sexes, it did not reach statistical significance.
Figure 5. Snoring index and intensity for each sleep stage.
Snoring index (A) and intensity (B) for each sleep stage. *Significant difference between sexes (p = 0.05); #significant differences between slow wave sleep (SWS) and other sleep stages (p = 0.01). Significant differences were determined by two-way analysis of variance (ANOVA). Values are mean ± standard error of the mean. REM = rapid eye movement.
Table 3.
Analysis of snoring sounds (dB > 50) during sleep.
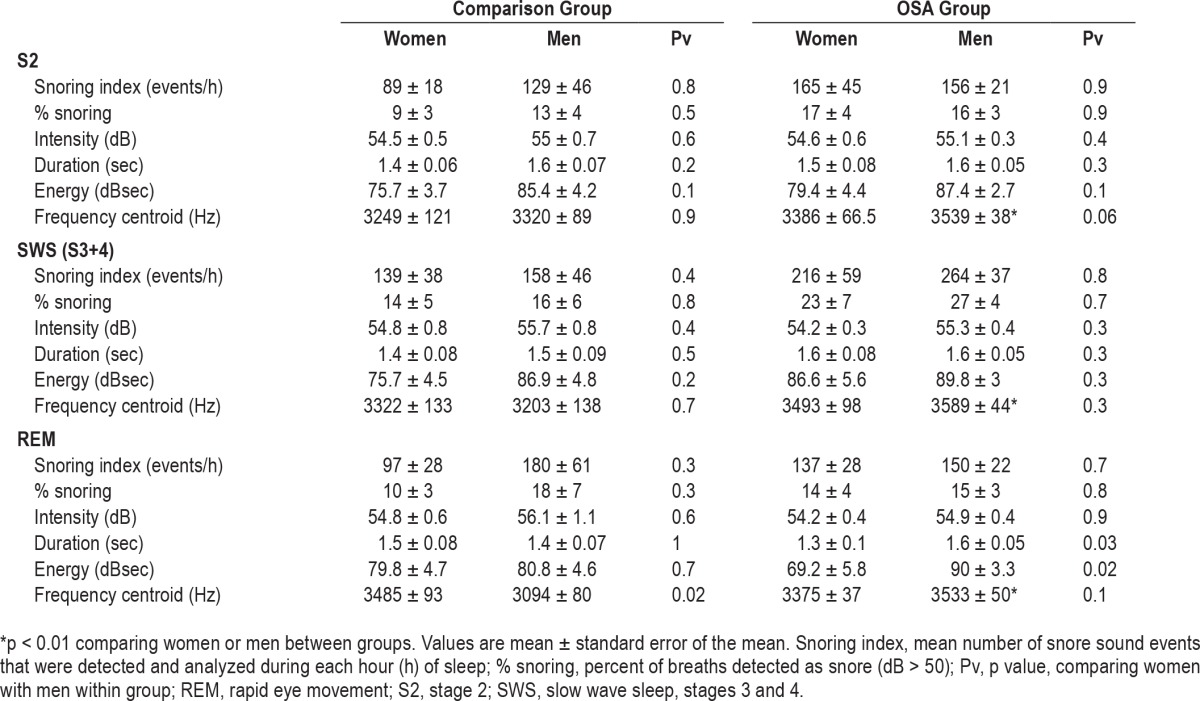
In both sexes % snoring was higher in SWS compared to stage S2 and REM (p < 0.01, Table 3). No significant difference in snoring intensity was found between sexes or sleep stages (Figure 5B). Table 3 summarizes mean snoring sound feature characteristics in sleep stages. No significant differences were found in snoring intensity, duration, and energy between groups in both sexes at all sleep stages.
In all sleep stages frequency centroid was elevated (p < 0.01) in men with OSA compared with men in the comparison group. During REM, men with OSA have longer breathing duration (p = 0.03) and higher energy (p = 0.02) compared to women with OSA. For all sleep stages, snoring index gradually declined across sleep (p < 0.01, ANOVA-2; Figure 4B); men had a significantly higher snoring index than women (p = 0.04, ANOVA-2) during the second through fifth hours of PSG study. Snoring in stages S2 and SWS showed a similar trend of declined snoring index over time (data not shown). During REM, men's snoring index tended to gradually increase during the last 4 h of PSG study. For women, no conclusive findings for snoring index pattern during REM were found (due to small sample size).
Figures 4C and 4D shows the snoring sound index for comparison and OSA groups, respectively. Women in the comparison group had a trend (p = 0.08, ANOVA-2) toward lower snoring index than men in the comparison group (Figure 4C); in the OSA group, both sexes had a similar snoring index across the night (Figure 4D). Women with OSA have higher snoring index (Figure 4D) than women in the comparison group (p = 0.002, ANOVA-2; Figure 4C). In the OSA group, no differences were found in breathing intensity (47.2 ± 1.4 versus 47.6 ± 1, dB respectively; p = 0.8) or snoring intensity (55.1 ± 0.9 versus 55 ± 1 dB, respectively; p = 0.6) between subjects with BMI < 30 and subjects with BMI ≥ 30.
Pearson correlations showed no association between AHI and mean breathing or mean snoring intensity (Figure 6A). In addition, no association was found between AHI and upper quarter (or top 1%) of snoring intensity (data not shown), duration (Figure 6B), or energy (Figure 6C). Frequency centroid of breathing and snoring sounds (Figure 6D) correlated with AHI; r = 0.28 (p < 0.001) and r = 0.4 (p < 0.01), respectively. Ar + Aw index positively correlated with noise events sound intensity (r = 0.26, p < 0.01). No correlation was found between breathing or snoring index and AHI: r = −0.009 (p = 0.923) and r = 0.04 (p = 0.7), respectively (Figure 5). Analyzing the noise events by calculating the intensity of the top 10% of non-breathing sounds from the whole-night audio signal, a positive correlation (r = 0.25, p < 0.0001) between the noise events and AHI was found.
Figure 6. Correlation between breathing or snoring features and apnea-hypopnea index (AHI).
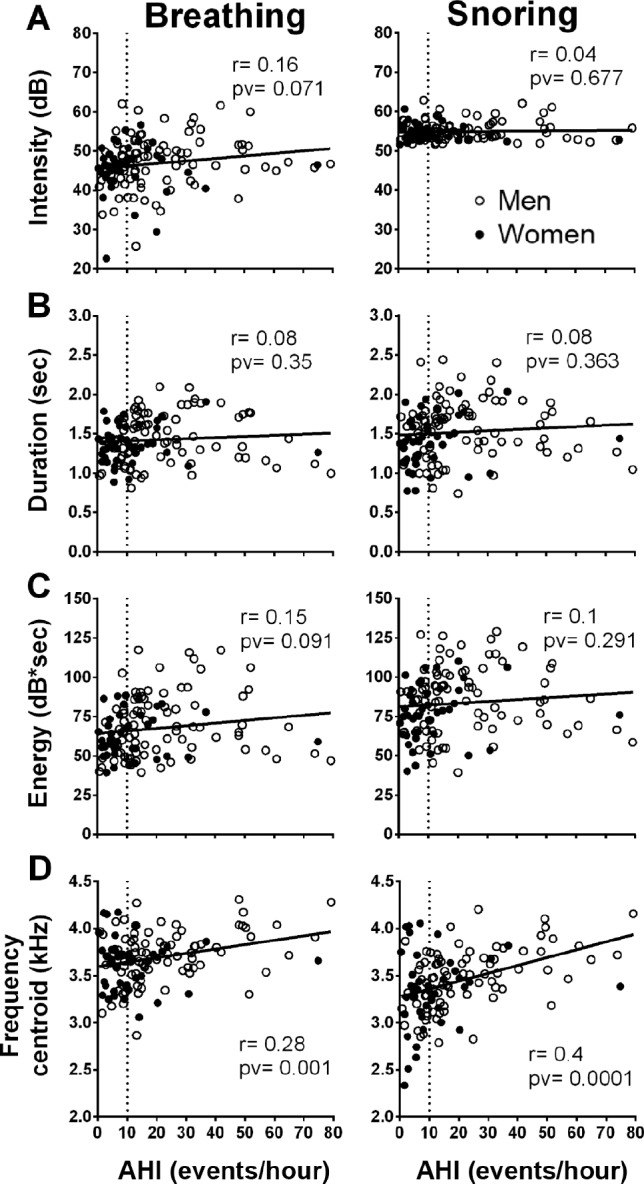
Left column represents breathing sound features and right column represents snoring sound features. (A) Intensity. (B) Duration. (C) Energy. (D) Frequency centroid. The feature values are calculated as the mean value for each individual and presented as one data point. Vertical dashed line indicates AHI = 10 (events/h).
DISCUSSION
This study used a novel and useful tool to objectively quantify a whole night's inhale breathing and snoring events. A large number of breathing events were detected and analyzed. Most studies have defined snores as acoustic events with sound intensity exceeding a certain amplitude value.8,9,13–17 Some studies have defined snoring as acoustic events that contain an oscillatory component8 and some have explored only a selected number of snores (usually loud events) and did not analyze the whole sleep.21 Because snoring appears to be a subjective impression,14 and there is no valid definition,35 we used the loud (intensity > 50 dB) breathing sounds for the definition of snoring.14,15 In the current study more than 97% of breathing sound events occurred during inspiration. This finding confirms early reports showing that snoring occurs mainly during inspiration, and that expiratory sound events are not common.9,10,21,25 During sleep, upper airway resistance increases,1–7 leading to amplification of air-pressure oscillations that are perceived as typical breathing sounds.10,25 These sounds can vary from quiet (< 40 dB) to very loud snoring in the same subject.10 We found that, on average, 45% of the respiratory events during sleep generated air pressure oscillations that could be detected and analyzed. Breaths “without a sound” (< 20 dB) indicate that no detectable air-pressure oscillation was present and these events were not analyzed. The need for an agreed-upon approach to extract and analyze whole-night snoring sounds is of major importance to the field of sleep disordered breathing. We used a novel robust snore detection algorithm10 that can capture and analyze breathing sounds > 20 dB.
Our approach includes comprehensive sets of features that were selected using the feature selection algorithm. This algorithm can also detect and analyze nonbreathing sounds (noises), and discriminate these sound events from breathing sounds. This unique approach is in contrast to earlier reports that use a sound level meter without an algorithm that can discriminate between relevant respiratory sounds and other noises.8,9,12–14,29,36–38 In both sexes, snoring index and % snoring was higher in SWS and men have a significantly higher snoring index and % snoring than women at all sleep stages. This finding is compatible with other reports, which described that snoring index was most prominent in SWS.8,13,36,37,39 However, our findings (Figure 5B) do not support earlier studies claiming that snoring intensity is higher in SWS.36,39
In our subjects AHI ranged from 0.3 to 80 (events/h) and mean individual breathing intensity ranged from 20 to 65 (dB); however, no correlation was found between mean (or upper quarter or top 1%) breathing or snoring intensity and AHI. Our finding is in contrast to earlier reports that found that snoring intensity positively correlated with AHI.15,28 Difference in results can be related to the possibility that in our study the subjects have less severe OSA than that reported by Maimon and Hanly,28 who included 1,643 patients with AHI range of 10 up to 140 and snoring intensity of 38 to 80 dB; Hunsaker and Riffenburgh15 included 4,860 patients with AHI range of 0 to 120 and snoring intensity of 50 to ∼90 dB. Bland and Altman40 established that correlation coefficient critically depends on the range of data: if this is wide, the correlation will be greater than if it is narrow. Moreover, most previous studies used the output of a sound level meter that captures all sounds in the testing room. Therefore, our data suggests that the association between snore intensity and OSA severity found in earlier reports15,28 could be related to noise events that are not related to snoring per se. As expected, our OSA patients have fragmented sleep that produces sounds associated with sleep fragmentation, such as bed movements, coughs, etc. Indeed, we found a positive correlation between noise intensity and AHI, and noise intensity and Ar +Aw index.
Because the spectral characteristics of snoring sounds are diverse, we chose to focus on analyzing the frequency (spectral) centroid, since it is a relatively simple generic scalar measure that reflects the center of mass of the spectrum. We found positive correlation between both breathing and snoring frequency centroid and AHI. This observation is reasonable, because higher values of frequency components are associated with narrower tubes41; indeed, OSA patients have a narrower upper airway. Our findings are supported by previous studies that explored spectral properties of snoring sounds.21 Perez Padilla et al.42 analyzed snoring sounds from a small sample of nonapneic heavy snorers and OSA patients. It was found that the ratio of power above 800 Hz to power below 800 Hz could be used to separate snorers from patients with OSA – the OSA snorers had higher frequencies. McCombe et al.43 demonstrated that the OSA group displayed a substantially larger high frequency sound component than the non-OSA group. In another study Herzog et al.44 found that patients with primary snoring revealed peak intensities between 100 and 300 Hz. OSA patients showed peak intensities above 1000 Hz; they confirmed the presence of a high frequency snoring sound pattern in OSA patients compared to simple snores.
We included subjects who represent a diverse population that is typical to our region, across a wide range of ages, BMI, AHI, but are not strictly a generalizable population. In our study, a large number of breathing and snoring events were analyzed from relatively small number of patients (n = 121). Further studies are needed to reinforce our findings on a larger sample of patients. We recognize that this study is based on a single PSG in each patient; further studies are required to determine individual night-to-night variability of breathing and snoring sound properties in laboratory and at-home settings. It is generally accepted that snoring and AHI are very dependent on the body position.39 Further studies are needed to explore the effect of body position on breathing and snoring sound characteristics. We used a noncontact microphone to record breathing and snoring sounds because this approach enables more natural sleep that is not affected by equipment. Some studies used a contact microphone that was taped to the nasion14 or to the trachea,20 or used a microphone embedded in a face mask.45 Using an audio-based approach, it is important to improve signal-to-noise ratio in order to capture the signals of interest (breathing and snoring sounds). To achieve this, we used an adaptive spectral subtraction technique that subtracted the estimated background noise,10,25 which has minimal distortion effect on sound intensity.46,47
Clinical Implications
The “flood” of subjects presenting with snoring symptoms is a major challenge to decision makers and is governed by prevalence and level of awareness of snoring morbidity.48 Reliable snoring reporting cannot be made based solely on a patient's (or partner's) history of noisy respiration during sleep,12,14,16 or sleep laboratory technician reports14; a large portion of the subjects respond that they “do not know” if they snore.49 The need for an agreed-upon approach to extract and analyze whole-night snoring sounds is of major importance to the field of sleep disordered breathing. Here, a novel and valid tool was used to systematically detect and analyze breathing and snoring sounds from a full night recording. This system can capture all the snoring sound events and, interestingly, on average the total number of snoring sounds that were captured by this system was less than 20% of the overall breathing sounds. This finding indicates that most breathing sound events are less than 50 dB. Snoring index and % snoring were higher in men, and in both genders snoring index and % snoring was higher in SWS. Snoring index, % snoring and snoring intensity did not correlate with AHI, however. Frequency centroid of breathing and snoring sounds correlate with AHI. Our data do not support the common belief that snoring intensity (dB) is higher for men than for women13,21 and is correlated with AHI.14,15,28 An important problem in dealing with objective respiratory sounds is the comparison of the data of various investigators and correct interpretation.50 This study shows that a snore detection system can provide an objective quantitative measure for whole-night snore patterns. Further studies are needed both to reinforce our findings by recruiting subjects from primary care clinics and by validating this screening tool in an at-home environment.
Summary
Snoring is measured as part of routine PSG; however, there is no consensus regarding the details of measurement, signal analysis, and data interpretation. Here, we used an objective valid breathing and snoring feature analysis and provided evidence that although snoring index is sex dependent, snoring intensity is similar across sexes and is not correlated with AHI.
DISCLOSURE STATEMENT
This was not an industry supported study. This research was supported by the Israel Science Foundation, grant No. 1403/15. The authors have indicated no financial conflicts of interest. All authors contributed equally to this work. This study was conducted in partial fulfillment of requirements for an MD degree for Asaf Levartovsky. The work for this study was performed at the Sleep-Wake Disorders Unit, Soroka University Medical Center, Department of Biomedical Engineering, Ben-Gurion University of the Negev. Israel.
ABBREVIATIONS
- AHI
apnea-hypopnea index
- Ar
arousal
- Aw
awakening
- BMI
body mass index
- dB
decibel
- ESS
Epworth Sleepiness Scale
- OSA
obstructive sleep apnea
- PSG
polysomnography
- SI
snoring index
REFERENCES
- 1.Colrain IM, Trinder J, Fraser G, Wilson GV. Ventilation during sleep onset. J Appl Physiol. 1987;63:2067–74. doi: 10.1152/jappl.1987.63.5.2067. [DOI] [PubMed] [Google Scholar]
- 2.Trinder J, Whitworth F, Kay A, Wilkin P. Respiratory instability during sleep onset. J Appl Physiol. 1992;73:2462–69. doi: 10.1152/jappl.1992.73.6.2462. [DOI] [PubMed] [Google Scholar]
- 3.Phillipson EA. Respiratory adaptations in sleep. Annu Rev Physiol. 1978;40:133–56. doi: 10.1146/annurev.ph.40.030178.001025. [DOI] [PubMed] [Google Scholar]
- 4.Orem J, Netick A, Dement WC. Breathing during sleep and wakefulness in the cat. Respir Physiol. 1977;30:265–89. doi: 10.1016/0034-5687(77)90035-4. [DOI] [PubMed] [Google Scholar]
- 5.White DP, Lombard RM, Cadieux RJ, Zwillich C. Pharyngeal resistance in normal humans: influence of gender, age, and obesity. J Appl Physiol. 1985;58:365–71. doi: 10.1152/jappl.1985.58.2.365. [DOI] [PubMed] [Google Scholar]
- 6.Pillar G, Malhotra A, Fogel R, et al. Airway mechanics and ventilation in response to resistive loading during sleep: influence of gender. Am J Respir Crit Care Med. 2000;162:1627–32. doi: 10.1164/ajrccm.162.5.2003131. [DOI] [PubMed] [Google Scholar]
- 7.Malhotra A, Huang Y, Fogel RB, et al. The male predisposition to pharyngeal collapse: importance of airway length. Am J Respir Crit Care Med. 2002;166:1388–95. doi: 10.1164/rccm.2112072. [DOI] [PubMed] [Google Scholar]
- 8.Perez-Padilla JR, West P, Kryger M. Snoring in normal young adults: prevalence in sleep stages and associated changes in oxygen saturation, heart rate, and breathing pattern. Sleep. 1987;10:249–53. doi: 10.1093/sleep/10.3.249. [DOI] [PubMed] [Google Scholar]
- 9.Guilleminault C, Stoohs R, Duncan S. Snoring (I). Daytime sleepiness in regular heavy snorers. Chest. 1991;99:40–8. doi: 10.1378/chest.99.1.40. [DOI] [PubMed] [Google Scholar]
- 10.Dafna E, Tarasiuk A, Zigel Y. Automatic detection of whole night snoring events using non-contact microphone. PloS One. 2013;8:e84139. doi: 10.1371/journal.pone.0084139. [DOI] [PMC free article] [PubMed] [Google Scholar]
- 11.Lugaresi E, Crigonotta F, Coccagna G, Piana C. Some epidemiological data on snoring and cardiocirculatory disturbances. Sleep. 1980;3:221–4. doi: 10.1093/sleep/3.3-4.221. [DOI] [PubMed] [Google Scholar]
- 12.Stoohs RA, Blum HC, Haselhorst M, et al. Normative data on snoring: a comparison between younger and older adults. Eur Respir J. 1998;11:451–7. doi: 10.1183/09031936.98.11020451. [DOI] [PubMed] [Google Scholar]
- 13.Wilson K, Stoohs RA, Mulrooney TF, et al. The snoring spectrum acoustic assessment of snoring sound intensity in 1,139 individuals undergoing polysomnography. Chest. 1999;115:762–70. doi: 10.1378/chest.115.3.762. [DOI] [PubMed] [Google Scholar]
- 14.Hoffstein V, Mateika S, Anderson D. Snoring: is it in the ear of the beholder? Sleep. 1994;17:522–6. doi: 10.1093/sleep/17.6.522. [DOI] [PubMed] [Google Scholar]
- 15.Hunsaker DH, Riffenburgh RH. Snoring significance in patients undergoing home sleep studies. Otolaryngol Head Neck Surg. 2006;134:756–60. doi: 10.1016/j.otohns.2006.01.017. [DOI] [PubMed] [Google Scholar]
- 16.Hoffstein V. Apnea and snoring: state of the art and future directions. Acta Otorhinolaryngol Belg. 2002;56:205–36. [PubMed] [Google Scholar]
- 17.Duckitt W, Tuomi S, Niesler T. Automatic detection, segmentation and assessment of snoring from ambient acoustic data. Physiol Meas. 2006;27:1047. doi: 10.1088/0967-3334/27/10/010. [DOI] [PubMed] [Google Scholar]
- 18.Cavusoglu M, Kamasak M, Erogul O, et al. An efficient method for snore/nonsnore classification of sleep sounds. Physiol Meas. 2007;28:841. doi: 10.1088/0967-3334/28/8/007. [DOI] [PubMed] [Google Scholar]
- 19.Karunajeewa AS, Abeyratne UR, Hukins C. Silence-breathing-snore classification from snore-related sounds. Physiol Meas. 2008;29:227. doi: 10.1088/0967-3334/29/2/006. [DOI] [PubMed] [Google Scholar]
- 20.Azarbarzin A, Moussavi Z. Snoring sounds variability as a signature of obstructive sleep apnea. Med Eng Phys. 2013;35:479–85. doi: 10.1016/j.medengphy.2012.06.013. [DOI] [PubMed] [Google Scholar]
- 21.Pevernagie D, Aarts RM, De Meyer M. The acoustics of snoring. Sleep Med Rev. 2010;14:131–44. doi: 10.1016/j.smrv.2009.06.002. [DOI] [PubMed] [Google Scholar]
- 22.Fiz JA, Abad J, Jané R, et al. Acoustic analysis of snoring sound in patients with simple snoring and obstructive sleep apnoea. Eur Respir J. 1996;9:2365–70. doi: 10.1183/09031936.96.09112365. [DOI] [PubMed] [Google Scholar]
- 23.Solà-Soler J, Fiz JA, Morera J, Jané R. Multiclass classification of subjects with sleep apnoea-hypopnoea syndrome through snoring analysis. Med Eng Phys. 2012;34:1213–20. doi: 10.1016/j.medengphy.2011.12.008. [DOI] [PubMed] [Google Scholar]
- 24.Ben-Israel N, Tarasiuk A, Zigel Y. Obstructive apnea hypopnea index estimation by analysis of nocturnal snoring signals in adults. Sleep. 2012;35:1299–305. doi: 10.5665/sleep.2092. [DOI] [PMC free article] [PubMed] [Google Scholar]
- 25.Dafna E, Tarasiuk A, Zigel Y. Sleep-wake evaluation from whole-night non-contact audio recordings of breathing sounds. PLoS One. 2015;10:e0117382. doi: 10.1371/journal.pone.0117382. [DOI] [PMC free article] [PubMed] [Google Scholar]
- 26.Dafna E, Tarasiuk A, Zigel Y. OSA severity assessment based on sleep breathing analysis using ambient microphone. Conf Proc IEEE Eng Med Biol Soc. 2013;2013:2044–7. doi: 10.1109/EMBC.2013.6609933. [DOI] [PubMed] [Google Scholar]
- 27.Rosenwein T, Dafna E, Tarasiuk A, Zigel Y. Detection of breathing sounds during sleep using non-contact audio recordings. Conf Proc IEEE Eng Med Biol Soc. 2014;2014:1489–92. doi: 10.1109/EMBC.2014.6943883. [DOI] [PubMed] [Google Scholar]
- 28.Maimon N, Hanly PJ. Does snoring intensity correlate with the severity of obstructive sleep apnea? J Clin Sleep Med. 2010;6:475–8. [PMC free article] [PubMed] [Google Scholar]
- 29.Metes A, Ohki M, Cole P, Haight JS, Hoffstein V. Snoring, apnea and nasal resistance in men and women. J Otolaryngol. 1991;20:57–61. [PubMed] [Google Scholar]
- 30.Kump K, Whalen C, Tishler PV, et al. Assessment of the validity and utility of a sleep-symptom questionnaire. Am J Respir Crit Care Med. 1994;150:735–41. doi: 10.1164/ajrccm.150.3.8087345. [DOI] [PubMed] [Google Scholar]
- 31.Tarasiuk A, Greenberg-Dotan S, Simon T, Tal A, Oksenberg A, Reuveni H. Low socioeconomic status is a risk factor for cardiovascular disease among adult obstructive sleep apnea syndrome patients requiring treatment. Chest. 2006;130:766–73. doi: 10.1378/chest.130.3.766. [DOI] [PubMed] [Google Scholar]
- 32.Simon-Tuval T, Reuveni H, Greenberg-Dotan S, et al. Low socioeconomic status is a risk factor for CPAP acceptance among adult OSAS patients requiring treatment. Sleep. 2009;32:545–52. doi: 10.1093/sleep/32.4.545. [DOI] [PMC free article] [PubMed] [Google Scholar]
- 33.Johns MW. A new method for measuring daytime sleepiness: the Epworth sleepiness scale. Sleep. 1991;14:540–54. doi: 10.1093/sleep/14.6.540. [DOI] [PubMed] [Google Scholar]
- 34.Iber C, Ancoli-Israel S, Chesson AL, Quan SF. Westchester, IL: American Academy of Sleep Medicine; 2007. The AASM manual for the scoring of sleep and associated events: rules, terminology, and technical specifications. [Google Scholar]
- 35.Rohrmeier C, Herzog M, Ettl T, Kuehnel TS. Distinguishing snoring sounds from breath sounds: a straightforward matter? Sleep Breath. 2014;18:169–76. doi: 10.1007/s11325-013-0866-8. [DOI] [PubMed] [Google Scholar]
- 36.Koutsourelakis I, Perraki E, Zakynthinos G, et al. Clinical and polysomnographic determinants of snoring. J Sleep Res. 2012;21:693–9. doi: 10.1111/j.1365-2869.2012.01018.x. [DOI] [PubMed] [Google Scholar]
- 37.Hoffstein V, Mateika JH, Mateika S. Snoring and sleep architecture. Am Rev Respir Dis. 1991;143:92–6. doi: 10.1164/ajrccm/143.1.92. [DOI] [PubMed] [Google Scholar]
- 38.Peng H, Xu H, Gao Z, Huang W, He Y. Acoustic analysis of overnight consecutive snoring sounds by sound pressure levels. Acta Otolaryngol. 2015;135:747–53. doi: 10.3109/00016489.2015.1027414. [DOI] [PubMed] [Google Scholar]
- 39.Nakano H, Ikeda T, Hayashi M, Ohshima E, Onizuka A. Effects of body position on snoring in apneic and nonapneic snorers. Sleep. 2003;26:169–72. doi: 10.1093/sleep/26.2.169. [DOI] [PubMed] [Google Scholar]
- 40.Bland JM, Altman DG. Statistical methods for assessing agreement between two methods of clinical measurement. Lancet. 1986;1:307–10. [PubMed] [Google Scholar]
- 41.Kinsler LE, Frey AR, Coppens AB, Sanders JV. Fundamentals of acoustics. 3rd ed. New York, NY: John Wiley & Sons; 1982. [Google Scholar]
- 42.Perez Padilla JR, Slawinski E, Difrancesco LM, et al. Characteristics of the snoring noise in patients with and without occlusive sleep apnea. Am Rev Respir Dis. 1993;147:635–44. doi: 10.1164/ajrccm/147.3.635. [DOI] [PubMed] [Google Scholar]
- 43.McCombe AW, Kwok V, Hawke WM. An acoustic screening test for obstructive sleep apnoea. Clin Otolaryngol. 1995;20:348–51. doi: 10.1111/j.1365-2273.1995.tb00057.x. [DOI] [PubMed] [Google Scholar]
- 44.Herzog M, Schmidt A, Bremert T, Herzog B, Hosemann W, Kaftan H. Analysed snoring sounds correlate to obstructive sleep disordered breathing. Eur Arch Otorhinolaryngol. 2008;265:105–13. doi: 10.1007/s00405-007-0408-8. [DOI] [PubMed] [Google Scholar]
- 45.Alshaer H, Levchenko A, Bradley TD, et al. A system for portable sleep apnea diagnosis using an embedded data capturing module. J Clin Monit Comput. 2013;27:303–11. doi: 10.1007/s10877-013-9435-8. [DOI] [PubMed] [Google Scholar]
- 46.Karunajeewa AS, Abeyratne UR, Hukins C. Silence-breathing-snore classification from snore-related 46 sounds. Physiol Meas. 2008;29:227–43. doi: 10.1088/0967-3334/29/2/006. [DOI] [PubMed] [Google Scholar]
- 47.Jané R, Fiz JA, Sola-Soler J, Mesquita J, Morera J. Snoring analysis for the screening of sleep apnea hypopnea syndrome with a single-channel device developed using polysomnographic and snoring databases. IEEE EMBC. 2011:8331–3. doi: 10.1109/IEMBS.2011.6092054. [DOI] [PubMed] [Google Scholar]
- 48.Reuveni H, Tarasiuk A, Wainstock T, Ziv A, Elhayany A, Tal A. Awareness level of obstructive sleep apnea syndrome during routine unstructured interviews of a standardized patient by primary care physicians. Sleep. 2004;27:1518–25. doi: 10.1093/sleep/27.8.1518. [DOI] [PubMed] [Google Scholar]
- 49.Sands M, Loucks EB, Lu B, et al. Self-reported snoring and risk of cardiovascular disease among postmenopausal women (from the Women's Health Initiative) Am J Cardiol. 2013;111:540–6. doi: 10.1016/j.amjcard.2012.10.039. [DOI] [PMC free article] [PubMed] [Google Scholar]
- 50.Dalmasso F, Prota R. Snoring: analysis, measurement, clinical implications and applications. Eur Respir J. 1996;9:146–59. doi: 10.1183/09031936.96.09010146. [DOI] [PubMed] [Google Scholar]


