

Abstract
Metapristone is the most predominant biological active metabolite of mifepristone, and being developed as a novel cancer metastasis chemopreventive agent by us. Despite its prominent metastasis chemopreventive effect, the underlying mechanism remains elusive. Our study, for the first time, demonstrated that metapristone had the ability to prevent breast cancer cells from migration, invasion, and interfere with their adhesion to endothelial cells. To explore the underlying mechanism of metapristone, we employed the iTRAQ technique to assess the effect of metapristone on MDA-MB-231 cells. In total, 5,145 proteins were identified, of which, 311 proteins showed significant differences in metapristone-treated cells compared to the control group (P-value < 0.05). Bioinformatic analysis showed many differentially expressed proteins (DEPs) functionally associated with post-translational modification, chaperones, translation, transcription, replication, signal transduction, etc. Importantly, many of the DEPs, such as E-cadherin, vimentin, TGF-β receptor I/II, smad2/3, β-catenin, caveolin, and dystroglycan were associated with TGF-β and Wnt signaling pathways, which were also linked to epithelial-to-mesenchymal transition (EMT) process. Further validation of the epithelial marker “E-caderin” and mesenchymal marker “vimetin” were carried out using immunoblot and immunofluorescence. These results have revealed a novel mechanism that metapristone-mediated metastasis chemoprevention is through intervening the EMT-related signaling pathways.
Breast cancer is the first leading cause of cancer mortality in women worldwide. Every year, above 1.3 million women are diagnosed with breast cancer and nearly 450,000 women die from it1. Metastasis, a process that cancer cells invade surrounding tissues and migrate to distal organs including lung, liver, brain, bone, and lymph nodes, is a major cause of mortality in breast cancer patients2. Therefore, development of safe and effective cancer metastasis chemopreventive agents is becoming important and badly needed. Metapristone, the most predominant biological active metabolite of mifepristone (RU486), is being developed as a novel cancer metastasis chemopreventive by us3,4.
Metapristone has received considerable attention to its anticancer activity recently. In our previous studies, we showed that metapristone produced comparable antitumor effect on several cancer cell lines. For example, metapristone induced HT-29 cells to be arrested at the G0/G1 stage, induced dose-dependent apoptosis, and interfered with adhesion of HT-29 cells to human umbilical vein endothelial cells (HUVECs) in vitro3,4,5.
Although the anticancer activity of metapristone has been exploited, its exact molecular mechanisms of actions and related pathways and targets towards cancer remain poorly understood. To get a more comprehensive understanding of metapristone functions on cancer, we employed the pharmacoproteomic analysis in the present study as we pioneered ten years ago6. Isobaric tags for relative and absolute quantitation (iTRAQ) technique is considered one of the most robust techniques for differential quantitative proteomic analysis7, which yields very small coefficients of variation in quantitative measurements8. Unlike gel-based proteomic method, iTRAQ exhibits much better sensitivity and allows the identification and accurate quantification of proteins from multiple samples9.
The epithelial–mesenchymal transition (EMT) is an important cellular process during which epithelial polarized cells become motile mesenchymal-appeared cells, which, in turn, promotes cancer cell invasion and metastasis10,11. The EMT process is very complex and controlled by various families of transcriptional regulators through different signaling pathways, including TGF-β, Wnt, MAPK, EGFR, PI3K and others12,13,14. Therefore, preventing cancer cells from epithelial-mesenchymal transition as well as intervening with the key proteins in EMT-related pathways is the main research objective for us to identify safe and effective cancer metastasis chemopreventives.
In the current study, we investigated the cancer metastasis chemopreventive effect of metapristone on the cell growth, migration, invasion and adhesion of MDA-MB-231 cells in vitro, and further explored the underlying molecular mechanism of metapristone by using an isobaric tag for relative and absolute quantitation iTRAQ combined with the tandem mass spectrometry (LC-ESI-MS/MS). We further identified differentially expressed proteins and potential signaling pathways in MDA-MB-231 cells after metapristone treatment. The findings reported in this study support our hypothesis and reveal, for the first time, a novel function for metapristone in the prevention of metastasis of breast cancer by intervening EMT-related signaling pathways.
Results
Effect of metapristone on cell viability
To explore the metastasis chempreventives function of metapristone, the cytostatic effect was examined first on human breast cancer cells MDA-MB-231 after treatment with various concentrations of metapristone for 24 h. As showed in Fig. 1A, the cytotoxicity of metapristone was low. The IC50 value for metapristone to suppress MDA-MB-231 cell proliferation is 91 μM.
Figure 1. Cellular pharmacology analysis of metapristone.

(A) in vitro activity of metapristone against MDA-MB-231 cell line. (B) dose-dependent inhibition by metapristone on cell migration. (C) inhibition by metapristone of MDA-MB-231 cells adhesion to HUVECs. Representative microscopic observation of the inhibition by metapristone at 0, 10, 50, and 75 μM. DMSO (0.1%) was used as vehicle control (average of 10 independent microscope fields for each of 3 independent experiments). (D) a Corning transwell system was used to assay cell invasion as described in methods. The amount of MDA-MB-231 cells invading through polycarbonate membranes was counted by microscopic observation (10×). Each experiment was carried out at least three times. **P < 0.01.
Metapristone inhibits cell migration, adhesion, and invasion
Would healing assay was conducted with MDA-MB-231 cells to examine the effect of metapristone on cell motility. As shown in Fig. 1B, cellular migration was controlled in a concentration-dependent manner by metapristone, being inhibited by up to 15%, 23% and 43% at 10, 50 and 75 μM, respectively (P < 0.01). Metapristone inhibited cell motility and wound closure at concentrations lower than its IC50, suggesting its specific inhibition on cell migration.
Tumor cells adhesion to the ECM is a fundamental step in cancer metastasis, the adherence of MDA-MB-231 cells to HUVECs was assessed to determine whether metapristone can regulate cell adhesion at a non-cytotoxic concentration. Ten fields of each well were randomly selected, and the adhered spots were counted. Compared with the control, the adhesion rate of MDA-MB-231 cells was 84, 68 and 39%, respectively, at 10, 50 and 75 μM of metapristone (Fig. 1C). Metapristone markedly and in a concentration-dependent manner inhibited the adherence of MDA-MB-231 cells to endothelial monolayers, indicating that it may fit into a new class of therapy for the reduction of risk factors of cancer metastasis.
It is well known that MDA-MB-231 cells have strong invasion properties in matrigel. In this study, we investigate the inhibitory effect of metapristone on cell invasion using a transwell system coated with matrigel. We found that treatment with metapristone for 24 h significantly inhibited MDA-MB-231 cells invasion through the transwell membrane. When metapristone was added at 10, 50 and 75 μM, the inhibitory effects were much more obvious compared to that of untreated group, with the inhibition rate of 48.52%, 60.06% and 82.88%, respectively (Fig. 1D).
Overview of quantitative proteomics
The iTRAQ analysis was performed on the purified protein extracts from MDA-MB-231 cells with or without metapristone treatment to understand the mechanism of metapristone-mediated anti-metastasis mechanism on the cellular and molecular level (Fig. 2). In total, 440,119 spectra were obtained from the iTRAQ-LC-MS/MS proteomic analysis. After data filtering to eliminate low-scoring spectra, a total of 93,114 unique spectra that met the strict confidence criteria for identification were matched to 5,145 unique proteins, of which, 311 proteins showed significant differences in metapristone-treated cells (P-value < 0.05). The detailed information including protein accession number, identified peptide number, protein score, sequence coverage, and regulation (fold change) for these identified proteins is shown in Table 1 and 2. Among these differentially expressed proteins (DEPs), 163 proteins were up-regulated (Table 1) and 148 proteins were down-regulated (Table 2). Then, GO analysis was conducted with the GSEABase package from R (http://www.r-project.org/) statistical platform15. Genes were classified in three major groups: the biological process, cellular component, and molecular function (Fig. 3A–C). Approximately 50.94% of the altered proteins were binding proteins, 27.52% were catalytic and 3.91% were enzyme regulators. In addition, we performed COG function prediction and classified these 311 positive proteins into 18 functional categories (Fig. 4).
Figure 2. Workflow used to study differential expressed proteins in MDA-MB-231 cells after metapristone treatment using iTRAQ technology.
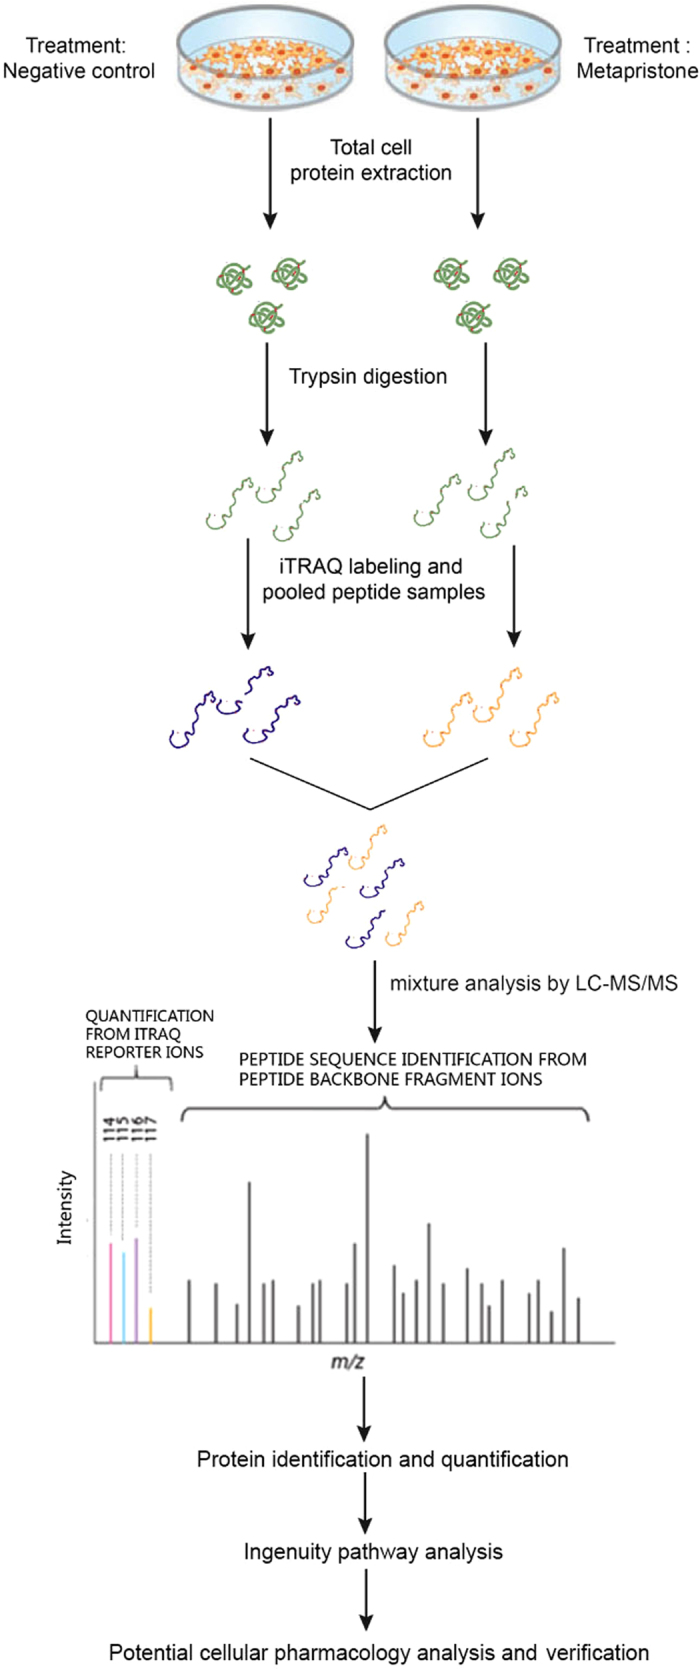
Table 1. Annotation of up-regulated proteins after metapristone treatment in MDA-MB-231 cells.
| No. | Score | % Cov | Accession number | Name | Peptides | regulation (fold change)a |
|---|---|---|---|---|---|---|
| 1 | 226 | 17.3 | D9HTE9 | Plasma membrane citrate carrier | 5 | 1.707* |
| 2 | 503 | 14.5 | P31040 | Succinate dehydrogenase [ubiquinone] flavoprotein subunit, mitochondrial | 8 | 3.644* |
| 3 | 308 | 39.9 | P62280 | 40S ribosomal protein S11 | 7 | 1.709* |
| 4 | 115 | 19.2 | Q0QEY7 | Succinate dehydrogenase complex subunit B | 4 | 3.776* |
| 5 | 474 | 27.8 | P13073 | Cytochrome c oxidase subunit 4 isoform 1, mitochondrial | 5 | 1.671* |
| 6 | 267 | 30 | Q53EW8 | Thiosulfate sulfurtransferase variant | 7 | 3.181* |
| 7 | 488 | 30.3 | E9PH29 | Thioredoxin-dependent peroxide reductase, mitochondrial | 6 | 1.538* |
| 8 | 446 | 20.7 | A2A274 | Aconitate hydratase, mitochondrial | 13 | 1.528* |
| 9 | 266 | 24.1 | Q5QNZ2 | ATP synthase F(0) complex subunit B1, mitochondrial | 5 | 1.681* |
| 10 | 388 | 26.7 | Q59FZ8 | Nebulette non-muscle isoform variant | 9 | 1.591* |
| 11 | 302 | 14.5 | A6NN80 | Annexin | 10 | 2.861* |
| 12 | 410 | 50.3 | O75947 | ATP synthase subunit d, mitochondrial | 7 | 3.498* |
| 13 | 1130 | 34.2 | Q59GB4 | Dihydropyrimidinase-like 2 variant | 15 | 1.781* |
| 14 | 947 | 30.7 | Q06210-2 | Isoform 2 of Glutamine—fructose-6-phosphate aminotransferase [isomerizing] 1 | 16 | 4.479** |
| 15 | 212 | 16.1 | G3V325 | Pentatricopeptide repeat-containing protein 1, mitochondrial | 4 | 2.441* |
| 16 | 2168 | 59.3 | P00338 | L-lactate dehydrogenase A chain | 17 | 2.417* |
| 17 | 135 | 15.3 | B7Z792 | cDNA FLJ53932 | 5 | 1.713* |
| 18 | 518 | 16.9 | D3DUJ0 | AFG3 ATPase family gene 3-like 2, isoform CRA_a | 11 | 1.981* |
| 19 | 388 | 63.2 | E9PN17 | ATP synthase subunit g, mitochondrial | 4 | 1.709* |
| 20 | 202 | 25.1 | Q5HYK3 | 2-methoxy-6-polyprenyl-1,4-benzoquinol methylase, mitochondrial | 4 | 2.408* |
| 21 | 671 | 45.4 | P15559-2 | Isoform 2 of NAD(P)H dehydrogenase [quinone] 1 | 9 | 3.405* |
| 22 | 146 | 17.5 | Q8N4T8 | Carbonyl reductase family member 4 | 4 | 5.404** |
| 23 | 474 | 29.8 | P62277 | 40S ribosomal protein S13 | 5 | 2.403* |
| 24 | 189 | 23.7 | B2RDE0 | cDNA, FLJ96567 | 8 | 6.402** |
| 25 | 1329 | 48.2 | Q53FB6 | Mitochondrial aldehyde dehydrogenase 2 variant | 19 | 5.389** |
| 26 | 530 | 26.7 | Q53FC3 | Programmed cell death 6 variant | 5 | 2.312* |
| 27 | 161 | 20.9 | Q9UK22 | F-box only protein 2 | 5 | 1.975* |
| 28 | 148 | 22.6 | P18827 | Syndecan-1 | 5 | 4.562* |
| 29 | 458 | 35.2 | Q5T9B7 | Adenylate kinase isoenzyme 1 | 6 | 2.334* |
| 30 | 237 | 17.5 | B3KMV8 | cDNA FLJ12766 fis, clone NT2RP2001520 | 6 | 3.366* |
| 31 | 252 | 28.7 | I3L1P8 | Mitochondrial 2-oxoglutarate/malate carrier protein (Fragment) | 6 | 2.364* |
| 32 | 167 | 52.2 | P56385 | ATP synthase subunit e, mitochondrial | 4 | 4.361* |
| 33 | 216 | 24.1 | B3KTJ1 | cDNA FLJ38349 fis, clone FEBRA1000057 | 6 | 5.353* |
| 34 | 259 | 22.4 | Q5M7Z1 | RAD23 homolog A (S. cerevisiae) | 4 | 3.351* |
| 35 | 177 | 30.2 | Q9H479 | Fructosamine-3-kinase | 4 | 2.342* |
| 36 | 160 | 19.5 | B4DNW0 | Aminoacylase-1 | 9 | 2.921* |
| 37 | 775 | 23 | O60832 | H/ACA ribonucleoprotein complex subunit | 10 | 3.339** |
| 38 | 104 | 36.5 | Q9NRV9 | Heme-binding protein 1 | 5 | 1.759* |
| 39 | 194 | 43.4 | P35754 | Glutaredoxin-1 | 4 | 4.368* |
| 40 | 362 | 22 | Q96I99 | Succinyl-CoA ligase [GDP-forming] subunit beta, mitochondrial | 9 | 1.837* |
| 41 | 156 | 24.6 | F5GZW3 | Rho GTPase-activating protein 4 | 4 | 1.536* |
| 42 | 144 | 33.8 | A8KA74 | cDNA FLJ76065 | 4 | 1.625* |
| 43 | 434 | 24.4 | B4E2Z8 | cDNA FLJ61206 | 8 | 1.734* |
| 44 | 904 | 37 | P11177-2 | Isoform 2 of Pyruvate dehydrogenase E1 component subunit beta, mitochondrial | 10 | 2.333* |
| 45 | 699 | 31.6 | P00966 | Argininosuccinate synthase | 13 | 2.302* |
| 46 | 109 | 22.6 | Q5SRD1 | Putative mitochondrial import inner membrane translocase subunit Tim23B | 4 | 2.133* |
| 47 | 969 | 25.4 | Q9NSE4 | Isoleucine—tRNA ligase, mitochondrial | 22 | 6.329** |
| 48 | 254 | 15 | Q8N0 × 4 | Citrate lyase subunit beta-like protein, mitochondrial | 4 | 3.327* |
| 49 | 222 | 15.2 | Q14376 | UDP-glucose 4-epimerase | 4 | 7.325** |
| 50 | 225 | 36.7 | Q86WA8 | Lon protease homolog 2, peroxisomal | 4 | 5.324* |
| 51 | 128 | 42.1 | P43155-2 | Isoform 2 of Carnitine O-acetyltransferase | 5 | 1.724* |
| 52 | 414 | 19.6 | D7PBN3 | ESRP1/RAF1 fusion protein | 13 | 2.324* |
| 53 | 2112 | 50.5 | Q59EI9 | ADP,ATP carrier protein, liver isoform T2 variant | 16 | 7.32** |
| 54 | 381 | 29.3 | D3XNU5 | E-cadherin 1 | 6 | 7.319** |
| 55 | 398 | 22.8 | D3DVA5 | Rho/rac guanine nucleotide exchange factor (GEF) 2, isoform CRA_a | 12 | 1.619* |
| 56 | 346 | 20.8 | B4E290 | cDNA FLJ50039 | 10 | 8.318** |
| 57 | 1299 | 50.5 | P12429 | Annexin A3 | 15 | 2.322* |
| 58 | 379 | 22.4 | B7Z3K9 | Fructose-bisphosphate aldolase | 8 | 2.315* |
| 59 | 151 | 19.9 | Q9H974-2 | Isoform 2 of Queuine tRNA-ribosyltransferase subunit QTRTD1 | 4 | 1.751* |
| 60 | 556 | 23 | B4DFP1 | cDNA FLJ51818 | 12 | 1.815* |
| 61 | 679 | 45 | P84085 | ADP-ribosylation factor 5 | 8 | 1.663* |
| 62 | 317 | 18.8 | P80303-2 | Isoform 2 of Nucleobindin-2 | 7 | 2.306* |
| 63 | 402 | 16.5 | Q8NE62 | Choline dehydrogenase, mitochondrial | 9 | 1.996* |
| 64 | 1016 | 32.6 | Q13011 | Delta(3, 5)-Delta(2, 4)-dienoyl-CoA isomerase, mitochondrial | 10 | 1.703* |
| 65 | 149 | 36.8 | Q7Z4G4-2 | Isoform 2 of tRNA (guanine(10)-N2)-methyltransferase homolog | 5 | 2.302* |
| 66 | 227 | 21.2 | B4DG80 | LIM and cysteine-rich domains protein 1 | 5 | 3.271* |
| 67 | 122 | 26.3 | O00178 | GTP-binding protein 1 | 4 | 2.111* |
| 68 | 196 | 24.8 | H3BNX8 | Cytochrome c oxidase subunit 5A, mitochondrial | 5 | 3.022* |
| 69 | 264 | 31.6 | O95865 | N(G), N(G)-dimethylarginine dimethylaminohydrolase 2 | 7 | 2.395* |
| 70 | 286 | 41.8 | P36969-2 | Isoform Cytoplasmic of Phospholipid hydroperoxide glutathione peroxidase, mitochondrial | 7 | 1.795* |
| 71 | 238 | 21.9 | B3KTM6 | Ribosomal protein L5, isoform CRA_b | 5 | 1.694* |
| 72 | 891 | 48.9 | P18085 | ADP-ribosylation factor 4 | 8 | 1.742* |
| 73 | 105 | 18 | Q96CF2 | Charged multivesicular body protein 4c | 4 | 1.562* |
| 74 | 714 | 20.5 | Q6XQN6-3 | Isoform 3 of Nicotinate phosphoribosyltransferase | 4 | 2.291* |
| 75 | 419 | 72.1 | Q9HCY8 | Protein S100-A14 | 6 | 1.287* |
| 76 | 416 | 22.7 | Q8IYS1 | Peptidase M20 domain-containing protein 2 | 9 | 2.286* |
| 77 | 1692 | 35.4 | Q59EK6 | TNF receptor-associated protein 1 variant | 21 | 1.986* |
| 78 | 192 | 16.7 | B3KQQ0 | cDNA PSEC0007 fis, clone NT2RM1000634 | 8 | 1.784* |
| 79 | 322 | 27.7 | B4DP80 | cDNA FLJ56357 | 6 | 2.283* |
| 80 | 270 | 14.4 | B4DUF1 | cDNA FLJ59760 | 8 | 2.252* |
| 81 | 519 | 28.8 | P31930 | Cytochrome b-c1 complex subunit 1, mitochondrial | 10 | 3.281* |
| 82 | 278 | 33.5 | B7Z4B7 | cDNA FLJ52561 | 7 | 2.218* |
| 83 | 1591 | 37.3 | K7EKE6 | Lon protease homolog, mitochondrial | 25 | 3.278* |
| 84 | 345 | 25 | P04040 | Catalase | 11 | 3.215* |
| 85 | 1420 | 58.6 | P30044-2 | Isoform Cytoplasmic + peroxisomal of Peroxiredoxin-5, mitochondrial | 7 | 2.275* |
| 86 | 571 | 44.9 | B4DNR3 | cDNA FLJ52710 | 6 | 8.214** |
| 87 | 213 | 46.8 | B4DRT2 | 28S ribosomal protein S27, mitochondrial | 4 | 7.212** |
| 88 | 412 | 24.4 | Q6NVY1 | 3-hydroxyisobutyryl-CoA hydrolase, mitochondrial | 9 | 6.274** |
| 89 | 636 | 47 | M0R0F0 | 40S ribosomal protein S5 (Fragment) | 10 | 11.271** |
| 90 | 254 | 45.4 | P61081 | NEDD8-conjugating enzyme Ubc12 | 8 | 6.269** |
| 91 | 524 | 23.1 | P17858 | 6-phosphofructokinase, liver type | 14 | 7.368** |
| 92 | 146 | 11.2 | Q53H22 | Amidophosphoribosyltransferase | 5 | 2.068* |
| 93 | 152 | 19.1 | P46781 | 40S ribosomal protein S9 | 4 | 1.968* |
| 94 | 227 | 25.6 | Q9NWV4 | UPF0587 protein C1orf123 | 5 | 1.266* |
| 95 | 159 | 19.4 | B3KRI2 | NADH dehydrogenase [ubiquinone] iron-sulfur protein 7, mitochondrial | 4 | 3.214* |
| 96 | 646 | 21.6 | B2R9S4 | cDNA, FLJ94534 | 6 | 1.963* |
| 97 | 296 | 18.4 | B2R6S5 | Cytidylate kinase, isoform CRA_a | 4 | 10.262** |
| 98 | 576 | 16.1 | Q9UJS0-2 | Isoform 2 of Calcium-binding mitochondrial carrier protein Aralar2 | 8 | 8.261** |
| 99 | 269 | 39.5 | O75368 | SH3 domain-binding glutamic acid-rich-like protein | 4 | 7.259** |
| 100 | 522 | 45.2 | O75223 | Gamma-glutamylcyclotransferase | 8 | 6.229* |
| 101 | 168 | 24.7 | B2R9 × 3 | cDNA, FLJ94599 | 10 | 5.257* |
| 102 | 2592 | 45.5 | Q6NVC0 | SLC25A5 protein (Fragment) OS = Homo sapiens | 16 | 3.255* |
| 103 | 319 | 22.5 | Q9BQ69 | O-acetyl-ADP-ribose deacetylase MACROD1 | 6 | 3.154* |
| 104 | 179 | 14.8 | Q6V9R7 | Solute carrier family 25 member 19 | 4 | 1.752* |
| 105 | 108 | 23.6 | Q8IW45 | ATP-dependent (S)-NAD(P)H-hydrate dehydratase | 5 | 1.922* |
| 106 | 878 | 32.4 | P35908 | Keratin, type II cytoskeletal 2 epidermal | 18 | 3.251* |
| 107 | 953 | 37.6 | P49419-2 | Isoform 2 of Alpha-aminoadipic semialdehyde dehydrogenase | 16 | 5.338** |
| 108 | 751 | 30.1 | P07384 | Calpain-1 catalytic subunit | 19 | 7.247* |
| 109 | 564 | 62 | O95336 | 6-phosphogluconolactonase | 11 | 11.246** |
| 110 | 176 | 14.1 | Q9H9T3-2 | Isoform 2 of Elongator complex protein 3 | 6 | 5.245* |
| 111 | 2382 | 35.4 | Q53F91 | Villin 1 variant | 27 | 3.245** |
| 112 | 247 | 31.4 | B4DP27 | cDNA FLJ52153 | 5 | 2.242* |
| 113 | 365 | 25.9 | Q9NUQ9 | Protein FAM49B | 7 | 3.551* |
| 114 | 268 | 35.6 | E7EW20 | Unconventional myosin-VI | 9 | 7.241** |
| 115 | 4889 | 43.5 | B7Z2 × 9 | Gamma-enolase | 13 | 5.244* |
| 116 | 494 | 15.2 | P10253 | Lysosomal alpha-glucosidase | 10 | 3.379* |
| 117 | 167 | 20.2 | P15328 | Folate receptor alphas | 4 | 2.238* |
| 118 | 166 | 28.4 | Q13315 | Serine-protein kinase ATM | 6 | 5.238* |
| 119 | 232 | 20.2 | B3KM98 | cDNA FLJ10556 fis, clone NT2RP2002479 | 6 | 6.238* |
| 120 | 267 | 29.7 | Q02338 | D-beta-hydroxybutyrate dehydrogenase, mitochondrial | 7 | 4.235* |
| 121 | 673 | 44.2 | B7Z6B8 | 2,4-dienoyl-CoA reductase, mitochondrial | 11 | 9.215** |
| 122 | 114 | 20.9 | B4DQ51 | Short/branched chain-specific acyl-CoA dehydrogenase, mitochondrial | 4 | 8.234** |
| 123 | 2746 | 43.8 | P40939 | Trifunctional enzyme subunit alpha, mitochondrial | 31 | 7.212** |
| 124 | 437 | 28.9 | P31937 | 3-hydroxyisobutyrate dehydrogenase, mitochondrial | 6 | 5.212* |
| 125 | 214 | 33.5 | B3KTS4 | cDNA FLJ38665 fis, clone HLUNG2003378 | 8 | 4.222* |
| 126 | 3670 | 56.3 | P06899 | Histone H2B type 1-J | 8 | 10.231** |
| 127 | 5762 | 59.3 | Q13885 | Tubulin beta-2A chain | 21 | 1.831* |
| 128 | 647 | 27.9 | B2RAH7 | cDNA, FLJ94921 | 16 | 1.529* |
| 129 | 443 | 17.5 | O95202 | LETM1 and EF-hand domain-containing protein 1, mitochondrial | 11 | 2.229* |
| 130 | 766 | 24.7 | Q0VGA5 | SARS protein s | 10 | 1.729* |
| 131 | 407 | 33.7 | Q9Y305-2 | Isoform 2 of Acyl-coenzyme A thioesterase 9, mitochondrial | 12 | 1.855* |
| 132 | 317 | 35.1 | P63000-2 | Isoform B of Ras-related C3 botulinum toxin substrate 1 | 7 | 2.277* |
| 133 | 103 | 21.5 | Q9C0C9 | Ubiquitin-conjugating enzyme E2 O | 5 | 6.217** |
| 134 | 114 | 14.1 | P04792 | Heat shock protein beta-1 | 4 | 5.246* |
| 135 | 248 | 15.7 | Q9UBF2 | Coatomer subunit gamma-2 | 4 | 6.213* |
| 136 | 356 | 63.9 | P07741 | Adenine phosphoribosyltransferase | 8 | 7.273** |
| 137 | 260 | 14.7 | Q8TE67-2 | Isoform 2 of Epidermal growth factor receptor kinase substrate 8-like protein 3 | 8 | 2.222* |
| 138 | 2952 | 49 | P09211 | Glutathione S-transferase P | 9 | 1.825* |
| 139 | 343 | 43.8 | Q8TCD5 | 5~(3~)-deoxyribonucleotidase, cytosolic type | 6 | 2.261* |
| 140 | 234 | 26.9 | Q8NCF7 | cDNA FLJ90278 fis, clone NT2RP1000325 | 10 | 2.254* |
| 141 | 739 | 45.2 | P14550 | Alcohol dehydrogenase [NADP(+)] | 13 | 1.722* |
| 142 | 138 | 19 | B2RCC2 | cDNA, FLJ95978 | 5 | 1.998* |
| 143 | 235 | 16.4 | Q9BRQ8 | Apoptosis-inducing factor 2 | 6 | 9.217** |
| 144 | 267 | 39 | P30046 | D-dopachrome decarboxylase | 4 | 3.217* |
| 145 | 144 | 16.4 | B4DRN7 | C2 domain-containing protein 5 | 5 | 8.216** |
| 146 | 1762 | 51.4 | Q6LES2 | Annexin (Fragment) | 15 | 8.113** |
| 147 | 383 | 21.8 | Q5JNW7 | Proteasome subunit beta type-8 | 4 | 12.212** |
| 148 | 126 | 20.9 | Q96GD0 | Pyridoxal phosphate phosphatase | 4 | 7.202* |
| 149 | 516 | 45.7 | Q9NQR4 | Omega-amidase NIT2 | 11 | 7.254** |
| 150 | 278 | 16.6 | B3KM97 | cDNA FLJ10554 fis, clone NT2RP2002385 | 5 | 1.911* |
| 151 | 427 | 25.1 | J3QQX3 | NADPH:adrenodoxin oxidoreductase, mitochondrial | 8 | 1.721* |
| 152 | 184 | 19.1 | P47929 | Galectin-7 | 4 | 7.209** |
| 153 | 125 | 22.9 | Q6PJ77 | BTF3L4 protein (Fragment) | 4 | 6.209** |
| 154 | 228 | 17.3 | R4GMU1 | GDH/6PGL endoplasmic bifunctional protein | 9 | 5.248** |
| 155 | 326 | 32.7 | B2R7T6 | cDNA, FLJ93596 | 12 | 7.217** |
| 156 | 175 | 21.2 | Q9BUL8 | Programmed cell death protein 10 | 5 | 3.252* |
| 157 | 264 | 19.6 | B2R673 | cDNA, FLJ92818 | 9 | 1.884* |
| 158 | 341 | 34.1 | G8JLB3 | tRNA pseudouridine synthase (Fragment) | 11 | 1.653* |
| 159 | 1093 | 26 | F8W930 | Insulin-like growth factor 2 mRNA-binding protein 2 | 13 | 8.224** |
| 160 | 169 | 16 | Q15031 | Probable leucine—tRNA ligase, mitochondrial | 5 | 5.263* |
| 161 | 2146 | 44.7 | O43175 | D-3-phosphoglycerate dehydrogenase | 20 | 5.211* |
| 162 | 516 | 22.2 | B4E0B1 | cDNA FLJ52100 | 4 | 3.202* |
| 163 | 151 | 20.3 | B4DKL4 | Lipolysis-stimulated lipoprotein receptor | 6 | 2.328* |
aRegulations (fold-changes) of differentially expressed proteins in MDA-MB-231 cells (metapristone-treatment versus control). *P < 0.05; **P < 0.01.
Table 2. Annotation of down-regulated proteins after metapristone treatment in MDA-MB-231 cells.
| No. | Score | % Cov | Accession number | Name | Peptides | regulation (fold change)a |
|---|---|---|---|---|---|---|
| 1 | 701 | 35.3 | A8K9B9 | cDNA FLJ77391 | 17 | 0.331* |
| 2 | 286 | 31.4 | B3KQF5 | cDNA FLJ90381 fis, clone NT2RP2005035 | 8 | 0.511* |
| 3 | 451 | 20.1 | Q9H089 | Large subunit GTPase 1 homolog | 11 | 0.621* |
| 4 | 167 | 22.4 | A7UJ17 | DnaJ | 4 | 0.431* |
| 5 | 178 | 18.3 | Q53HF3 | Galactosidase, alpha variant | 4 | 0.383* |
| 6 | 165 | 14.7 | Q9BTM9-2 | Isoform 2 of Ubiquitin-related modifier 1 | 4 | 0.501* |
| 7 | 263 | 22.7 | Q8NAF0 | Zinc finger protein 579 | 4 | 0.528* |
| 8 | 221 | 18.1 | Q9BPX3 | Condensin complex subunit 3 | 10 | 0.438* |
| 9 | 122 | 21.3 | J3QTQ0 | Dystonin | 8 | 0.607* |
| 10 | 175 | 16.2 | B4DQM4 | GPN-loop GTPase 1 | 4 | 0.527* |
| 11 | 437 | 27 | J3KQA0 | Synaptotagmin I, isoform CRA_b | 10 | 0.694* |
| 12 | 119 | 15.4 | B2R728 | cDNA, FLJ9325 | 4 | 0.603* |
| 13 | 133 | 23.1 | Q13308-2 | Isoform 2 of Inactive tyrosine-protein kinase 7 | 6 | 0.324** |
| 14 | 2854 | 46 | A8K2 × 8 | cDNA FLJ78433 | 25 | 0.523* |
| 15 | 226 | 12.8 | Q9ULX6 | A-kinase anchor protein 8-like | 6 | 0.612* |
| 16 | 704 | 30.3 | Q6FHK7 | PSME3 protein | 7 | 0.521* |
| 17 | 479 | 25.4 | A8K878 | cDNA FLJ77177 | 4 | 0.282** |
| 18 | 612 | 36 | P84022 | Smad3 | 5 | 0.233** |
| 19 | 532 | 20.1 | M0QY97 | Zinc finger CCCH domain-containing protein 4 | 13 | 0.619* |
| 20 | 316 | 22.2 | Q7Z417 | Nuclear fragile X mental retardation-interacting protein 2 | 7 | 0.518* |
| 21 | 117 | 25.4 | Q9UHN6 | Transmembrane protein 2 | 5 | 0.317** |
| 22 | 274 | 14.6 | B4DNN4 | Ribonucleoside-diphosphate reductase | 9 | 0.516* |
| 23 | 172 | 21.9 | Q12846 | Syntaxin-4 | 5 | 0.415* |
| 24 | 139 | 25.8 | H0Y5K5 | Endoplasmic reticulum-Golgi intermediate compartment protein 3 | 4 | 0.414** |
| 25 | 215 | 40.1 | B4DGU4 | Catenin beta-1 | 5 | 0.446** |
| 26 | 287 | 32.7 | K7EPB2 | cAMP-dependent protein kinase type I-alpha regulatory subunit | 9 | 0.332** |
| 27 | 131 | 16.1 | B2WTI3 | Bifunctional arginine demethylase and lysyl-hydroxylase JMJD6 | 4 | 0.632* |
| 28 | 260 | 15 | B3KN49 | cDNA FLJ13562 fis, clone PLACE1008080 | 5 | 0.211** |
| 29 | 269 | 17.7 | B3KSG9 | cDNA FLJ36188 fis, clone TESTI2027179 | 5 | 0.441** |
| 30 | 519 | 27.1 | P46013 | Antigen KI-67 | 20 | 0.281** |
| 31 | 219 | 32.9 | Q96A35 | 39S ribosomal protein L24, mitochondrial | 6 | 0.181** |
| 32 | 445 | 21.6 | B7Z591 | Transmembrane and coiled-coil domains 1, isoform CRA_a | 4 | 0.409** |
| 33 | 457 | 17.9 | Q9NYF8-2 | Isoform 2 of Bcl-2-associated transcription factor 1 | 11 | 0.338** |
| 34 | 222 | 25.8 | Q9UNK0 | Syntaxin-8 | 6 | 0.467* |
| 35 | 247 | 21.5 | Q9BYK8 | Helicase with zinc finger domain 2 | 4 | 0.607* |
| 36 | 156 | 19.7 | Q6LEU0 | STX12 protein | 4 | 0.557* |
| 37 | 164 | 29.1 | B2R6J0 | Homo sapiens SRY (sex determining region Y)-box 2 (SOX2) | 4 | 0.204** |
| 38 | 394 | 16.7 | Q92896-2 | Isoform 2 of Golgi apparatus protein 1 | 19 | 0.304* |
| 39 | 226 | 15.8 | B4DRG7 | Condensin complex subunit | 10 | 0.514* |
| 40 | 161 | 21.4 | Q9BXK1 | Krueppel-like factor 16 | 4 | 0.353* |
| 41 | 281 | 17.4 | Q8NFC6 | Biorientation of chromosomes in cell division protein 1-like 1 | 4 | 0.409* |
| 42 | 118 | 24.8 | P17301 | Integrin alpha-2 | 5 | 0.322** |
| 43 | 457 | 22.9 | Q15796-2 | Smad2 | 6 | 0.201** |
| 44 | 845 | 36.8 | P61586 | Transforming protein RhoA | 6 | 0.374* |
| 45 | 124 | 15.7 | Q15628 | Tumor necrosis factor receptor type 1-associated DEATH domain protein | 4 | 0.26** |
| 46 | 437 | 19.5 | Q01650 | Large neutral amino acids transporter small subunit 1 | 4 | 0.201* |
| 47 | 718 | 22.9 | Q86U75 | Dihydropyrimidinase-like 2 | 10 | 0.244* |
| 48 | 895 | 19.3 | H3BUX2 | Cytochrome b5 type B | 4 | 0.508* |
| 49 | 674 | 43.9 | H0YKC5 | Deoxyuridine 5~-triphosphate nucleotidohydrolase, mitochondrial | 7 | 0.299* |
| 50 | 355 | 27.2 | P62906 | 60S ribosomal protein L10a | 5 | 0.633* |
| 51 | 287 | 14.5 | B3KM90 | cDNA FLJ10529 fis, clone NT2RP2000965 | 8 | 0.672* |
| 52 | 134 | 17.9 | Q8NCC3 | Group XV phospholipase A2 | 4 | 0.495* |
| 53 | 148 | 19.8 | Q3LIB1 | Putative uncharacterized protein Nbla00445 | 8 | 0.612* |
| 54 | 163 | 20.4 | O43752 | Syntaxin-6 | 5 | 0.679* |
| 55 | 1445 | 53.8 | P04083 | Annexin A1 | 15 | 0.586* |
| 56 | 507 | 29.2 | P20645 | Cation-dependent mannose-6-phosphate receptor | 7 | 0.385** |
| 57 | 349 | 41.9 | P60520 | Gamma-aminobutyric acid receptor-associated protein-like 2 | 6 | 0.283** |
| 58 | 1061 | 47.1 | Q6FI35 | Proliferating cell nuclear antigen | 11 | 0.381** |
| 59 | 156 | 33.4 | B2RMQ4 | Cytoskeleton associated protein 2 | 4 | 0.607* |
| 60 | 192 | 16.5 | G3V5T9 | Cyclin-dependent kinase 2 | 5 | 0.633* |
| 61 | 263 | 37.9 | Q6IAA8 | Ragulator complex protein LAMTOR1 | 4 | 0.576* |
| 62 | 150 | 18.1 | B4DJI2 | cDNA FLJ53342 | 4 | 0.624* |
| 63 | 108 | 22 | B2R7M1 | cDNA, FLJ93507 | 4 | 0.376* |
| 64 | 140 | 17.3 | H0Y3T6 | 45 kDa calcium-binding protein | 4 | 0.558* |
| 65 | 147 | 27.4 | F8VX04 | Sodium-coupled neutral amino acid transporter 1 | 4 | 0.471* |
| 66 | 1103 | 54.2 | B4DJP7 | Small nuclear ribonucleoprotein Sm D3 | 5 | 0.277** |
| 67 | 731 | 26.1 | O94925-3 | Isoform 3 of Glutaminase kidney isoform, mitochondrial | 13 | 0.167** |
| 68 | 178 | 35.3 | P51151 | Ras-related protein Rab-9A | 5 | 0.267** |
| 69 | 197 | 20.7 | P15529-16 | Isoform 3 of Membrane cofactor protein | 4 | 0.566* |
| 70 | 125 | 18.9 | P46087-4 | Isoform 4 of Putative ribosomal RNA methyltransferase NOP2 | 6 | 0.162** |
| 71 | 268 | 23.6 | D6W4Z6 | HCG23833, isoform CRA_b | 4 | 0.654* |
| 72 | 271 | 27.9 | B7ZM24 | SLC12A2 protein | 9 | 0.64** |
| 73 | 583 | 42.1 | P36897.1 | TGF-beta receptor type-1 | 4 | 0.335** |
| 74 | 321 | 20.2 | P98172 | Ephrin-B1 | 5 | 0.539* |
| 75 | 192 | 25.3 | B7Z5A7 | cDNA FLJ57557 | 4 | 0.454* |
| 76 | 186 | 39.4 | B4E324 | cDNA FLJ60397 | 4 | 0.552* |
| 77 | 200 | 15.1 | Q9H5V8-2 | Isoform 2 of CUB domain-containing protein 1 | 10 | 0.648* |
| 78 | 249 | 18.6 | Q96T88-2 | Isoform 2 of E3 ubiquitin-protein ligase UHRF1 | 6 | 0.145** |
| 79 | 241 | 35.9 | B2R7 × 3 | cDNA, FLJ93645 | 4 | 0.245** |
| 80 | 191 | 22.6 | P54709 | Sodium/potassium-transporting ATPase subunit beta-3 | 6 | 0.544* |
| 81 | 119 | 18 | O14672 | Disintegrin and metalloproteinase domain-containing protein 10 | 6 | 0.342** |
| 82 | 257 | 18 | B3KXC3 | Ferritin | 5 | 0.557* |
| 83 | 236 | 51.1 | K7EJT5 | 60S ribosomal protein L22 | 6 | 0.544* |
| 84 | 278 | 14.9 | B7Z4 × 6 | cDNA FLJ51012, highly similar to Plasminogen activator inhibitor 1 | 5 | 0.339** |
| 85 | 1951 | 38.6 | Q9NR30 | Nucleolar RNA helicase 2 | 25 | 0.445* |
| 86 | 175 | 15.4 | B2RAK1 | cDNA, FLJ94965 | 11 | 0.537* |
| 87 | 209 | 26.9 | B4DMR3 | cDNA FLJ51896, highly similar to Glia-derived nexin | 8 | 0.235** |
| 88 | 332 | 18.6 | Q53G91 | Solute carrier family 16, member 3 variant (Fragment) | 4 | 0.334* |
| 89 | 130 | 16.3 | Q5U8S2 | Syntaxin 10 | 4 | 0.233** |
| 90 | 136 | 18.2 | Q9UNE7 | E3 ubiquitin-protein ligase CHIP | 5 | 0.402* |
| 91 | 385 | 26.5 | Q7Z4F3 | Caveolin | 4 | 0.471* |
| 92 | 130 | 18.2 | A8KAQ6 | cDNA FLJ76490 | 4 | 0.322* |
| 93 | 2202 | 38.5 | B4DMF5 | Glutamate dehydrogenase | 16 | 0.207** |
| 94 | 143 | 22.7 | B2R6P4 | cDNA, FLJ93048 | 4 | 0.113** |
| 95 | 1581 | 68.6 | P51149 | Ras-related protein Rab-7a | 13 | 0.246** |
| 96 | 257 | 15.9 | H3BRB3 | Kinesin-like protein KIF22 | 4 | 0.517* |
| 97 | 277 | 18.2 | P81605-2 | Isoform 2 of Dermcidin | 4 | 0.606* |
| 98 | 263 | 19.1 | Q8N353 | TMEM106B protein | 5 | 0.399* |
| 99 | 1189 | 34.5 | Q53G71 | Calreticulin variant | 11 | 0.601* |
| 100 | 395 | 20.9 | Q13217 | DnaJ homolog subfamily C member 3 | 5 | 0.374* |
| 101 | 126 | 17.4 | B2RE34 | cDNA, FLJ96901 | 4 | 0.442* |
| 102 | 174 | 26 | Q53GY1 | BCL2-associated athanogene 3 variant | 4 | 0.501* |
| 103 | 200 | 38 | Q9NQW6 | Actin-binding protein anillin | 8 | 0.695* |
| 104 | 110 | 27.9 | A8K3S3 | cDNA FLJ75664 | 5 | 0.326* |
| 105 | 326 | 18.1 | A8K201 | cDNA FLJ75605 | 4 | 0.425* |
| 106 | 115 | 17.9 | A8K274 | cDNA FLJ78227 | 4 | 0.689* |
| 107 | 438 | 25.8 | Q9NQ29-2 | Isoform 2 of Putative RNA-binding protein Luc7-like 1 | 8 | 0.686* |
| 108 | 20862 | 51.2 | Q15149-4 | Isoform 4 of Plectin | 20 | 0.686* |
| 109 | 164 | 27.5 | O00161 | Synaptosomal-associated protein 23 | 4 | 0.68* |
| 110 | 457 | 18.5 | Q59EZ3 | Insulin-like growth factor 2 receptor variant | 25 | 0.678* |
| 111 | 362 | 18 | A8MXZ4 | G-protein-coupled receptor family C group 5 member C | 5 | 0.673* |
| 112 | 682 | 14.9 | B3KRY3 | cDNA FLJ35079 fis, clone PLACE6005283 | 6 | 0.398** |
| 113 | 120 | 26.3 | B4DN85 | E3 ubiquitin-protein ligase | 4 | 0.595* |
| 114 | 108 | 10.8 | O15269 | Serine palmitoyltransferase 1 | 5 | 0.67* |
| 115 | 382 | 24.2 | B4DL49 | cDNA FLJ58073, moderately similar to Cathepsin B | 5 | 0.67* |
| 116 | 139 | 16 | H0YDJ9 | CD81 antigen | 4 | 0.657* |
| 117 | 522 | 32.4 | B4DKJ4 | cDNA FLJ57738 | 4 | 0.232** |
| 118 | 149 | 25.2 | B5BU32 | Thymidine kinase | 5 | 0.652* |
| 119 | 122 | 33.8 | O75976 | Carboxypeptidase D | 4 | 0.332* |
| 120 | 618 | 19.3 | P29317 | Ephrin type-A receptor 2 | 11 | 0.651* |
| 121 | 117 | 24.1 | D6RAR4 | Hepatocyte growth factor activator | 4 | 0.451* |
| 122 | 198 | 32.6 | G3V3D1 | Epididymal secretory protein E1 | 6 | 0.643* |
| 123 | 286 | 30.7 | C0JYY2 | Apolipoprotein B | 4 | 0.64* |
| 124 | 114 | 29 | F5H569 | V-type proton ATPase 116 kDa subunit a isoform 1 | 6 | 0.276** |
| 125 | 178 | 31.7 | B4E1K0 | Kinesin-like protein KIF23 | 4 | 0.633* |
| 126 | 156 | 51.4 | Q53HU8 | vimentin | 5 | 0.413* |
| 127 | 125 | 34.5 | Q14118 | Dystroglycan | 4 | 0.614* |
| 128 | 128 | 16.2 | C1K3N4 | Tumor necrosis factor receptor superfamily member 10a | 4 | 0.592* |
| 129 | 165 | 32.6 | Q13501-2 | Isoform 2 of Sequestosome-1 | 4 | 0.58* |
| 130 | 290 | 26.8 | F5GZY0 | Amyloid-like protein 2 | 4 | 0.576* |
| 131 | 410 | 26.2 | B4DJQ8 | cDNA FLJ5569 | 8 | 0.174** |
| 132 | 1790 | 32.8 | P11387 | DNA topoisomerase 1 | 26 | 0.044** |
| 133 | 186 | 17.3 | B2R686 | Trans-golgi network protein 2, isoform CRA_a | 4 | 0.542* |
| 134 | 191 | 30.7 | H0Y8A7 | NEDD4 family-interacting protein 2 | 4 | 0.331** |
| 135 | 112 | 27.7 | P62266 | 40S ribosomal protein S23 | 5 | 0.53* |
| 136 | 159 | 33.4 | B3KMB6 | cDNA FLJ10642 fis, clone NT2RP2005752 | 7 | 0.53* |
| 137 | 175 | 25 | B4DSG5 | cDNA FLJ56149 | 5 | 0.525* |
| 138 | 893 | 24.8 | Q71UA6 | Neutral amino acid transporter | 10 | 0.499* |
| 139 | 179 | 15.8 | A8K6H9 | cDNA FLJ75876 | 5 | 0.486* |
| 140 | 198 | 28.6 | Q9NRX5 | Serine incorporator 1 | 4 | 0.442* |
| 141 | 125 | 18.8 | B4DIB1 | cDNA FLJ55065 | 5 | 0.427* |
| 142 | 137 | 17.3 | P37173-2 | Isoform 2 of TGF-beta receptor type-2 | 4 | 0.349* |
| 143 | 753 | 25.1 | P55010 | Eukaryotic translation initiation factor 5 | 9 | 0.315* |
| 144 | 121 | 35.7 | P14174 | Macrophage migration inhibitory factor | 4 | 0.299** |
| 145 | 325 | 24.1 | E7EQY1 | Protein FAM136A | 5 | 0.432* |
| 146 | 124 | 19.6 | Q9NY27 | Serine/threonine-protein phosphatase 4 regulatory subunit 2 | 4 | 0.411* |
| 147 | 900 | 24.4 | P62306 | Small nuclear ribonucleoprotein F | 4 | 0.558* |
| 148 | 256 | 19.8 | C9JEH3 | Angio-associated migratory cell protein | 7 | 0.512** |
aRegulations (fold-changes) of differentially expressed proteins in MDA-MB-231 cells (metapristone-treatment versus control). *P < 0.05; **P < 0.01.
Figure 3. Categorization of all differential expressed proteins by GO analysis.
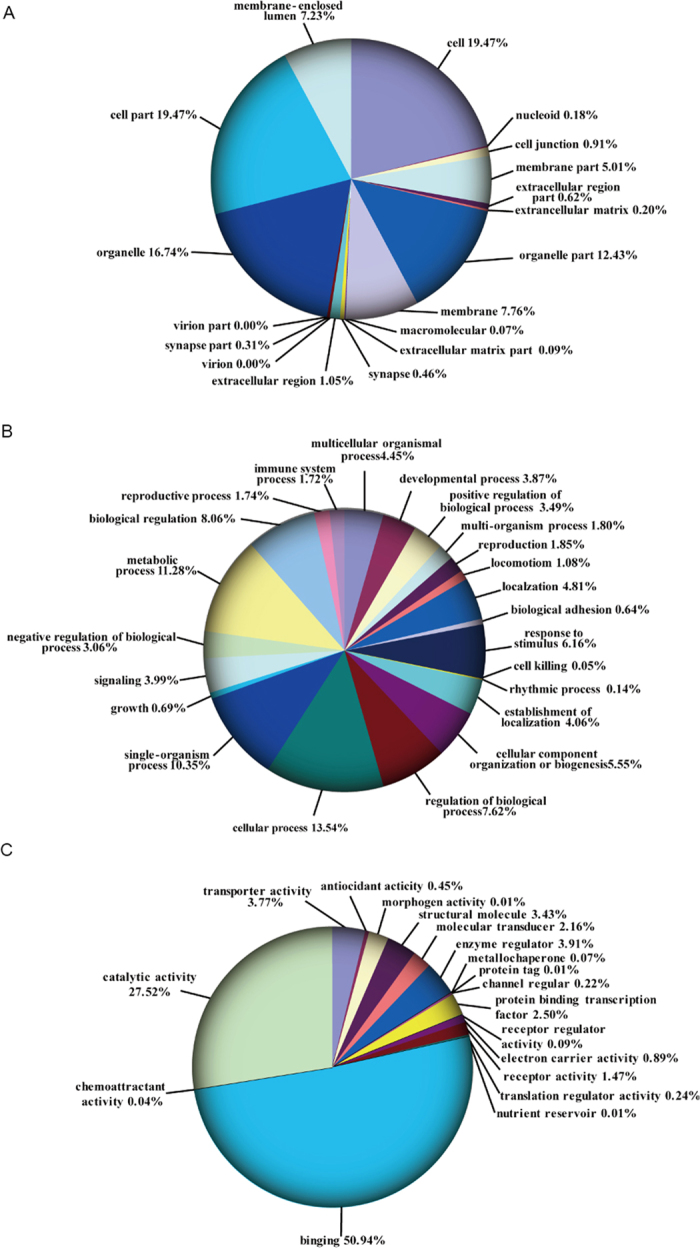
(A) cellular component. (B) biological process. C,molecular function (P < 0.05).
Figure 4. Functional category coverage of the proteins identified.

KEGG pathway analysis was also performed based on the 311 DEPs. A total of 249 metapristone-related pathways were identified, which were assigned into 33 statistically remarkable categories (P value < 0.01) (Table 3), including metabolic (such as “NADH dehydrogenase”, P56181-2), Oxidative phosphorylation (such as “ATP synthase”, O75947), MAPK signaling pathway (such as “Rac GTPase activating protein 1”, B2RE34), Wnt signaling pathway (such as “RhoA”, P61586), Focal adhesion (such as “Integrin alpha-2”, P17301), ECM-receptor interaction (such as “Dystroglycan”, Q14118), VEGF signaling pathway (such as “Protein kinase C”, Q2TSD3), and TGF-beta signaling pathway (such as “TGF-beta receptor type-2”, P37173-2).
Table 3. Pathway analysis of the DEPs obtained from the iTRAQ analysis.
| Pathway description | Count | P-value |
|---|---|---|
| Metabolic pathways | 81 | 5.21E-11 |
| RNA transport | 74 | 1.13E-10 |
| Endocytosis | 58 | 1.49E-10 |
| Oxidative phosphorylation | 56 | 2.83E-09 |
| Apoptosis | 53 | 5.78E-09 |
| Focal adhesion | 48 | 1.18E-08 |
| MAPK signaling pathway | 36 | 5.62E-08 |
| Regulation of actin cytoskeleton | 35 | 8.21E-08 |
| GnRH signaling pathway | 33 | 1.91E-07 |
| B cell receptor signaling pathway | 31 | 2.05E-07 |
| Calcium signaling pathway | 30 | 1.13E-06 |
| Chemokine signaling pathway | 28 | 3.61E-06 |
| NF-kappa B signaling pathwy | 27 | 4.13E-06 |
| Peroxisome | 27 | 1.70E-05 |
| T cell receptor signaling pathway | 25 | 2.18E-05 |
| ErbB signaling pathway | 23 | 3.62E-05 |
| Neurotrophin signaling pathway | 23 | 4.21E-05 |
| Toll-like receptor signaling pathway | 23 | 4.36E-05 |
| Jak-STAT signaling pathway | 23 | 6.99E-05 |
| Insulin signaling pathway | 20 | 0.000134 |
| Notch signaling pathway | 21 | 0.000313 |
| ECM-receptor interaction | 19 | 0.000397 |
| mTOR signaling pathway | 19 | 0.000724 |
| p53 signaling pathway | 17 | 0.000797 |
| TGF-beta signaling pathway | 17 | 0.000913 |
| VEGF signaling pathway | 16 | 0.001033 |
| PPAR signaling pathway | 15 | 0.001334 |
| Adherens junction | 13 | 0.001427 |
| Wnt signaling pathway | 12 | 0.003628 |
| Cell adhesion molecules (CAMs) | 11 | 0.003316 |
| Drug metabolism-cytochrome P450 | 8 | 0.004733 |
| ABC transporters | 7 | 0.007124 |
| Regulation of autophagy | 6 | 0.008114 |
There were 249 pathways revealed. Among them, the following 33 signaling pathways were significant (P < 0.01).
Western blot validation of the proteomics analysis
Following the database search and classification of proteins, many differentially expressed proteins were reported to be involved in epithelial-to-mesenchymal transition (EMT), such as E-cadherin, vimentin, syndecan-1, β-catenin, dystroglycan, Smad2/3, glutaredoxin, TGF-β receptor, and so on. Western blots were performed on some selected proteins (E-cadherin, vimentin, β-catenin, and Smad 2) to further verify the iTRAQ results (Fig. 5B,C). While vimentin, one mesenchymal cell marker, was down-regulated by metapristone treatment, E-cadherin, one epithelial cell marker, strengthened with the increasing concentration of metapristone. Moreover, the expression of phosphorylation of Smad 2 was also found to be decreased by metapristone treatment. Notably, the western blot images correlated very well and thus confirmed the iTRAQ data obtained.
Figure 5. The effect of metapristone on cell morphology and EMT markers in MDA-MB-231 cells.

(A) morphological changes were observed by phase-contrast microscopy. (B,C) the expression of vimentin E-cadherin, β-catenin, Smad2, and pSmad2 in MDA-MB-231 cells treated with or without metapristone (50 μM) was assessed by immunoblotting analysis. (D) confocal microscope images of vimentin immunostained with goat anti-rabbit IgG-CY3 antibody (green) and E-cadherin immunostained with goat anti-mouse IgG-FITC antibody (red) in MDA-MB-231 cells untreated or treated metapristone (50 μM).
Metapristone impedes EMT in MDA-MB-231cells in vitro
Epithelial to mesenchymal transition (EMT) and extracellular matrix degradation are critical for the initiation and progression of tumor invasion. As shown in Fig. 5A, MDA-MB-231 cells initially exhibited a typical mesenchymal-like morphology with long and narrow stretch, while cells under the treatment of metapristone showed epithelial-like morphology with relatively round extension on the plastic surface. Furthermore, we sought to determine whether metapristone could inhibit Epithelial-mesenchymal transition by regulating EMT-related markers, such as vimentin (mesenchymal-specific marker) and E-cadherin (epithelial-specific marker). As shown in Fig. 5D, up-regulated E-cadherin accumulated in the cell to cell junctions after metapristone treatment. Accordingly, the significantly reduced expression of the mesenchymal-specific marker vimentin was observed in the presence of metapristone.
Discussion
Breast cancer metastasis accounts for the lethality of the disease and therefore there is an urgent need to develop new chemopreventives to inhibit cancer cell metastasis16,17. Experimental, epidemiological, and clinical data from the last three decades have each supported the hypothesis that oral contraceptive, such as mifepristone, possesses anticancer properties18,19. Then metapristone, the most predominant biological active metabolite of mifepristone, is being developed as a novel cancer metastasis chemopreventive agent by us.
Metastasis is a hallmark of cancer and the leading cause of mortality among cancer patients. The first step in metastasis is the migration of cancer cells away from the primary tumor, a process called tumor invasion20. Therefore, much research effortin recent years has been directed toward disruption of this step of the metastatic process21,22. In this study, we chose MDA-MB-231 cells with high metastatic potential to explore the effects of metapristone on the metastatic activity of human breast cancer cells. We showed that metapristone markedly inhibited their migratory (Fig. 1B) and invasive (Fig. 1D) abilities of MDA-MB-231 cells at low concentrations. Adhesion of cancer cells to ECM or vascular endothelium is also a crucial starting point of metastasis23. Here, we also found that metapristone markedly and in a concentration-dependent manner inhibited the adherence of MDA-MB-231 cells to endothelial monolayers. Collectively, these results suggested that metapristone had the ability to inhibit breast cancer cells metastasis. However, the underlying mechanism remains elusive.
Pharmacoproteomic, especially quantitative pharmacoproteomics, has been emerging as a powerful tool in cancer research, providing a unique avenue to investigate direct drug targets at a functional level24,25. Here, we have demonstrated the ability of the isobaric tags to detect and quantify differences in expression levels of proteins between metapristone-treated and untreated MDA-MB-231 cells that reflect functions associated with cancer cells metastasis. Temporal iTRAQ analysis identified 311 proteins as differentially expressed, with 163 as up-regulated (Table 1) and 148 as down-regulated (Table 2). Followed by GO analysis and KEGG pathway analysis, we established their potentially functional classification for the first time: there are 249 pathways, including metabolic, oxidative phosphorylation, p53, MAPK, Wnt, focal adhesion, VEGF, TGF-beta signaling pathways and so on (Table 3). Importantly, some of these pathways were reported to be linked to epithelial-to-mesenchymal transition (EMT) process, which was related with cancer carcinogenesis, prognosis and especially metastasis14,26.
The epithelial-to-mesenchymal transition (EMT) has been considered as the initiation process of cancer metastasis, when non-invasive and non-metastatic tumor cells lose their epithelial phenotype, acquire invasive properties, infiltrate surrounding tissues and metastasize to secondary sites27,28.Turning an epithelial cell into a mesenchymal cell requires loss of epithelial polarity, alteration in cellular architecture and acquisition of migrationcapacity29. It has also been described that during EMT, the epithelial cells acquire mesenchymal morphology, hence the expression of epithelial markers decreases and the expression of mesenchymal markers increases30,31. Here, we found that MDA-MB-231 cells initially exhibited a typical mesenchymal-like morphology with long and narrow stretch, while under the treatment of metapristone, cells showed epithelial-like morphology with relatively round extension on the plastic surface (Fig. 5A). We also found that metapristone-treatment resulted in decreased expression of mesenchymal marker “vimentin” and increased expression of epithelial marker “E-cadherin” in MDA-MB-231. Vimentin is a well-known metastasis marker and therapeutic target, as inhibiting vimentin function reduces the ability of cells to migrate32. Some anti-cancer drugs that are currently used in the clinic directly target vimentin such as “silibinin”33 and “withaferin A”34. One of the hallmarks of EMT is the functional loss of E-cadherin, which is thought to be a metastatic suppressor during tumor progression35. E-cadherin, encoded by the gene CDH1, is a transmembrane glycoprotein responsible for calcium-dependent cell-to-cell adhesion. E-cadherin plays a pivotal role in cadherin-catenin-cytoskeleton complexes, and it grants anti-invasive and anti-migratory properties to epithelial cells36,37. Our results suggest that metapristone inhibits cell migration, adhesion and invasion in highly metastatic human breast cancer cells, maybe in part, through the regulation of significant EMT-related markers which then leads to reversal of EMT.
Epithelial-to-mesenchymal transition, the process closely related to tumor development, is often regulated by a variety of signaling pathways and cytokines12,13,14,26. In this work, we performed KEGG pathway analysis based on the differential expressed proteins in MDA-MB-231 cells under metapristone-treated and untreated. We found some DEPs, including TGF β receptor I/II, Smad 2/3, RhoA, and Glutaredoxin, were related with Transforming Growth Factor β (TGF β) signaling pathway. TGF β signaling pathway has been characterized as an important inducer of EMT via several downstream signaling moleculars13. TGF β signals via formation of a heterotetrameric complex of TGF β receptor I/II (TGF β RI/RII), in which the active TGF β RII phosphorylates and activates the TGF β RI at the plasma membrane38,39. This conformational switch allows activated TGF β RI to interact with Smad2/3 through their MH2 domain. The activated type I receptor then propagates the signal to the nucleus by phosphorylating Smad 2 and Smad 3. Then, Smad2/3 can directly or indirectly regulate gene expression by controlling epigenetic processes, such as chromatin remodeling or by maintaining promoter DNA methylation, which is critical in silencing epithelial gene expression in cells that have undergone EMT40. Meanwhile, there exists a non-Smad pathway induced by TGF β41. In this non-Smad pathway, TGF β RII phosphorylates PAR6 (partitioning-defective protein 6), then inactivates the epithelial polarity complex, as well as activating of the small GTPase RhoA, which is contribute to cell invasion leading to breast cancer metastasis42. Furthermore, glutaredoxin (Grx), an anti-oxidant enzyme, was reported to play an important role in intervening TGF β-induced EMT process by reducing ROS generation in intracellular and suppressing the expression of mesenchymal markers43. Our results demonstrated that metapristone significantly inhibited the protein expression levels of TGF β RI/RII, RhoA, Smad 2/3, and up-regulated the expression level of glutaredoxin, implying that metapristone maybe in part, reverse EMT through attenuating TGFβ signaling pathway in MDA-MB-231 cells.
In addition to the TGF β signaling pathway, the Wnt signaling pathway also plays an important role in EMT44,45. Wnt pathway contributes to EMT by activating β-catenin, and then activating Snail, which in turn suppresses epithelial markers expression like E-cadherin45,46. Meanwhile, Caveolin-1 (CAV1), the principal structural protein of the cholesterol-rich plasma membrane invaginations, could induce EMT process through Wnt/β-catenin pathway to promote cancer metastasis47,48. Caveolin-1 is also an important regulator of cell polarity and directional movement49. The decreases in caveolin-1 expression follows classically described cellular changes associated with MET (including changes in cell morphology and expression of the E-cadherins and fibronectin)50. Our studies show that metapristone inhibits cell growth, and reverses EMT in conjunction with the activation of E-cadherin, and the inactivation of β-catenin and Caveolin-1 in MDA-MB-231 cells, implying that the MET potential of metapristone maybe related with Wnt signaling pathway.
In conclusion, our data show that metapristone inhibits migration, adhesion, and invasion abilities of the breast cancer cells. The pharmacoproteomic study reveals that metapristone intervenes EMT-related signaling pathways, such as TGF-β and Wnt signaling pathways, in conjunction with the activation of E-cadherin and glutaredoxin and inactivation of vimentin, TGFβ RI/RII, Smad2/3, RhoA, β-catenin and Caveolin-1 (Fig. 6). These findings imply that the application of metapristone is a possible new method to control EMT, which contributes to metastatic processes in breast cancer. Our results suggest that knowledge of the putative pharmacoproteomic mechanisms will promote better use of existing drugs and facilitate the conception of new therapies and new drug development.
Figure 6. The schematic representation represents the MET potential of metapristone in MDA-MB-231 cells.

Metapristone inhibits EMT by regulating TGF-β or Wnt signaling pathways. Metapristone inhibits EMT through Smad or non-Smad pathways involved in TGF-β signaling pathway, which results in suppression of mesenchymal and up-regulation of epithelial marker expression. Metapristone depressed EMT through regulating Wnt signaling pathway mediated by β-catenin and caveolin.
Materials and Methods
Cell culture, antibodies and reagents
MDA-MB-231 human breast cancer cells were purchased from American Type Culture Collection (ATCC, Manassas, VA) and maintained in ATCC-formulated Leibovitz’s L-15 Medium (Catalog No. 30-2008). Cells were supplemented with heat inactivated fetal bovine serum to a final concentration of 10%, and incubated at 37 °C in a free gas exchange with atmospheric air. Mouse monoclonal anti-vimentin (ab8978), -E-cadherin (ab1416), -β-actin antibodies (ab6276), goat anti-rabbit (ab150077) and goat anti-mouse (ab150115) antibodies were all obtained from Abcam Corporation.
In vitro cytotoxicity studies
The cytotoxicity of metapristone was investigated by the MTT assayas described previously by this lab51,52. Briefly, MDA-MB-231 cells were seeded into 96-well plates at a density of 1 × 10⁴ cells/well, and then incubated at 37 °C in a humidified atmosphere with 100% air. After overnight incubation, the cells were treated with different concentrations of metapristone for 24 h. Culture medium was used as a blank control. Then, cells were incubation with the MTT solution (5 mg/ml) in the medium without phenol red and serum for another 4 h. The MTT-formazan formed by metabolically viable cells was dissolved in 150 μl of dimethyl sulfoxide (DMSO). Cell viability was determined by detecting the absorbance at 565 nm using an infinite M200 Pro microplate reader (Tecan, Switzerland). The absorbance of untreated cells was considered as 100%. Each sample was assayed in triplicate in three independent experiments.
Wound healing assay
Migration of MDA-MB-231 cells was investigated in the in vitro wound-healing assay as described previously by this lab3,51. The MDA-MB-231 cells were seeded in 6-well plate; once confluent, 10 μg/ml mitomycin C was added. The scratch wound was generated in the surface of the plate using a pipette tip, followed by extensive washing with serum-free medium to remove cell debris. DMSO (final concentration: 0.1%) as vehicle control was added after wounding. Cells were then cultured and allowed to migrate into the wound area for up to 24 h at 37 °C. At indicated time points, motility was quantified by measuring the average extent of wound closure. Each well was counted under a light microscope (Zeiss, Germany) at a magnification of 10 × and then photographed.
Cell invasion assay
Cell invasion assay was performed using 24-well transwells (Costar, Coring Incorporated, USA), which allows cells to migrate through a polycarbonate membrane with 8-μm pore size as we described previously52,53. Briefly, in transwell cell culture chambers, filters of 8 mm pore size were coated with Matrigel on the upper surface. MDA-MB-231 cells were resuspended with reduced serum L-15 medium and seeded 5 × 10⁴ per well on the upper chamber of the transwell apparatus. Invasion assay was performed in the presence of 0, 10, 50, 75 μM of metapristone. DMSO (final concentration: 0.1%) was used as vehicle control. After 24 h incubation, the cells on the inner layer were softly removed with a cotton swab. Then, the adherent cells on undersurface of the insert were fixed in methanol and stained with 0.1% crystal violet for 20 min. The filters were washed with PBS and images were taken by a light microscope (Zeiss, Germany) at × 200 magnification. Five fields were counted per filter in each group and the experiment was conducted in triplicate.
Cell adhesion assay
The adhesion assay of MDA-MB-231 cells to the HUVECs was assessed according to the method described previously by this lab with minor modifications3,52. Briefly, Human umbilical vein endothelial cells (HUVECs) were isolated and utilized between passages 2 and 5, and grown to confluence in 24-well culture plates. Then, TNF-α (final concentration: 10 ng/ml) was used to activate HUVECs for 4 hours. Rhodamine 123-labled MDA-MB-231 cells were co-cultured with the HUVEC monlayers in each well, followed by treatment with metapristone for 1 hour. DMSO (0.1%) was used as the vehicle control. The nonadherent cells were removed from the plate by careful three-time washings with PBS, and the MDA-MB-231 cells bound to the HUVECs were measured by a fluorescence microscope (Zeiss, Germany). Then, ten visual fields for each well were selected randomly and taken pictures. Mean inhibition of adhesion for 10 visual fields was calculated by using the equation: % of control adhesion = [the number of adhered cells in treated group/the number of adhered cells in the control group] × 100%.
Protein preparation and iTRAQ labeling
MDA-MB-231 cells were cultured and treated with 50 μM metapristone. Treated and untreated cells were suspended in the Lysis buffer (7 M Urea, 2 M Thiourea, 4% CHAPS, 40 mM Tris-HCl, pH8.5, 1 mM PMSF, 2 mM EDTA) and sonicated in ice. The proteins were reduced with 10 mM DTT (final concentration) at 56°C for 1 h and then alkylated by 55 mM IAM (final concentration) in the darkroom for 1 h. The reduced and alkylated protein mixtures were precipitated by adding 4 × volume of chilled acetone at −20 °C overnight. After centrifugation at 4 °C, 30000 g, the pellet was dissolved in 0.5 M TEAB (Applied Biosystems, Milan, Italy) and sonicated in ice. After centrifuging at 30000 g at 4°C, an aliquot of the supernatant was taken and protein concentration was determined using the Bradford method. Then, total protein (100 μg) of each sample was digested with Trypsin Gold (Promega, Madison, WI, USA) with the ratio of protein: trypsin = 30:1 at 37°C for 16 hours. After trypsin digestion, peptides were dried by vacuum centrifugation, reconstituted in 0.5 M TEAB, and processed according to the manufacture’s protocol for 8-plex iTRAQ reagent (Applied Biosystems, Foster City,CA). The labeled peptide mixtures were pooled and dried by vacuum centrifugation, and then fractionated using Poly SULFOETHYL ATM SCX column (200 × 4.6 mm, 5 μm particle size, 200 A° pore size) by HPLC system (Shimadzu, Japan) at flow rate 1.0 ml min-1. The eluted peptides were pooled into 20 fractions, desalted with a Strata × C 18 column, concentrated to dryness using vacuum centrifuge and then reconstituted in 0.1% formic acid for LC-MS/MS analysis.
LC-ESI-MS/MS analysis based on Q EXACTIVE
The mass spectroscopy analysis was performed using a tandem mass spectrometry (MS/MS) in an Q EXACTIVE (Thermo Fisher Scientific, San Jose, CA) coupled online to the HPLC as described before54,55. Peptides were selected for MS/MS using high-energy collision dissociation (HCD) operating mode with a normalized collision energy setting of 27.0; ion fragments were detected in the Orbitrap at a resolution of 17500. A data-dependent procedure that alternated between one MS scan followed by 15 MS/MS scan with a following Dynamic Exclusion duration of 15s. Proteins identification was performed by using Mascot search engine (Matrix Science, London, UK; version 2.3.02). For protein quantitation, it was required that a protein contains at least two unique peptides. The quantitative protein ratios were weighted and normalized by the median ratio in Mascot. We only used ratios with p-values < 0.05, and only fold changes of >1.5 were considered as significant.
Proteomic data analysis
Functional annotations of the proteins were conducted using Blast2GO program against the non-redundant protein database (NR; NCBI). The keg database (http:www.genome.jp/keg/), the COG database (http://www.ncbi.nlm.nih.gov/COG/), and GO (Gene Ontology) analyses (http://www.geneontology.org) were used to classify and group these identified proteins according to the methods reported in early literature15,56.
Western blot analysis
Cell lysates were collected using radio immunoprecipitation (RIPA) lysis buffer, supplemented with HALT protease and phosphatase inhibitor cocktail (Thermo Scientific), and immunodetection of electrophoresis-resolved proteins was performed using standard protocols. The E-Cadherin, vimentin, Smad2, pSmad2, β-catenin, and β-actin antibodies were from Abcam. Immunodetection was accomplished using enhanced chemiluminescence, and data were acquired with a quantitative digital imaging system (Quantity One, Bio-Rad) allowing it to check for saturation. Overall emitted photons were quantified for each band, particularly for homogeneously the loading controls.
Immunofluorescence staining and high-content confocal imaging
MDA-MB-231 cells were cultured on a 35 mm cell culture dish (NEST, GBD-35-20) to 50% confluence at least 2 days before carrying out the immunofluorescence assay. Cells (with or without metapristone-treatment) were first washed by phosphate buffer 3 times and then fixed by 4% paraformaldehyde for 30 minutes. One milliliter of 0.1% Triton-X-100 was subsequently added to culture cells for ten minutes to increase cell permeability. Cells were blocked for 30 minutes at room temperature with 10% goat serum followed by culturing with primary antibodies, mouse monoclonal anti-vimentin antibody and E-cadherin for 1 h at room temperature. Then cells were added with secondary antibodies, Goat Anti-Mouse IgG-FITC antibody (Boster, BA1101) and Goat Anti-Rabbit IgG-CY3 antibody (Boster, BA1032) respectively, and cultured in the dark for 1 h at room temperature. Phosphate buffer was used to wash cells for at least three times between every two contiguous steps. Confocal analysis was performed on a Leica-TCS-SP8 confocal microscope and the images were taken under the same parameter configuration.
Statistical analysis
All data were analyzed using SASS software and expressed as the mean ± SD or SE. Statistical comparisons between different groups were performed using Student t-test. A P value of <0.05 was considered to be statistically significant.
Additional Information
How to cite this article: Yu, S. et al. Pharmacoproteomic analysis reveals that metapristone (RU486 metabolite) intervenes E-cadherin and vimentin to realize cancer metastasis chemoprevention. Sci. Rep. 6, 22388; doi: 10.1038/srep22388 (2016).
Acknowledgments
This work was supported by the National Natural Science Foundation of China (NSFC) (No. 81502617, 81273548), Fujian Development and Reform Commission (2014/168), and Fujian Science and Technology plan project (2015Y0071).
Footnotes
Author Contributions S.Y. and L.J. conceived and designed the experiments. C.Y. and X.Y. performed cell culture experiments and carried out the iTRAQ analysis. S.H. and Z.T. carried out the cell migration and adhesion experiments, J.L. performed the western blot experiments, C.Q., C.H. and Y.L. acquired and analyzed the experimental data. L.J. and S.Y. wrote the manuscript. All authors reviewed the manuscript.
References
- Siegel R., Ma J., Zou Z. & Jemal A. Cancer statistics, 2014. CA Cancer J Clin 64, 9–29 (2014). [DOI] [PubMed] [Google Scholar]
- Jemal A. et al. Global cancer statistics. CA Cancer J Clin 61, 69–90 (2011). [DOI] [PubMed] [Google Scholar]
- Wang J. et al. Synthesis, spectral characterization, and in vitro cellular activities of metapristone, a potential cancer metastatic chemopreventive agent derived from mifepristone (RU486). AAPS J 16, 289–298 (2014). [DOI] [PMC free article] [PubMed] [Google Scholar]
- Chen J. Z. et al. A novel UPLC/MS/MS method for rapid determination of metapristone in rat plasma, a new cancer metastasis chemopreventive agent derived from mifepristone (RU486). J Pharm Biomed Anal 95, 158–163 (2014). [DOI] [PubMed] [Google Scholar]
- Chen J. et al. The unique pharmacological characteristics of mifepristone (RU486): from terminating pregnancy to preventing cancer metastasis. Med Res Rev 34, 979–1000 (2014). [DOI] [PubMed] [Google Scholar]
- Jia L., Coward L., Gorman G. S., Noker P. E. & Tomaszewski J. E. Pharmacoproteomic effects of isoniazid, ethambutol, and N-geranyl-N’-(2-adamantyl)ethane-1,2-diamine (SQ109) on Mycobacterium tuberculosis H37Rv. J Pharmacol Exp Ther 315, 905–911 (2005). [DOI] [PubMed] [Google Scholar]
- Chahrour O., Cobice D. & Malone J. Stable isotope labelling methods in mass spectrometry-based quantitative proteomics. J Pharm Biomed Anal 113, 2–20 (2015). [DOI] [PubMed] [Google Scholar]
- Gan C. S., Chong P. K., Pham T. K. & Wright P. C. Technical, experimental, and biological variations in isobaric tags for relative and absolute quantitation (iTRAQ). J Proteome Res 6, 821–827 (2007). [DOI] [PubMed] [Google Scholar]
- Martinez-Esteso M. J., Casado-Vela J., Selles-Marchart S., Pedreno M. A. & Bru-Martinez R. Differential plant proteome analysis by isobaric tags for relative and absolute quantitation (iTRAQ). Methods Mol Biol 1072, 155–169 (2014). [DOI] [PubMed] [Google Scholar]
- Li L. & Li W. Epithelial-mesenchymal transition in human cancer: comprehensive reprogramming of metabolism, epigenetics, and differentiation. Pharmacol Ther 150, 33–46 (2015). [DOI] [PubMed] [Google Scholar]
- Mitra A., Mishra L. & Li S. EMT, CTCs and CSCs in tumor relapse and drug-resistance. Oncotarget 6, 10697–10711 (2015). [DOI] [PMC free article] [PubMed] [Google Scholar]
- Chen Z., Shao Y. & Li X. The roles of signaling pathways in epithelial-to-mesenchymal transition of PVR. Mol Vis 21, 706–710 (2015). [PMC free article] [PubMed] [Google Scholar]
- Papageorgis P. TGFbeta Signaling in Tumor Initiation, Epithelial-to-Mesenchymal Transition, and Metastasis. J Oncol 2015, 587193 (2015). [DOI] [PMC free article] [PubMed] [Google Scholar]
- Gonzalez D. M. & Medici D. Signaling mechanisms of the epithelial-mesenchymal transition. Sci Signal 7, re8 (2014). [DOI] [PMC free article] [PubMed] [Google Scholar]
- Bauer S., Robinson P. N. & Gagneur J. Model-based gene set analysis for Bioconductor. Bioinformatics 27, 1882–1883 (2011). [DOI] [PMC free article] [PubMed] [Google Scholar]
- Yin W. et al. Efficacy and safety of capecitabine-based first-line chemotherapy in advanced or metastatic breast cancer: a meta-analysis of randomised controlled trials. Oncotarget 6, 39365–39372 (2015). [DOI] [PMC free article] [PubMed] [Google Scholar]
- Mustacchi G. & De Laurentiis M. The role of taxanes in triple-negative breast cancer: literature review. Drug Des Devel Ther 9, 4303–4318 (2015). [DOI] [PMC free article] [PubMed] [Google Scholar]
- Masters G. A. et al. Clinical cancer advances 2015: Annual report on progress against cancer from the American Society of Clinical Oncology. J Clin Oncol 33, 786–809 (2015). [DOI] [PubMed] [Google Scholar]
- Wargon V. et al. Progestin and antiprogestin responsiveness in breast cancer is driven by the PRA/PRB ratio via AIB1 or SMRT recruitment to the CCND1 and MYC promoters. Int J Cancer 136, 2680–2692 (2015). [DOI] [PMC free article] [PubMed] [Google Scholar]
- Clark A. G. & Vignjevic D. M. Modes of cancer cell invasion and the role of the microenvironment. Curr Opin Cell Biol 36, 13–22 (2015). [DOI] [PubMed] [Google Scholar]
- Herbertz S. et al. Clinical development of galunisertib (LY2157299 monohydrate), a small molecule inhibitor of transforming growth factor-beta signaling pathway. Drug Des Devel Ther 9, 4479–4499 (2015). [DOI] [PMC free article] [PubMed] [Google Scholar]
- Lai Y. H. et al. Rhodomycin A, a novel Src-targeted compound, can suppress lung cancer cell progression via modulating Src-related pathways. Oncotarget 6, 26252–26265, (2015). [DOI] [PMC free article] [PubMed] [Google Scholar]
- Yates C. M., McGettrick H. M., Nash G. B. & Rainger G. E. Adhesion of tumor cells to matrices and endothelium. Methods Mol Biol 1070, 57–75, (2014). [DOI] [PubMed] [Google Scholar]
- Roumeliotis T. I. et al. Pharmacoproteomic study of the natural product Ebenfuran III in DU-145 prostate cancer cells: the quantitative and temporal interrogation of chemically induced cell death at the protein level. J Proteome Res 12, 1591–1603 (2013). [DOI] [PubMed] [Google Scholar]
- Bang J. Y. et al. Pharmacoproteomic analysis of a novel cell-permeable peptide inhibitor of tumor-induced angiogenesis. Mol Cell Proteomics : MCP 10, M110 005264 (2011). [DOI] [PMC free article] [PubMed] [Google Scholar]
- Saitoh M. Epithelial-mesenchymal transition is regulated at post-transcriptional levels by transforming growth factor-beta signaling during tumor progression. Cancer Sci 106, 481–488 (2015). [DOI] [PMC free article] [PubMed] [Google Scholar]
- Pasquier J., Abu-Kaoud N., Al Thani H. & Rafii A. Epithelial to Mesenchymal Transition in a Clinical Perspective. J Oncol 2015, 792182 (2015). [DOI] [PMC free article] [PubMed] [Google Scholar]
- Zhou L., Shi L., Guo H. & Yao X. MYSM-1 suppresses migration and invasion in renal carcinoma through inhibiting epithelial-mesenchymal transition. Tumour Biol, doi: 10.1007/s13277-015-4138-z (2015). [DOI] [PubMed] [Google Scholar]
- Lee J. M., Dedhar S., Kalluri R. & Thompson E. W. The epithelial-mesenchymal transition: new insights in signaling, development, and disease. J Cell Biol 172, 973–981 (2006). [DOI] [PMC free article] [PubMed] [Google Scholar]
- Barriere G. et al. Circulating tumor cells and epithelial, mesenchymal and stemness markers: characterization of cell subpopulations. Ann Transl Med 2, 109 (2014). [DOI] [PMC free article] [PubMed] [Google Scholar]
- Mimeault M. & Batra S. K. Molecular biomarkers of cancer stem/progenitor cells associated with progression, metastases, and treatment resistance of aggressive cancers. Cancer Epidemiol Biomarkers Prev 23, 234–254 (2014). [DOI] [PMC free article] [PubMed] [Google Scholar]
- Vuoriluoto K. et al. Vimentin regulates EMT induction by Slug and oncogenic H-Ras and migration by governing Axl expression in breast cancer. Oncogene 30, 1436–1448 (2011). [DOI] [PubMed] [Google Scholar]
- Wu K. J. et al. Silibinin inhibits prostate cancer invasion, motility and migration by suppressing vimentin and MMP-2 expression. Acta Pharmacol Sin 30, 1162–1168 (2009). [DOI] [PMC free article] [PubMed] [Google Scholar]
- Challa A. A., Vukmirovic M., Blackmon J. & Stefanovic B. Withaferin-A reduces type I collagen expression in vitro and inhibits development of myocardial fibrosis in vivo. PloS one 7, e42989 (2012). [DOI] [PMC free article] [PubMed] [Google Scholar]
- Pecina-Slaus N. Tumor suppressor gene E-cadherin and its role in normal and malignant cells. Cancer Cell Int 3, 17 (2003). [DOI] [PMC free article] [PubMed] [Google Scholar]
- Buckley C. D. et al. Cell adhesion. The minimal cadherin-catenin complex binds to actin filaments under force. Science 346, 1254211 (2014). [DOI] [PMC free article] [PubMed] [Google Scholar]
- Semina E. V. et al. Novel mechanism regulating endothelial permeability via T-cadherin-dependent VE-cadherin phosphorylation and clathrin-mediated endocytosis. Mol Cell Biochem 387, 39–53 (2014). [DOI] [PMC free article] [PubMed] [Google Scholar]
- Forbes K., Souquet B., Garside R., Aplin J. D. & Westwood M. Transforming growth factor-{beta} (TGF{beta}) receptors I/II differentially regulate TGF{beta}1 and IGF-binding protein-3 mitogenic effects in the human placenta. Endocrinology 151, 1723–1731 (2010). [DOI] [PubMed] [Google Scholar]
- Melisi D. et al. LY2109761, a novel transforming growth factor beta receptor type I and type II dual inhibitor, as a therapeutic approach to suppressing pancreatic cancer metastasis. Mol Cancer Ther 7, 829–840 (2008). [DOI] [PMC free article] [PubMed] [Google Scholar]
- Qiu X., Cheng J. C., Zhao J., Chang H. M. & Leung P. C. Transforming growth factor-beta stimulates human ovarian cancer cell migration by up-regulating connexin43 expression via Smad2/3 signaling. Cell Signal 27, 1956–1962 (2015). [DOI] [PubMed] [Google Scholar]
- Fazilaty H., Gardaneh M., Bahrami T., Salmaninejad A. & Behnam B. Crosstalk between breast cancer stem cells and metastatic niche: emerging molecular metastasis pathway? Tumour Biol 34, 2019–2030 (2013). [DOI] [PubMed] [Google Scholar]
- Fleming Y. M. et al. TGF-beta-mediated activation of RhoA signalling is required for efficient (V12)HaRas and (V600E)BRAF transformation. Oncogene 28, 983–993 (2009). [DOI] [PubMed] [Google Scholar]
- Lee E. K. et al. Decreased expression of glutaredoxin 1 is required for transforming growth factor-beta1-mediated epithelial-mesenchymal transition of EpRas mammary epithelial cells. Biochem Biophys Res Commun 391, 1021–1027 (2010). [DOI] [PubMed] [Google Scholar]
- Qi J. et al. New Wnt/beta-catenin target genes promote experimental metastasis and migration of colorectal cancer cells through different signals. Gut, doi: 10.1136/gutjnl-2014-307900 (2015). [DOI] [PubMed] [Google Scholar]
- Ghahhari N. M. & Babashah S. Interplay between microRNAs and WNT/beta-catenin signalling pathway regulates epithelial-mesenchymal transition in cancer. Eur J Cancer 51, 1638–1649 (2015). [DOI] [PubMed] [Google Scholar]
- Gnemmi V. et al. MUC1 drives epithelial-mesenchymal transition in renal carcinoma through Wnt/beta-catenin pathway and interaction with SNAIL promoter. Cancer Lett 346, 225–236 (2014). [DOI] [PubMed] [Google Scholar]
- Hwangbo C. et al. Syntenin regulates TGF-beta1-induced Smad activation and the epithelial-to-mesenchymal transition by inhibiting caveolin-mediated TGF-beta type I receptor internalization. Oncogene, doi: 10.1038/onc.2015.100 (2015). [DOI] [PubMed] [Google Scholar]
- Kannan A. et al. Caveolin-1 promotes gastric cancer progression by up-regulating epithelial to mesenchymal transition by crosstalk of signalling mechanisms under hypoxic condition. Eur J Cancer 50, 204–215 (2014). [DOI] [PubMed] [Google Scholar]
- Gai X., Lu Z., Tu K., Liang Z. & Zheng X. Caveolin-1 is up-regulated by GLI1 and contributes to GLI1-driven EMT in hepatocellular carcinoma. PloS one 9, e84551 (2014). [DOI] [PMC free article] [PubMed] [Google Scholar]
- Chanvorachote P., Pongrakhananon V. & Halim H. Caveolin-1 regulates metastatic behaviors of anoikis resistant lung cancer cells. Mol Cell Biochem 399, 291–302 (2015). [DOI] [PubMed] [Google Scholar]
- Lu Y. et al. Nitric oxide inhibits hetero-adhesion of cancer cells to endothelial cells: restraining circulating tumor cells from initiating metastatic cascade. Sci Rep 4, 4344 (2014). [DOI] [PMC free article] [PubMed] [Google Scholar]
- Yu S. et al. Systems pharmacology of mifepristone (RU486) reveals its 47 hub targets and network: comprehensive analysis and pharmacological focus on FAK-Src-Paxillin complex. Sci Rep 5, 7830 (2015). [DOI] [PMC free article] [PubMed] [Google Scholar]
- Jiang Z. et al. Bioactivity-guided fast screen and identification of cancer metastasis chemopreventive components from raw extracts of Murraya exotica. J Pharm Biomed Anal 107, 341–345 (2015). [DOI] [PubMed] [Google Scholar]
- Nie J. et al. Comparative analysis of dynamic proteomic profiles between in vivo and in vitro produced mouse embryos during postimplantation period. J Proteome Res 12, 3843–3856 (2013). [DOI] [PubMed] [Google Scholar]
- Rubert J., Lacina O., Fauhl-Hassek C. & Hajslova J. Metabolic fingerprinting based on high-resolution tandem mass spectrometry: a reliable tool for wine authentication? Anal Bioanal Chem 406, 6791–6803 (2014). [DOI] [PubMed] [Google Scholar]
- Dahlquist K. D., Salomonis N., Vranizan K., Lawlor S. C. & Conklin B. R. GenMAPP, a new tool for viewing and analyzing microarray data on biological pathways. Nat Genet 31, 19–20 (2002). [DOI] [PubMed] [Google Scholar]