

Abstract
Aims/hypothesis
The paucity of information on the epigenetic barriers that are blocking reprogramming protocols, and on what makes a beta cell unique, has hampered efforts to develop novel beta cell sources. Here, we aimed to identify enhancers in pancreatic islets, to understand their developmental ontologies, and to identify enhancers unique to islets to increase our understanding of islet-specific gene expression.
Methods
We combined H3K4me1-based nucleosome predictions with pancreatic and duodenal homeobox 1 (PDX1), neurogenic differentiation 1 (NEUROD1), v-Maf musculoaponeurotic fibrosarcoma oncogene family, protein A (MAFA) and forkhead box A2 (FOXA2) occupancy data to identify enhancers in mouse islets.
Results
We identified 22,223 putative enhancer loci in in vivo mouse islets. Our validation experiments suggest that nearly half of these loci are active in regulating islet gene expression, with the remaining regions probably poised for activity. We showed that these loci have at least nine developmental ontologies, and that islet enhancers predominately acquire H3K4me1 during differentiation. We next discriminated 1,799 enhancers unique to islets and showed that these islet-specific enhancers have reduced association with annotated genes, and identified a subset that are instead associated with novel islet-specific long non-coding RNAs (lncRNAs).
Conclusions/interpretations
Our results indicate that genes with islet-specific expression and function tend to have enhancers devoid of histone methylation marks or, less often, that are bivalent or repressed, in embryonic stem cells and liver. Further, we identify a subset of enhancers unique to islets that are associated with novel islet-specific genes and lncRNAs. We anticipate that these data will facilitate the development of novel sources of functional beta cell mass.
Keywords: ChIP-seq, Enhancer, H3K4me1, lncRNA, Pancreas, Transcription factor
Introduction
Prevention of diabetes depends on maintaining beta cell mass and insulin-secretory capacity. For this reason, recent efforts have focused on finding ways of enhancing beta cell survival, preventing beta cell death, and stimulating replacement of beta cell mass. One strategy involves the reprogramming of embryonic stem cells (ESCs) or more abundant cell types, such as hepatocytes from the liver, which, like the pancreas, is derived from the foregut endoderm [1], into glucose-responsive insulin-secreting cells. However, such protocols often generate multihormonal cells, predominately produce alpha cells, or generate ‘beta cells’ that cannot match the insulin-secretory capacity of a native beta cell. In part, progress in developing better protocols is hampered by our lack of understanding of the regulatory networks that drive beta cell genesis and function, by our inability to assess how closely protocols recapitulate normal beta cell development, and by our limited awareness of the epigenetic barriers that are being encountered during reprogramming.
As enhancers largely govern tissue-specific gene expression [2], we anticipated that identifying enhancers in islets and analysing their chromatin states in ESCs, hepatocytes and islets would be of particular value for improving protocols for generating beta cells, and would provide novel insights into beta cell development and function. To date, enhancer loci have been detected genome-wide using transcription factor binding [3, 4] or histone modification enrichment data [2, 5], or by identifying regions of open chromatin [6, 7]. Although each of these approaches has specific benefits, they either suffer from a high rate of false positives or are unable to detect the majority of enhancers. We therefore sought to develop a novel combined approach to identifying enhancers that would take advantage of the benefits of each method, while mitigating their limitations.
For this, we combined nucleosome predictions based on histone H3 lysine-4 monomethylation (H3K4me1) enrichment data, which demarcates active and poised enhancer loci [8–11], with genome-wide occupancy data for pancreatic and duodenal homeobox 1 (PDX1), v-MAF musculoaponeurotic fibrosarcoma oncogene family, protein A (avian) (MAFA), neurogenic differentiation 1 (NEUROD1) and forkhead box A2 (FOXA2), which are critical regulators of beta cell development and function [12–15], to identify enhancers in in vivo mouse pancreatic islets. Using these data, we identified 22,223 putative enhancer loci. We then compared the chromatin states of these loci in ESCs and hepatocytes in order to assess their developmental ontologies and to begin to understand the types of epigenetic barriers faced by protocols using these cell types to generate beta cells. Finally, we identified enhancers unique to islets in the hope of gaining additional insight into the transcriptional networks that make beta cells different from other cell types.
Methods
Chromatin immunoprecipitation sequencing (ChIP-seq) and RNA sequencing (RNA-seq)
We performed ChIP-seq using antibodies to MAFA (Abcam, Toronto, ON, Canada) and NEUROD1 (Santa Cruz, Santa Cruz, CA, USA) using freshly isolated 8–10-week-old mouse islets, and to histone H3 lysine-9 trimethylation (H3K9me3) (Millipore, Billerica, MA, USA) and histone H3 lysine-27 trimethylation (H3K27me3) (Millipore) in islets and liver as previously described [8, 16]. RNA-seq was performed as previously described [17] using pooled islets from C57BL/6J mice with two replicates sequenced. For more information on mouse maintenance, islet isolations, ChIP-seq and RNA-seq, see electronic supplementary material (ESM) Methods. Data were deposited under GEO accession GSE30298.
Analysis of ChIP-seq datasets and detection of H3K4me1-marked nucleosome locations
Probabilistic inference for nucleosome positioning (PING) [18] was used to identify H3K4me1-marked nucleosome positions from sonicated H3K4me1 ChIP-seq data in pancreatic islets. Sequence reads from sonication-based ChIP-seq experiments for H3K4me1, histone H3 lysine-4 trimethylation (H3K4me3), H3K9me3 and H3K27me3 in ESCs, for H3K4me1 and H3K4me3 ChIP-seq experiments in islets and liver, and for PDX1 and FOXA2 in islets were obtained from previously generated data (ESM Table 1) [8, 19–25]. Reads were mapped and peaks identified as described in ESM Methods. Clustering of histone modification data was performed using the total read counts in 2 kb windows around locus midpoints.
Chromatin immunoprecipitation with quantitative PCR (ChIP-qPCR)
For ChIP-qPCR, we performed ChIP on cells using 3 μg of anti-H3K4me1 (Abcam), anti-histone H4 acetylation (H4ac) (Millipore), anti-E1A binding protein p300 (p300) (Santa Cruz), anti-histone H3-lysine 27 acetylation (H3K27ac) (Millipore), or rabbit IgG (Santa Cruz). DNA from triplicate ChIP experiments was obtained and amplified using an ABI Viia7 real-time PCR system (Applied Biosystems, Carlsbad, CA, USA) and SYBR Green Supermix (Applied Biosystems). The fold enrichment of each target site was calculated as 2−ΔCt between rabbit IgG and the immunoprecipitated samples. Primers were designed using Primer3. Primer sequences are available upon request.
Dual luciferase assays
We cloned selected loci from mouse islet DNA into pGL 4.23 (Promega, Madison, WI, USA). Cells were seeded in 96-well plates and co-transfected with 40 fmol pGL4-enhancer firefly and 0.7 fmol Renilla (pRL-TK; Promega) vectors using Lipofectamine 2000 (Life Technologies, Burlington, ON, Canada). Six replicate transfections were performed for each cell line. Cell lysates were prepared and analysed according to the manufacturer’s instructions using the Dual-Luciferase Reporter Assay System (Promega). Firefly values were normalised to Renilla. Activity was defined as 2SD (p<0.01) above the median activity of negative controls.
Identification of novel transcripts in islets
To identify novel transcripts expressed in islets, we performed de novo assembly of islet RNA-seq reads (ESM Methods) using Trans-ABySS [26]. Contigs were aligned to the NCBIM.37 reference genome, and alignments were annotated against Ensembl v64 genes. Contigs with alignments that did not overlap an annotated gene in this database were filtered (ESM Methods), and the coding potential of the remaining transcripts was determined using phylogenetic codon substitution frequency (PhyloCSF) [27] using an eight-way multispecies alignment. Transcripts with a PhyloCSF score below 100 were considered non-coding [28].
The expression (reads per kilobase per million mapped reads) of the contigs in the islet RNA-seq dataset and in 14 other tissues [25] (ESM Table 1) was calculated by determining the number of reads with a minimum quality score of 10 that overlapped each exon using SAMtools [29]. At least three reads had to overlap a contig in a library for it to be considered to be expressed.
qPCR validation of novel transcripts
RNA was isolated from adult tissues using Trizol (Life Technologies) and RNA purification columns. All primers were designed using Primer3Plus and spanned introns where possible; primer sequences are available on request. A Viia7 real-time PCR system (Applied Biosystems) and Fast SYBR Green Master Mix (Applied Biosystems) was used for all reactions. Triplicate cDNAs were obtained by reverse transcription of 1 μg total RNA from newly isolated tissue. A 10 ng amount of generated cDNA was used in each reaction, and all reactions were performed in triplicate. Obtained values were normalised to β-actin Ct values to determine the percentage abundance relative to β-actin in each sample.
Results
Genome-wide identification of putative enhancers in pancreatic islets
As a first step to identifying enhancers in mouse pancreatic islets, we identified in vivo locations of H3K4me1-enriched nucleosomes genome-wide [8, 18]. From this, using a strict definition of an enhancer and a stringent set of selection criteria chosen to minimise false-positive regions (ESM Methods and ESM Fig. 1a), we identified 16,835 putative enhancer loci. We identified additional loci using 13,770 PDX1-occupied and 6,176 FOXA2-occupied loci identified using previously generated ChIP-Seq data [8], as well as 3,638 MAFA-occupied and 6,568 NEUROD1-occupied loci using newly generated ChIP-seq data from mouse islets. Combining these data allowed us to identify 22,223 putative enhancer loci in in vivo islets flanked by H3K4me1-marked nucleosomes (ESM Fig. 1a, b and ESM Table 2).
To estimate the fraction of these loci that are active in regulating gene expression in islets, we first used ChIP-qPCR to assess enrichment levels of H4ac, H3K27ac and p300, which are all associated with active enhancers, at 32 loci representing a range of H3K4me1 enrichment and transcription factor occupancy levels. As defined, all of the regions were enriched for H3K4me1, while 32% of the regions were enriched for p300, 36% for H4ac, and 45% for H3K27ac (Fig. 1a, b). In total, 47% of the regions tested showed enrichment for one of these factors. Next, we assessed the ability of 20 different regions, independently selected using the same criteria as above, to drive luciferase reporter expression in HEK293 (kidney), Hepa1-6 (liver), mPAC (pancreatic ductal cells), αTC-1 (pancreatic alpha cells) and MIN6 (pancreatic beta cells) cell lines. Eleven (55%) of the regions showed enhancer activity in MIN6 cells, and eight of these had higher activity in MIN6 cells than in any other cell line, with the remaining three having similar or higher activity in αTC-1 cells (Fig. 1c), suggesting that the bulk of the loci identified are from beta cells. In addition, 25% of the identified enhancers were within ‘open chromatin’ in human islets as determined by FAIRE-seq [6] or DNaseI-seq [7] (ESM Fig. 2 and ESM Methods). This fraction is consistent with estimates for conserved regulatory loci between mice and humans [30, 31]. Given that 26 (50%) of the 52 enhancers assessed by ChIP-qPCR or luciferase analysis had characteristics of an active enhancer, we anticipate that roughly half of the identified loci are active enhancers, although further experiments would be required to determine the actual percentage of the identified loci that represent active enhancers compared with poised enhancers.
Fig. 1.
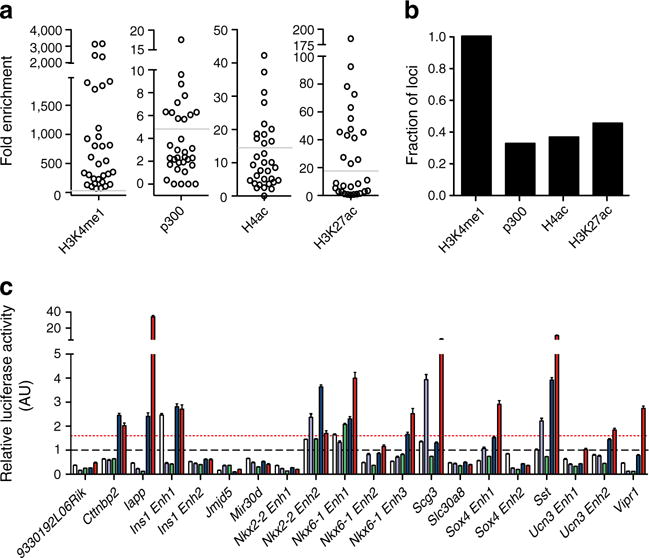
Identified loci have characteristics of functional enhancers. (a) Fold enrichment and (b) fraction of putative enhancer loci enriched for the indicated histone modifications and for p300 recruitment. The horizontal grey lines in (a) indicate the minimum fold enrichment needed for a locus to be considered enriched. (c) Relative luciferase activity levels (arbitrary units [AU]) of selected enhancer loci in HEK293 (white bars), Hepa1-6 (purple bars), mPAC (green bars), αTC-1 (blue bars) and MIN6 (red bars) cells. The black dashed line represents the mean relative luciferase activity of negative control regions in the cell lines, while the red dashed line indicates 2SD above this mean
Enhancer loci have distinct developmental ontologies
To determine the developmental ontologies of the enhancer regions, we compared the chromatin state of the 22,223 putative enhancers in ESCs, liver and islets using H3K4me1 and H3K4me3, which are associated with active cis-regulatory regions, and H3K9me3 and H3K27me3, which are associated with repressed chromatin [32, 33]. Using these marks allowed us to segregate the enhancers into four distinct chromatin states: poised or active (H3K4me1/me3-marked); bivalent (H3K4me1/me3- and H3K27me3-marked); repressed (H3K27me3-marked); and silent (no marks) (Fig. 2a). H3K9me3, on the other hand, had little discriminatory value. Clustering the enhancers on the basis of their chromatin states in ESCs, liver and islets identified enhancers with nine distinct developmental ontologies (e1–e9) (Fig. 2a, f). Unlike for promoters (ESM Fig. 3), the majority of the enhancers (~73%, clusters e3, e4, e6, e7 and e9) were enriched for H3K4me1 and/or H3K4me3 in islets and/or liver only, and were unmarked in ESCs. In contrast, ~12% of the loci were marked by H3K27me3 in ESCs (clusters e5, e6 and e8). Of these, enhancers in clusters e5 and e8 were actually marked bivalently by H3K4me1/me3 and H3K27me3 in ESCs, with enhancers in cluster e5 resolving to an active state in islets, and those in e8 maintaining a bivalent state. Overall, 62% of the chromatin state transitions identified at enhancers were due to the acquisition of H3K4me1/me3, while 6% of loci resolved from a bivalent state to an active state, 6% were altered from a repressive state to an active state, and 7% transitioned from a silent state to a bivalent state (Fig. 2b).
Fig. 2.
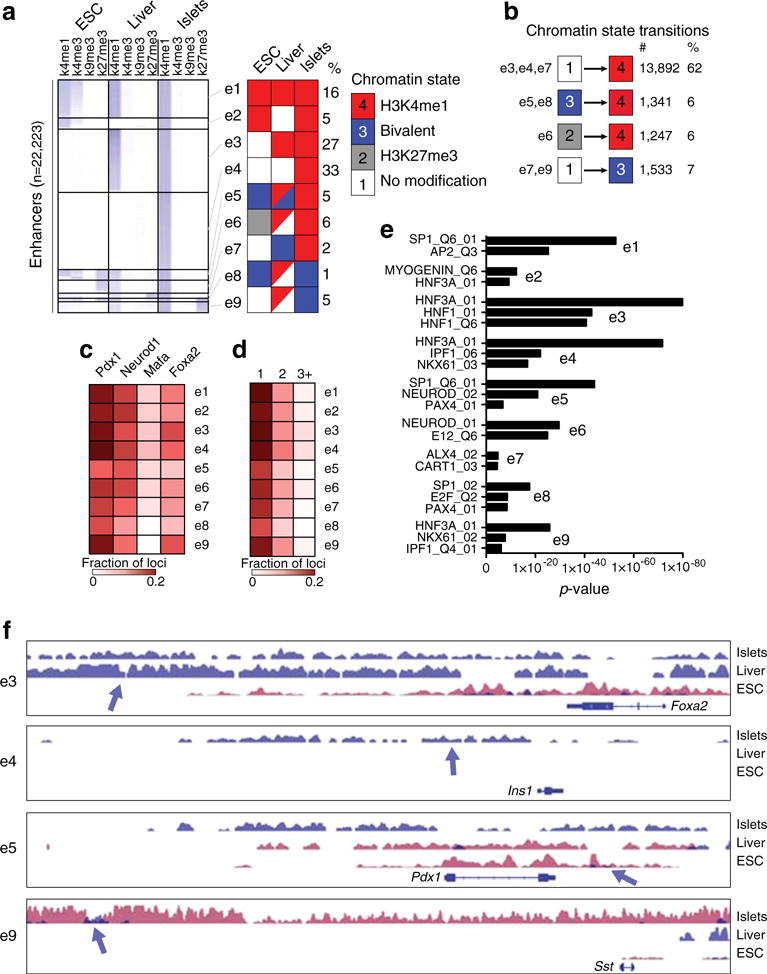
Identified putative enhancers in islets have distinct developmental ontologies. (a) Heatmap of the total read counts in ±1 kb regions around enhancer midpoints for H3K4me1, H3K4me3, H3K9me3 and H3K27me3 in ESCs, liver and islets. The data are segregated into enhancer clusters (e1–e9), and the chromatin state for each cluster is indicated in the schematic to the right of the heatmap. Squares composed of two triangles of different colours for clusters e5, e6, e8 and e9 indicate that these clusters have a mixed chromatin state. (b) The number and percentage of chromatin state transitions for the indicated enhancer clusters from ESCs to islets. (c, d) Heatmap of the fraction of enhancers in each enhancer cluster (c) occupied by PDX1, MAFA, NEUROD1 and FOXA2, or (d) single-, double-, triple- or quadruple-bound. (e) Enrichment p values of representative position weight matrices (PWMs) in the indicated enhancer clusters. (f) UCSC genome browser views of representative regions in the indicated enhancer clusters. H3K4me1 enrichment data are shown in blue, and H3K27me3 data in purple. All tracks are set to show a coverage depth range of 0 to 30. The arrows demarcate the identified putative enhancer loci
We next compared the frequency with which PDX1, MAFA, NEUROD1 and FOXA2 occupied the enhancers in the different clusters. In general, the enhancer clusters had similar occupancy frequencies (Fig. 2c, d), except for clusters e5 and e8, which had reduced occupancy levels compared with the other clusters (1.6-fold decrease, p<0.0001, Fisher’s exact test). On the other hand, when we compared the motifs enriched in the clusters (ESM Methods), we found that cluster e1, which was in an active state in ESCs, liver and islets, was highly enriched for motifs for widely produced transcription factors (Fig. 2e), while cluster e3, which was in an active state in liver and islets, was highly enriched for motifs for transcription factors produced in both islets and liver, and clusters e4, e5 and e6, which are predominately in an active state in islets only, were enriched for motifs for transcription factors produced in the islet lineage.
Enhancers with different developmental ontologies regulate genes with distinct attributes
To determine how the developmental ontologies of the enhancers affected the expression of the genes they regulate, we mapped the enhancers to the closest gene (±200 kb) with significant levels of histone modification enrichment (ESM Methods) [25]. We then used RNA-seq data to assess the expression of these genes in ESCs, liver and islets. As expected, genes tended to be more abundantly expressed in tissues in which their enhancers were in an active/poised state; for example, genes with enhancers in clusters e4, e5 and e6 were more abundant (p<0.001) in islets than in ESCs or liver (Fig. 3a). In contrast, genes tended to have lower expression in tissues in which their enhancers were bivalent or repressed; for example, clusters e8 and e9, which were bivalent in adult islets, both had reduced expression (p<0.05) in this tissue (Fig. 3a). The specificity to islets of the genes in each cluster, calculated using data from 203 mouse serial analysis of gene expression (SAGE) libraries [34, 35], showed a similar pattern (Fig. 3b, c). Genes with enhancers in clusters e1, e2, e3 and e5 tended to have a low to moderate specificity to islets. Genes with enhancers from cluster e4 or e6, which have islet-specific H3K4me1, had the highest levels of islet specificity (p<0.001). Meanwhile, genes with enhancers in clusters e8 and e9 had particularly low islet specificity (p<0.001). To further characterise the types of genes associated with enhancers in each cluster, we compared their enrichment of gene ontology (GO)/Kyoto Encyclopedia of Genes and Genomes (KEGG) terms. Genes with enhancers in clusters e4, e5 and e6 were enriched for terms relevant to pancreas development and beta cell function, such as ‘endocrine pancreas development’, ‘mature onset diabetes of the young’ and ‘insulin secretion’ (Fig. 3d), while genes in the other enhancer clusters were not enriched in such terms. Similar results were obtained mapping enhancers to the closest gene within ±100 kb (ESM Fig. 4), suggesting these results are insensitive to the mapping strategy used. We previously found that loci co-occupied by PDX1 and FOXA2 were more islet-specific than loci occupied by either one of these factors alone [8]. However, transcription factor co-occupancy is unlikely to explain the specificity differences found here, as clusters e4 and e6 did not have higher transcription factor co-occupancy levels than the other clusters (Fig. 2c, d), and cluster e5, which was enriched for genes with islet-specific function, was actually deprived of co-occupied loci.
Fig. 3.
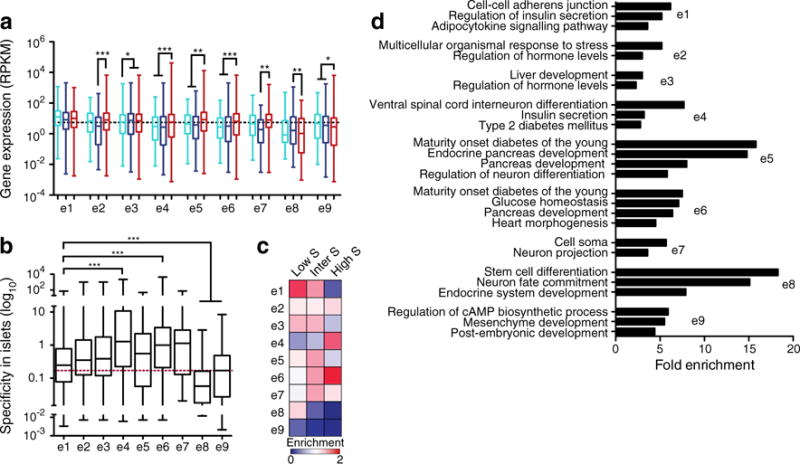
Association of enhancer clusters with genes. (a) Box–whisker plot of expression levels in ESCs (light blue), liver (dark blue) and islets (red) of genes with enhancers in the indicated enhancer clusters. RPKM, reads per kilobase per million mapped reads. (b) Box–whisker plot of the specificity to islets as calculated using 203 SAGE libraries from different mouse tissues [34, 35] for genes associated with enhancers in each enhancer cluster. The red dashed line indicates the median for all expressed genes. (c) Heatmap of the enrichment of genes with low, intermediate or high specificity to islets (S) associated with enhancers in each cluster, relative to random expectation. Darker blue is more deprived, while darker red is more enriched. (d) Fold enrichment of significantly enriched GO and KEGG terms for genes with enhancers in the indicated enhancer clusters. Statistically significant differences in (a) and (b) were detected using a Kruskal–Wallis non-parametric test with a Dunn’s multiple comparison correction; *p<0.05, **p<0.01, ***p<0.001
Identification of islet-specific enhancer (ISE) regions
Next, to identify enhancers unique to islets, we compared the H3K4me1 read density profiles of the putative enhancer loci in 19 other mouse tissues or cell lines (ESM Table 1). From this, we identified 1,799 loci with H3K4me1 enrichment unique to pancreatic islets (Fig. 4a, ESM Fig. 5 and ESM Table 2). Interestingly, genes associated with these ISEs were actually less abundantly expressed in islets (p<0.0001) than genes with non-specific enhancers (NSEs) (Fig. 4b). However, the mean specificity to islets was over 70-fold higher (p<0.0001) for genes with ISEs than for genes with NSEs (Fig. 4c), and over 10-fold higher (p<0.0001) than for genes with an enhancer in cluster e4. In confirmation, many of the genes with known islet-specific expression and important roles in islet function, such as Iapp, Ins1, Isl1, Nkx6-1, Rfx6, Slc30a8, Sox4 and Sst, all had associated ISEs. Further, genes associated with ISEs were highly enriched for GO/KEGG terms relevant to beta cell development and function compared with genes associated with NSEs (Fig. 4d). Together, these data suggest that these ISEs are highly associated with genes with islet-specific expression and function, and represent a unique resource for improving our understanding of islet-specific transcriptional networks.
Fig. 4.
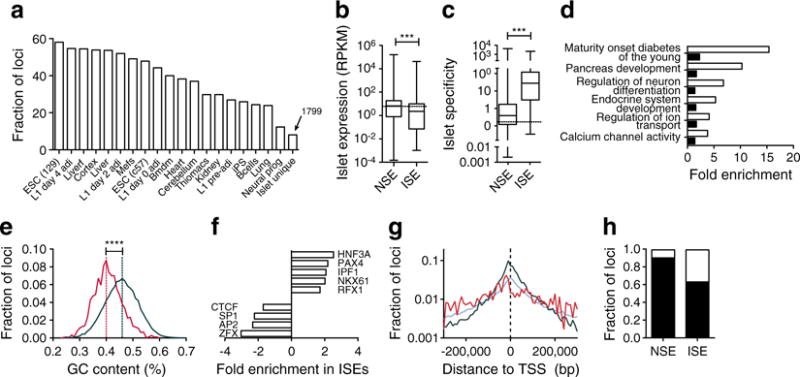
Identification of islet-specific putative enhancers. (a) The fraction of identified enhancer loci with H3K4me1 enrichment in 19 different mouse tissues or cell-types. ESC (129), ESCs from 129JAEC57/B6 mice; L1 day4 adi, 3T3-L1 cells 4 days after induction of adipogenesis; Liverf, Liver from 4f2a mice; L1 day2 adi, 3T3-L1 cells 2 days after induction of adipogenesis; Mefs, mouse embryonic fibroblasts; ESC (c57), ESCs from C57/B6 inbred mice; L1 day0 adi, 3T3-L1 cells on the day of induction of adipogenesis; Bmdm, bone marrow derived macrophages; Thiomacs, thioglycollate-elicited peritoneal macrophages; L1 pre-adi, 3T3-L1 cells 2 days before induction of adipogenesis; iPS, induced pluripotent stem cells; Bcells, resting splenic B cells; Neural prog, ESC-derived neural progenitors. Box–whisker plots of (b) expression level in islets (RNA-seq) and (c) specificity (SAGE) to islets of genes with associated ISEs or NSEs. The dashed line indicates the median of all expressed genes. Statistically significant differences were detected using a Kruskal–Wallis non-parametric test with a Dunn’s multiple comparison correction; ***p<0.001. RPKM, reads per kilobase per million mapped reads. (d) Fold enrichment of significantly enriched GO and KEGG terms for genes associated with ISE (white bars) and NSE (black bars) loci. (e) Frequency distribution of the GC content of DNA from ISEs (red) and NSEs (green). ****p<0.0001. (f) Fold enrichment of transcription factor binding motifs in ISEs relative to NSEs. (g) Distributions of the distance to the closest UCSC-known gene TSS within 200 kb for ISEs (red), NSEs (green) and random DNA (blue). (h) Fraction of loci that mapped (black) to Ensembl NCBMI.37 annotated transcripts or were not mappable (white) for ISEs and NSEs
To begin to determine why the identified ISEs obtained an active chromatin state uniquely in islets, we compared their underlying DNA sequence with NSEs. ISEs had a significantly lower (p<0.0001) average GC content than NSEs (Fig. 4e). In agreement, ISEs were enriched for HNF3-, PAX-, NKX-, RFX- and PDX1-like motifs (Fig. 4f and ESM Fig. 6, 7), which are A/T rich, and were specifically deprived in ZFX-, SP-, AP- and CTCF-like motifs, which are more G/C rich (ESM Methods). Comparing the spatial distributions of ISEs and NSEs, we observed that ISEs had a broader distribution around transcriptional start sites (TSSs), while NSEs were more often proximal to TSSs (Fig. 4g); in fact, the mean enhancer to TSS distance was over three times higher for ISEs than NSEs (p<0.0001). This resulted in significantly fewer ISEs than NSEs being mapped to known genes (p<0.0001) (Fig. 4h).
ISEs are associated with novel islet-specific transcripts
To determine whether the ISEs that we were unable to map to any known genes (Fig. 4h) might regulate novel transcripts, such as long non-coding RNAs (lncRNAs), we used Trans-ABySS [26] to perform de novo assembly of the islet RNA-seq reads. Trans-ABySS identified 2,498 transcripts that met our minimum read count and exon count thresholds (ESM Methods) and that had no annotation in the Ensembl, Refseq or University of California, Santa Cruz (UCSC) databases (ESM Table 3). The expression of these transcripts was significantly lower than for known protein-coding genes (p<0.0001), as previously reported for non-coding transcripts in other tissues [28]. These 2,498 transcripts represented 1,473 distinct loci, suggesting that some of the loci may generate multiple transcriptional variants, or that complete transcripts were not constructed by Trans-ABySS because of the low read counts associated with these transcripts [28, 36]. Some 92% of these transcripts were associated with H3K4me1/H3K4me3-enriched regions, and 78% could be associated with an identified islet enhancer, further suggesting their validity.
A total of 173 (26%) of the previously unmapped ISEs were associated with one of 118 different novel transcripts (Fig. 5a and ESM Table 4). None of these transcripts were predicted to have a PhyloCSF score indicative of their having protein-coding potential, nor did any of the predicted open reading frames encode a known protein domain [27, 28], suggesting that all of these 118 transcripts represent lncRNAs. To determine whether these lncRNAs are expressed specifically in islets, we assessed their expression in 14 other RNA-seq libraries (Fig. 5b). Eighty-nine (75%) of the lncRNAs were expressed either only in islets (66%) or more than twofold higher in islets than in any other tissue (9%). To validate these results, we used qPCR to assess the expression of 15 randomly selected transcripts in nine different tissues, including islets. Thirteen (87%) of the transcripts were significantly more abundant in islets than in any of the other tissues assessed (Fig. 5c). These data suggest that the majority of the identified lncRNAs that have an associated ISE are expressed in an islet-specific manner.
Fig. 5.
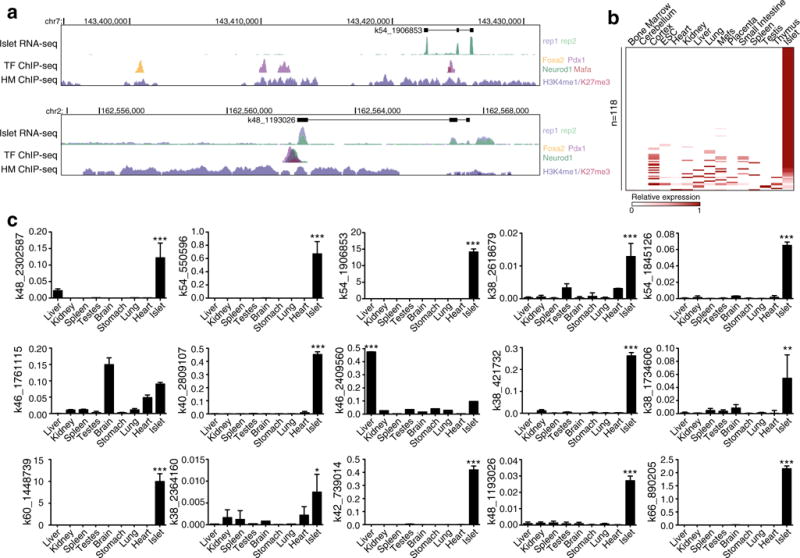
ISEs are associated with novel islet-specific lncRNAs. (a) UCSC mm9 genome browser views of representative novel transcripts with associated ISEs. The islet RNA-seq data from both replicates is overlaid in the first track below the novel transcripts. Below this is a track showing the transcription factor (TF) ChIP-seq data for PDX1 (purple), MAFA (red), NEUROD1 (green) and FOXA2 (yellow). The histone modification (HM) ChIP-seq data for H3K4me1 (purple) and H3K27me3 (red) is overlaid in the bottom track. Because no UCSC, Ensembl or Refseq genes are present within the regions, these tracks are not displayed. (b) Relative expression of identified lncRNAs with an associated ISE in islets compared with 14 other tissue types based on RNA-seq data. Darker red indicates higher relative reads per kilobase per million mapped reads (RPKM) counts. Mefs, mouse embryonic fibroblasts. (c) Relative expression (% of β-actin) of selected novel lncRNAs with associated ISEs in nine different tissues as determined by qPCR. Statistically significant differences were detected using a Kruskal–Wallis non-parametric test with a Dunn’s multiple comparison correction; *p<0.05, **p<0.01, ***p<0.001
Discussion
As enhancers are thought to be the primary regulators of tissue-specific gene expression [2, 9], we attempted to develop a compendium of in vivo enhancer elements in pancreatic islets. We subsequently sought to determine how the developmental ontologies of the enhancer loci might affect protocols for generating beta-like cells from ESCs and hepatocytes, and to identify enhancers associated with islet-specific transcriptional networks.
In an effort to mitigate the limitations of previous approaches to identifying enhancers genome-wide [2–7], we combined predictions of H3K4me1-marked nucleosomes with locations of PDX1, NEUROD1, MAFA and FOXA2 binding in vivo to identify enhancer regions in islets. This approach ensured that the loci identified were flanked by H3K4me1-marked nucleosomes, and were therefore both within open chromatin and in an appropriate chromatin state [9–11]. Despite this, it is possible that the identified loci could contain central unmarked nucleosomes [37], although such central nucleosomes would probably contain the histone variants, H3.3 and/or H2A.Z, that are common within regulatory regions [38]. Further, by using H3K4me1, rather than H3K27ac, which only marks active loci [21, 39], we were able to identify loci both in an active state and in a poised state that may become active under different physiological conditions. Meanwhile, including PDX1, NEUROD1, MAFA and FOXA2 occupancy data allowed us to identify additional loci lost because of the stringency of our selection criteria using H3K4me1-marked nucleosome-based predictions.
Despite the benefits of our approach, we note that the 22,223 loci identified here do not represent a fully comprehensive list of enhancers in islets, in part because the stringent criteria used probably eliminated many true enhancers. In addition, mouse islets are predominately composed of beta cells (~80%), and PDX1, MAFA and NEUROD1 are found only in beta cells in the adult, suggesting that the majority of loci identified here are probably beta cell enhancers, and enhancers from other islet cell types (alpha cells, delta cells, PP cells and epsilon cells) are probably largely not detected. Regardless, our data suggest that roughly 50% of the regions identified are active, a higher fraction than reported in other efforts to identify functional enhancers in HeLa cells using histone modification data (~36%) [2], or in islets using open chromatin (~33%) [7], validating the relative success of our approach. Thus, we think it likely that our list of putative enhancers in islets, while not exhaustive, is highly enriched in loci capable of acting as functional enhancer elements in beta cells, and should be of significant utility in generating novel biological insights.
Although previous efforts to identify cis-regulatory loci genome-wide in human islets have proven valuable [6, 7], these studies were unable to provide insight into the developmental ontologies of the loci. To begin to address this, we compared the chromatin states of the identified enhancers in islets with their chromatin states in ESCs, which can be used to infer the chromatin state of the loci before differentiation, and in liver, which, like the pancreas, develops from the foregut endoderm and thus can be used to infer whether a specific chromatin-state transition occurred before pancreas/liver specification. We found that enhancers in islets are generated through at least nine distinct developmental ontologies. Of these, we identified three ontologies associated with genes that have islet-specific expression and function. This included enhancers that uniquely obtained H3K4me1/H3K4me3 marks in islets, as well as those that were in a repressed state in ESCS, and those in a bivalent state in ESCs, but in an active state in islets. Our results agree with previous work indicating H3K27me3 prepatterns Pdx1 regulatory regions [40], and further show that genes for many of the transcription factors important in pancreas development, including Nkx2-2, Nkx6-1, Mafa and Mnx1, also have enhancers that were either bivalent or repressed in ESCs but in an active state in islets. Together, these results suggest that the primary epigenetic barriers faced in the conversion of ESCs and hepatocytes into beta-like cells are the appropriate recruitment of trithorax complexes, which can induce H3K4 methylation [41], and H3K27me3 demethylases, such as KDM1 lysine (K)-specific demethylase 6B (KDM6B, also known as JMJD3) [42], to islet-critical cis-regulatory regions.
To further define islet-specific transcriptional networks, we next discriminated 1,799 enhancers unique to islets using H3K4me1 data from 19 other cell or tissue types. We found that these enhancers have a reduced average GC content compared with NSEs, and were enriched for A/T-rich motifs for pancreas-specific transcription factors. Although we found ISEs associated with several known islet critical factors, we also found ISEs associated with many genes with as yet uncharacterised roles in beta cell function but which have islet-enriched expression, including genes involved in RNA splicing, cell adhesion and cytokine-mediated signalling. We further identified several ISEs associated with previously unknown islet-expressed lncRNAs. At least 75% of these lncRNAs were more abundantly expressed in islets than in any other tissue type, suggesting that they are also islet specific. Consistent with this, many lncRNAs are tissue specific [28], and are thought to play roles in regulating tissue-specific transcriptional networks or in establishing the chromatin state of tissue-specific regulatory regions [43]. The roles of these lncRNAs, and of the other genes identified with an associated ISE, in beta cell development and function will be of considerable future interest.
In summary, we identified 22,223 putative enhancer loci in pancreatic islets. We show that these loci have at least nine distinct developmental ontologies, and find that, in contrast with promoters, the majority of enhancers acquire H3K4me1 either specifically in islets or in a shared islet/liver multipotent progenitor. Our analysis of these regions clearly points to the importance of the coordinated, stage-specific action of histone methyltransferases and histone demethylases in establishing appropriate chromatin states at enhancers and promoters that regulate genes critical to pancreas specification and beta cell function. Further, we identify 1,799 of these loci as unique to islets, and show the utility of these data by using them to help identify novel islet-specific lncRNAs. We anticipate that our data will contribute towards ongoing efforts to understand beta cell development and function, and will facilitate the development of novel strategies for generating glucose-responsive, insulin-secreting cells.
Supplementary Material
Acknowledgments
The authors would like to acknowledge Canada’s Michael Smith Genome Sciences Centre’s (BCGSC) sequencing, bioinformatics and SAGE library construction teams, as well as P. Plettner (BCGSC) and A. He (BCGSC) for technical assistance, and J. Johnson (BCGSC) and A. Kotzer (Terry Fox Research Institute) for project management.
Funding M.A. Marra, P.A. Hoodless and S.J.M. Jones are Senior Scholars of the Michael Smith Foundation for Health Research. L. Li was supported by the Intramural Research Program of the NIH, National Institute of Environmental Health Sciences (Z01-ES-101765). R. Gottardo was supported by NIH grant HG005692. X. Zhang was supported by an NSERC-CGS fellowship. F.C. Lynn was supported by the Canadian Institutes for Health Research (MOP-102628 and RMF-111626) and the Juvenile Diabetes Research Foundation (2-2011-91). Funding was provided by Genome Canada, Genome British Columbia, the Child and Family Research Institute, the Juvenile Diabetes Research Foundation (5-2011-85), Common Wealth Insurance, the Canadian Institutes for Health Research (MOP-111010), and the Canucks for Kids Foundation, with infrastructure support provided by the British Columbia Cancer Foundation.
Abbreviations
- ChIP-qPCR
Chromatin immunoprecipitation with quantitative PCR
- ChIP-seq
Chromatin immunoprecipitation sequencing
- ESC
Embryonic stem cell
- FOXA2
Forkhead box A2
- GO
Gene ontology
- H3K4me1
Histone H3-lysine 4 monomethylation
- H3K4me3
Histone H3-lysine 4 trimethylation
- H3K9me3
Histone H3-lysine 9 trimethylation
- H3K27me3
Histone H3-lysine 27 trimethylation
- H3K27ac
Histone H3-lysine 27 acetylation
- ISE
Islet-specific enhancer
- KEGG
Kyoto Encyclopedia of Genes and Genomes
- lncRNA
Long non-coding RNA
- MAFA
v-Maf musculoaponeurotic fibrosarcoma oncogene family, protein A (avian)
- NEUROD1
Neurogenic differentiation 1
- NSE
Non-islet-specific enhancer
- PDX1
Pancreatic and duodenal homeobox 1
- PhyloCSF
Phylogenetic codon substitution frequency
- RNA-seq
RNA sequencing
- SAGE
Serial analysis of gene expression
- TSS
Transcriptional start site
- UCSC
University of California, Santa Cruz
Footnotes
Electronic supplementary material The online version of this article (doi:10.1007/s00125-012-2797-5) contains peer-reviewed but unedited supplementary material, which is available to authorised users.
Duality of interest
The authors declare that there is no duality of interest associated with this manuscript.
Contribution statement
BRT, MK, CJW, AK and BGH were involved in the acquisition and analysis of the ChIP-qPCR, qPCR and luciferase data. MB, PVS, FCL, MAM, SJMJ and BGH participated in acquisition of the ChIP-seq and/or RNA-seq data, while AGR, LL, XZ, NT, RC, KM and BGH performed the analysis and interpretation of the data. RG, MAM, SJMJ, PAH and BGH conceived and designed the experiments. BRT, AGR and BGH wrote the manuscript. MK, MB, CJW, PVS, AK, LL, XZ, NT, RC, KM, RG, MAM, FCL, SJMJ, and PAH provided critical revisions for important intellectual content. All authors approved the final version.
Contributor Information
B. R. Tennant, Child and Family Research Institute, British Columbia Children’s Hospital and Sunny Hill Health Centre, Room A4-185, 950 W28th Avenue, Vancouver, BC, Canada V5Z 4H4
A. G. Robertson, Canada’s Michael Smith Genome Sciences Centre, British Columbia Cancer Agency, Vancouver, BC, Canada
M. Kramer, Child and Family Research Institute, British Columbia Children’s Hospital and Sunny Hill Health Centre, Room A4-185, 950 W28th Avenue, Vancouver, BC, Canada V5Z 4H4
L. Li, Biostatistics Branch, National Institute of Environmental Health Sciences/NIH, Research Triangle Park, NC, USA
X. Zhang, Department of Statistics, University of British Columbia, Vancouver, BC, Canada
M. Beach, Child and Family Research Institute, British Columbia Children’s Hospital and Sunny Hill Health Centre, Room A4-185, 950 W28th Avenue, Vancouver, BC, Canada V5Z 4H4
N. Thiessen, Canada’s Michael Smith Genome Sciences Centre, British Columbia Cancer Agency, Vancouver, BC, Canada
R. Chiu, Canada’s Michael Smith Genome Sciences Centre, British Columbia Cancer Agency, Vancouver, BC, Canada
K. Mungall, Canada’s Michael Smith Genome Sciences Centre, British Columbia Cancer Agency, Vancouver, BC, Canada
C. J. Whiting, Child and Family Research Institute, British Columbia Children’s Hospital and Sunny Hill Health Centre, Room A4-185, 950 W28th Avenue, Vancouver, BC, Canada V5Z 4H4
P. V. Sabatini, Child and Family Research Institute, British Columbia Children’s Hospital and Sunny Hill Health Centre, Room A4-185, 950 W28th Avenue, Vancouver, BC, Canada V5Z 4H4
A. Kim, Child and Family Research Institute, British Columbia Children’s Hospital and Sunny Hill Health Centre, Room A4-185, 950 W28th Avenue, Vancouver, BC, Canada V5Z 4H4
R. Gottardo, Division of Public Health Sciences, Fred Hutchinson Cancer Research Center, Seattle, WA, USA
M. A. Marra, Canada’s Michael Smith Genome Sciences Centre, British Columbia Cancer Agency, Vancouver, BC, Canada Department of Medical Genetics, University of British Columbia, Vancouver, BC, Canada.
F. C. Lynn, Child and Family Research Institute, British Columbia Children’s Hospital and Sunny Hill Health Centre, Room A4-185, 950 W28th Avenue, Vancouver, BC, Canada V5Z 4H4 Department of Surgery, University of British Columbia, Vancouver, BC, Canada.
S. J. M. Jones, Canada’s Michael Smith Genome Sciences Centre, British Columbia Cancer Agency, Vancouver, BC, Canada Department of Medical Genetics, University of British Columbia, Vancouver, BC, Canada; Department of Molecular Biology and Biochemistry, Simon Fraser University, Vancouver, BC, Canada.
P. A. Hoodless, Department of Medical Genetics, University of British Columbia, Vancouver, BC, Canada Terry Fox Laboratory, British Columbia Cancer Agency, Vancouver, BC, Canada.
B. G. Hoffman, Email: brad.hoffman@ubc.ca, Child and Family Research Institute, British Columbia Children’s Hospital and Sunny Hill Health Centre, Room A4-185, 950 W28th Avenue, Vancouver, BC, Canada V5Z 4H4; Department of Surgery, University of British Columbia, Vancouver, BC, Canada.
References
- 1.Zaret KS. Genetic programming of liver and pancreas progenitors: lessons for stem-cell differentiation. Nat Rev Genet. 2008;9:329–340. doi: 10.1038/nrg2318. [DOI] [PubMed] [Google Scholar]
- 2.Heintzman N, Hon G, Hawkins R, et al. Histone modifications at human enhancers reflect global cell-type-specific gene expression. Nature. 2009;459:108–112. doi: 10.1038/nature07829. [DOI] [PMC free article] [PubMed] [Google Scholar]
- 3.Visel A, Blow MJ, Li Z, et al. ChIP-seq accurately predicts tissue-specific activity of enhancers. Nature. 2009;457:854–858. doi: 10.1038/nature07730. [DOI] [PMC free article] [PubMed] [Google Scholar]
- 4.Blow MJ, McCulley DJ, Li Z, et al. ChIP-Seq identification of weakly conserved heart enhancers. Nat Genet. 2010;42:806–810. doi: 10.1038/ng.650. [DOI] [PMC free article] [PubMed] [Google Scholar]
- 5.Akhtar-Zaidi B, Cowper-Sal-lari R, Corradin O, et al. Epigenomic enhancer profiling defines a signature of colon cancer. Science. 2012;336:736–739. doi: 10.1126/science.1217277. [DOI] [PMC free article] [PubMed] [Google Scholar]
- 6.Gaulton KJ, Nammo T, Pasquali L, et al. A map of open chromatin in human pancreatic islets. Nat Genet. 2010;42:255–259. doi: 10.1038/ng.530. [DOI] [PMC free article] [PubMed] [Google Scholar]
- 7.Stitzel ML, Sethupathy P, Pearson DS, et al. Global epigenomic analysis of primary human pancreatic islets provides insights into type 2 diabetes susceptibility loci. Cell Metab. 2010;12:443–455. doi: 10.1016/j.cmet.2010.09.012. [DOI] [PMC free article] [PubMed] [Google Scholar]
- 8.Hoffman BG, Robertson G, Zavaglia B, et al. Locus co-occupancy, nucleosome positioning, and H3K4me1 regulate the functionality of FOXA2-, HNF4A-, and PDX1-bound loci in islets and liver. Genome Res. 2010;20:1037–1051. doi: 10.1101/gr.104356.109. [DOI] [PMC free article] [PubMed] [Google Scholar]
- 9.Ernst J, Kheradpour P, Mikkelsen TS, et al. Mapping and analysis of chromatin state dynamics in nine human cell types. Nature. 2011;473:43–49. doi: 10.1038/nature09906. [DOI] [PMC free article] [PubMed] [Google Scholar]
- 10.Taberlay PC, Kelly TK, Liu CC, et al. Polycomb-repressed genes have permissive enhancers that initiate reprogramming. Cell. 2011;147:1283–1294. doi: 10.1016/j.cell.2011.10.040. [DOI] [PMC free article] [PubMed] [Google Scholar]
- 11.Bonn S, Zinzen RP, Girardot C, et al. Tissue-specific analysis of chromatin state identifies temporal signatures of enhancer activity during embryonic development. Nat Genet. 2012;44:148–156. doi: 10.1038/ng.1064. [DOI] [PubMed] [Google Scholar]
- 12.Ahlgren U, Jonsson J, Jonsson L, Simu K, Edlund H. Beta-cell-specific inactivation of the mouse Ipf1/Pdx1 gene results in loss of the beta-cell phenotype and maturity onset diabetes. Genes Dev. 1998;12:1763–1768. doi: 10.1101/gad.12.12.1763. [DOI] [PMC free article] [PubMed] [Google Scholar]
- 13.Gao N, White P, Doliba N, Golson ML, Matschinsky FM, Kaestner KH. Foxa2 controls vesicle docking and insulin secretion in mature beta cells. Cell Metab. 2007;6:267–279. doi: 10.1016/j.cmet.2007.08.015. [DOI] [PubMed] [Google Scholar]
- 14.Gu C, Stein GH, Pan N, et al. Pancreatic beta cells require NeuroD to achieve and maintain functional maturity. Cell Metab. 2010;11:298–310. doi: 10.1016/j.cmet.2010.03.006. [DOI] [PMC free article] [PubMed] [Google Scholar]
- 15.Matsuoka T-A, Artner I, Henderson E, Means A, Sander M, Stein R. The MafA transcription factor appears to be responsible for tissue-specific expression of insulin. Proc Natl Acad Sci U S A. 2004;101:2930–2933. doi: 10.1073/pnas.0306233101. [DOI] [PMC free article] [PubMed] [Google Scholar]
- 16.Wederell E, Bilenky M, Cullum R, et al. Global analysis of in vivo Foxa2-binding sites in mouse adult liver using massively parallel sequencing. Nucleic Acids Res. 2008;36:4549–4564. doi: 10.1093/nar/gkn382. [DOI] [PMC free article] [PubMed] [Google Scholar]
- 17.Kim H, Toyofuku Y, Lynn FC, et al. Serotonin regulates pancreatic beta cell mass during pregnancy. Nat Med. 2010;16:804–808. doi: 10.1038/nm.2173. [DOI] [PMC free article] [PubMed] [Google Scholar]
- 18.Zhang X, Robertson AG, Woo S, Hoffman BG, Gottardo R. Probabilistic inference for nucleosome positioning with MNase-based or sonicated short-read data. PLoS One. 2012;7:e32095. doi: 10.1371/journal.pone.0032095. [DOI] [PMC free article] [PubMed] [Google Scholar]
- 19.Meissner A, Mikkelsen TS, Gu H, et al. Genome-scale DNA methylation maps of pluripotent and differentiated cells. Nature. 2008;454:766–770. doi: 10.1038/nature07107. [DOI] [PMC free article] [PubMed] [Google Scholar]
- 20.Heinz S, Benner C, Spann N, et al. Simple combinations of lineage-determining transcription factors prime cis-regulatory elements required for macrophage and B cell identities. Mol Cell. 2010;38:576–589. doi: 10.1016/j.molcel.2010.05.004. [DOI] [PMC free article] [PubMed] [Google Scholar]
- 21.Creyghton MP, Cheng AW, Welstead GG, et al. Histone H3K27ac separates active from poised enhancers and predicts developmental state. Proc Natl Acad Sci USA. 2010;107:21931–21936. doi: 10.1073/pnas.1016071107. [DOI] [PMC free article] [PubMed] [Google Scholar]
- 22.Mikkelsen TS, Xu Z, Zhang X, et al. Comparative epigenomic analysis of murine and human adipogenesis. Cell. 2010;143:156–169. doi: 10.1016/j.cell.2010.09.006. [DOI] [PMC free article] [PubMed] [Google Scholar]
- 23.Robertson A, Bilenky M, Tam A, et al. Genome wide relationship between histone H3 lysine 4 mono- and tri-methylation and transcription factor binding. Genome Res. 2008;18:1906–1917. doi: 10.1101/gr.078519.108. [DOI] [PMC free article] [PubMed] [Google Scholar]
- 24.Goldberg AD, Banaszynski LA, Noh K-M, et al. Distinct factors control histone variant H3.3 localization at specific genomic regions. Cell. 2010;140:678–691. doi: 10.1016/j.cell.2010.01.003. [DOI] [PMC free article] [PubMed] [Google Scholar]
- 25.Shen Y, Yue F, McCleary D, et al. A map of the cis-regulatory sequences in the mouse genome. Nature. 2012;488:116–120. doi: 10.1038/nature11243. [DOI] [PMC free article] [PubMed] [Google Scholar]
- 26.Robertson G, Schein J, Chiu R, et al. De novo assembly and analysis of RNA-seq data. Nat Meth. 2010;7:909–912. doi: 10.1038/nmeth.1517. [DOI] [PubMed] [Google Scholar]
- 27.Lin MF, Jungreis I, Kellis M. PhyloCSF: a comparative genomics method to distinguish protein coding and non-coding regions. Bioinformatics. 2011;27:i275–i282. doi: 10.1093/bioinformatics/btr209. [DOI] [PMC free article] [PubMed] [Google Scholar]
- 28.Cabili MN, Trapnell C, Goff L, et al. Integrative annotation of human large intergenic noncoding RNAs reveals global properties and specific subclasses. Genes Dev. 2011;25:1915–1927. doi: 10.1101/gad.17446611. [DOI] [PMC free article] [PubMed] [Google Scholar]
- 29.Li H, Handsaker B, Wysoker A, et al. The sequence alignment/map format and SAMtools. Bioinformatics. 2009;25:2078–2079. doi: 10.1093/bioinformatics/btp352. [DOI] [PMC free article] [PubMed] [Google Scholar]
- 30.Schmidt D, Wilson M, Ballester B, et al. Five-vertebrate ChIP-seq reveals the evolutionary dynamics of transcription factor binding. Science. 2010;328:1036–1040. doi: 10.1126/science.1186176. [DOI] [PMC free article] [PubMed] [Google Scholar]
- 31.Odom DT, Dowell RD, Jacobsen ES, et al. Tissue-specific transcriptional regulation has diverged significantly between human and mouse. Nat Genet. 2007;39:730–732. doi: 10.1038/ng2047. [DOI] [PMC free article] [PubMed] [Google Scholar]
- 32.Wang Z, Zang C, Rosenfeld J, et al. Combinatorial patterns of histone acetylations and methylations in the human genome. Nat Genet. 2008;40:897–903. doi: 10.1038/ng.154. [DOI] [PMC free article] [PubMed] [Google Scholar]
- 33.Pauler F, Sloane M, Huang R, et al. H3K27me3 forms BLOCs over silent genes and intergenic regions and specifies a histone banding pattern on a mouse autosomal chromosome. Genome Res. 2009;19:221–233. doi: 10.1101/gr.080861.108. [DOI] [PMC free article] [PubMed] [Google Scholar]
- 34.Hoffman BG, Zavaglia B, Witzsche J, et al. Identification of transcripts with enriched expression in the developing and adult pancreas. Genome Biol. 2008;9:R99. doi: 10.1186/gb-2008-9-6-r99. [DOI] [PMC free article] [PubMed] [Google Scholar]
- 35.Siddiqui AS, Khattra J, Delaney AD, et al. A mouse atlas of gene expression: large-scale digital gene-expression profiles from precisely defined developing C57BL/6J mouse tissues and cells. Proc Natl Acad Sci USA. 2005;102:18485–18490. doi: 10.1073/pnas.0509455102. [DOI] [PMC free article] [PubMed] [Google Scholar]
- 36.Garber M, Grabherr MG, Guttman M, Trapnell C. Computational methods for transcriptome annotation and quantification using RNA-seq. Nat Meth. 2011;8:469–477. doi: 10.1038/nmeth.1613. [DOI] [PubMed] [Google Scholar]
- 37.Li Z, Schug J, Tuteja G, White P, Kaestner KH. The nucleosome map of the mammalian liver. Nat Struct Mol Biol. 2011;18:742–746. doi: 10.1038/nsmb.2060. [DOI] [PMC free article] [PubMed] [Google Scholar]
- 38.Jin C, Zang C, Wei G, et al. H3.3/H2A.Z double variant-containing nucleosomes mark ‘nucleosome-free regions’ of active promoters and other regulatory regions. Nat Genet. 2009;41:941–945. doi: 10.1038/ng.409. [DOI] [PMC free article] [PubMed] [Google Scholar]
- 39.Rada-Iglesias A, Bajpai R, Swigut T, Brugmann SA, Flynn RA, Wysocka J. A unique chromatin signature uncovers early developmental enhancers in humans. Nature. 2010;470:279–283. doi: 10.1038/nature09692. [DOI] [PMC free article] [PubMed] [Google Scholar]
- 40.Xu CR, Cole PA, Meyers DJ, Kormish J, Dent S, Zaret KS. Chromatin “prepattern” and histone modifiers in a fate choice for liver and pancreas. Science. 2011;332:963–966. doi: 10.1126/science.1202845. [DOI] [PMC free article] [PubMed] [Google Scholar]
- 41.Schuettengruber B, Chourrout D, Vervoort M, Leblanc B, Cavalli G. Genome regulation by polycomb and trithorax proteins. Cell. 2007;128:735–745. doi: 10.1016/j.cell.2007.02.009. [DOI] [PubMed] [Google Scholar]
- 42.Agger K, Cloos PA, Christensen J, et al. UTX and JMJD3 are histone H3K27 demethylases involved in HOX gene regulation and development. Nature. 2007;449:731–734. doi: 10.1038/nature06145. [DOI] [PubMed] [Google Scholar]
- 43.Wang KC, Chang HY. Molecular mechanisms of long non-coding RNAs. Mol Cell. 2011;43:904–914. doi: 10.1016/j.molcel.2011.08.018. [DOI] [PMC free article] [PubMed] [Google Scholar]
Associated Data
This section collects any data citations, data availability statements, or supplementary materials included in this article.