

Abstract
Background:
With a possible increase in the prevalence of type 1 diabetes mellitus (DM1), the pediatric patient population is expected to be at risk for other health care complications. Current imaging modalities, such as the spectral domain optical coherence tomography (SD-OCT), that allow micron resolution imaging of the retina have become a standard of care for showing morphological changes seen in the retina in adults with diabetes. Such pathologies can be associated with known risk factors such as poor glycemic control (HbA1C) and body mass index (BMI).
Methods:
A comprehensive screening was performed in subjects with DM1 including nonmydriatic fundus imaging (Canon, CR2 Plus-AF with EOS-60D, Tokyo, Japan) and SD-OCT imaging (Optovue, iVue, Fremont, CA). SD-OCT scans were acquired showing macular thickness (MT) and thickness of the parafoveal regions and the perifoveal regions. Associations of macular, paramacular, and perimacular thickness were analyzed as a function of HbA1C and BMI by simple linear regressions.
Results:
SD-OCT changes were analyzed in eyes of subjects with DM1 and normal fundus appearance by color imaging. Linear regression analysis of thickness of macula right eye (RT), paramacula RT, paramacula left eye (LT), perimacula LT with BMI were statistically significant (P < .05). HbA1C >7.5% was also found statistically significant in the macula RT, paramacula RT, paramacula LT, perimacula RT, and perimacula LT. A general trend of thickening of the macula, paramacula, and perimacula was observed with increasing HbA1C (>7.5%) and increasing BMI; however, no statistical significance was found.
Conclusions:
SD-OCT with retinal imaging was feasible in young individuals with DM1 and revealed ultrastructural macular and perimacular changes prior to manifest clinical disease.
Keywords: diabetes, imaging methods, optical coherence tomography, macula/fovea
Diabetes mellitus type 1 (DM1) is a metabolic disorder affecting 2 per 1000 school-aged children in the United States.1 With a possible increase in the prevalence of DM1, the pediatric patient population is expected to be at risk for other health care complications. Diabetic retinopathy (DR) is the leading complication and cause of blindness in the pediatric population with DM1. The presence of DR has been gradually increasing with a prevalence of 10% to 30% contingent on the study.2 In patients with DM1 younger than 30 years of age, The American Academy of Ophthalmology recommends annual screenings between 3 to 5 years post–diagnosis of disease.3 The greatest impact on this disease comes from early detection.
According to numerous published studies, the use of telemedicine has proved its role as a valid method in diagnosing ocular pathologies.4 Current imaging modalities, such as spectral domain optical coherence tomography (SD-OCT), have shown morphological changes seen in the retina prior to the loss of visual acuity in the diabetic eye.5,6 Such pathologies can be associated with known risk factors such as poor glycemic control (HbA1C) and body mass index (BMI).7
SD-OCT with a resolution of about 5 microns has become a state-of-art technique in the evaluation of diabetic pathology and changes in retinal thickness in a way not possible prior to OCT. It is a noninvasive, noncontact imaging system capable of generating high-resolution optical cross sections of the retina, such as the retinal nerve fiber layer, optic nerve head, macular area, and structural changes seen in retinopathy.8 Through a single axial scan, the SD-OCT generates its information by assessing the frequency spectrum of the interference between the stationary reference mirror and the reflected light. With the ability to acquire images in seconds, the SD-OCT provides not only quicker acquisition times, but an increase in the amount of data generated during a single scan.
The benefits of such modalities have been assessed in the eyes of adults and few studies have been conducted in the pediatric population. The purpose of this study was to analyze SD-OCT findings in individuals with DM1 with a normal fundus examination as documented on color imaging at the International Conference for Children with DM1. (http://www.childrenwithdiabetes.com).
Methods
Study Participants
This was a prospective pilot-imaging study. Recruitment of DM1 patients was conducted at the annual Friends for Life, Children with Diabetes, Inc conference located in Orlando, Florida, between July 1 and July 6, 2014. The study was approved by the Rutgers New Jersey Medical School Institutional Review Board (IRB) and was HIPAA compliant.
The purpose of the Friends for Life conference is to provide individuals with DM1 and their families with the most advanced knowledge in diabetes care.9 In addition to educational and support sessions, children and their families are offered tele-retinal screenings by the telemedicine team of the Institute of Ophthalmology and Visual Science of Rutgers New Jersey Medical School.
The screening program was divided into a morning and afternoon session, in which children and their family members were given appointments based on 15-minute time intervals. Inclusion criteria for imaging was a self-reported diagnosis of DM1 and an age of 30 years or younger. Exclusion criteria consisted of the inability to image participant, poor image quality (Scan Quality Index < 65) and/or an adult onset diabetic. The participants were divided into the following 3 age groups: 6 to 8 years, 9 to 14 years, and 15 to 30 years. The division into age groups provided for improved cooperation among the participants. Once the screening protocol was explained in full detail, informed consent was obtained from all participants.
A comprehensive description of the adult protocol used in our screenings has been previously published.10 In summary, the screening consisted of (1) 2 medical students who measured blood pressure, intraocular pressures, and assessed visual acuity and calculated BMI based on a provided data intake form, which included age, sex, onset of diabetes, duration of DM1, ethnicity, date since last eye examination, insulin pump/sensor use, personal and family history of ocular and medical problems, and so on; (2) an imaging professional who conducted nonmydriatic fundus imaging (Canon, CR2 Plus-AF with EOS-60D, Tokyo, Japan) and SD-OCT (Optovue, iVue, Freemont, California); and (3) an on-site medical director who performed analysis of the screening data and images, informed participants and families of results, and referred for follow-ups when appropriate. Visual acuity was analyzed using the Snellen visual acuity scale. Participants who presented with a normal fundus examination were included in this analysis. All imaging was performed with no need for pupil dilation. Collected data were inputted on a computer.
SD-OCT Procedure: Specifics of Procedure
The iVue SD-OCT scans provided cross-sectional imaging of the retina in the horizontal and vertical axis without the use of pupil dilation with mydriatic agents. Participants were told to maintain a fixated gaze on a central target as the iVue software automatically located the fovea. Scans with a resolution of 5 microns were acquired measuring ultra structural thickness of retinal tissue in the macula, paramacula (inner concentric ring just outside the macula), and perimacula (a second concentric ring outside the paramacular) regions (Figure 1).
Figure 1.

Spectral domain optical coherence tomography of right eye of participant with type 1 diabetes mellitus. No evidence of diabetic retinopathy.
The iWellness is used as an initial scan that includes a 7 × 7 mm map scan centered on macular region (1 mm temporal to fovea) and allowing for acquisition of a single scan by including macula values, optic nerve with nerve fiber layer, as well as ganglion cell complex thickness, in lieu of the 3 scans necessary prior to development of this setting.
Each scan generated a horizontal followed by 17 vertical B scans (a total of 18 scans) at 0.5 mm intervals with an acquisition time of approximately 2 seconds. However, the horizontal scan was not used in the measurement scheme. These cross-sectional images of the retina were used to create a 7 × 7 mm retinal thickness map with a measurement circle overlay consisting of 9 zones that included a 1 mm central zone (centered on the fovea) surrounded by 3 mm (paramacular) and 5 mm (perimacular) diameter circles that are further divided into quadrants (superior, inferior, nasal, and temporal) (Figure 2). A 5 mm diameter Early Treatment of Diabetic Retinopathy Study (ETDRS)-like zone was the basis for the measure of retinal thickness; which is characterized as the difference between the outer-retina interface of the retinal pigment epithelium and the vitreoretinal interface.7
Figure 2.
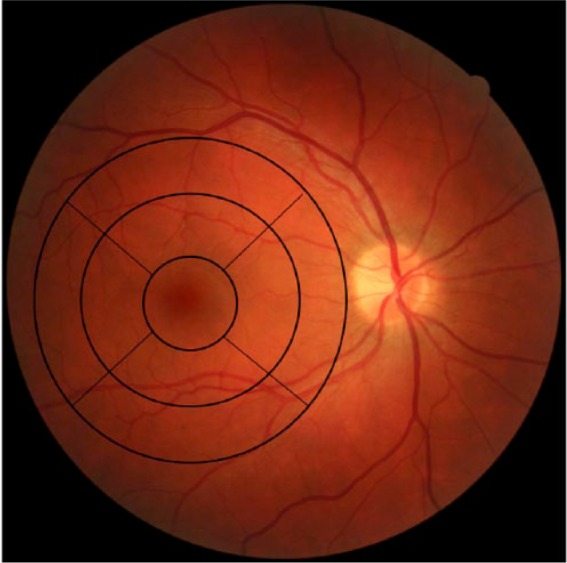
Base-line DM1 right eye without retinopathy demonstrating a thickness map with a measurement circle overlay consisting of 9 zones.
Statistical Analysis
Statistical analyses were performed utilizing StatPlus for Microsoft Excel 14.4.1. Descriptive analyses are included as means ± SE. Simple linear regressions measured macula, paramacula, and perimacula thickness of both eyes (right, left), and the thickness values were analyzed as a function of clinical covariates, HbA1C, and BMI. A probability (P) value < .05 was considered statistically significant.
Results
Of the 132 participants who presented to the screening, 109 (83%) met the inclusion criteria and were included in the analysis. With a range of 5-30 years, the mean age was 14 years, 56% were females, and 79% were Caucasians. Duration and HbA1C were self-reported, with a mean of 7.8 years (range 0.4 to 25 years) and 7.9%, respectively. Visual acuity was 20/20 for 57% of the right eye and 61% for the left eye. Table 1 provides clinical characteristics and demographics of the screened population. For each participant, each eye was imaged. None of the participants were found to have proliferative DR, incidental findings, or other retinal diseases.
Table 1.
Screening Participants’ Demographics and Clinical Characteristics.
| Characteristic | Number |
|---|---|
| Age (years) | |
| Mean | 14 |
| Range | 5-30 |
| Gender | |
| Male/female | 44%/56% |
| Race | |
| White | 79% |
| Other | 21% |
| Duration of DMI (years) | |
| Mean | 7.8 |
| Range | 0.4-25 |
| HbA1C | |
| Mean | 7.9% |
| Visual acuity | |
| Right 20/20 | 57% |
| Left 20/20 | 61% |
SD-OCT measured the thickness in the macula, paramacula, and perimacula regions. Linear regression analyses of macula, paramacula, and perimacula thickness in both eyes were assessed in relation to the clinical covariates (HbA1C and BMI). Thicknesses for macula RT, paramacula RT, paramacula LT, perimacula RT with BMI were statistically significant (P < .05). HbA1C > 7.5% was also found statistically significant in the macula LT, paramacula RT, paramacula LT, perimacula RT, and perimacula LT (Table 2). A general trend of thickening of the macula, paramacula, and perimacula was observed with increasing HbA1C (>7.5%) and increasing BMI; however, no statistical significance was found (Table 3).
Table 2.
Significance of HbA1C > 7.5% and BMI in the 3 Age Groups.
| n | Variable | 2-tailed P value | R2 | |
|---|---|---|---|---|
| 6-8 years | ||||
| Macthick RT | 33 | BMI | .03165 | .41775 |
| Paramacula RT | BM | .02895 | .42808 | |
| Paramacula LT | BMI | .03953 | .47663 | |
| 9-14 years | ||||
| Macthick LT | 42 | A1C > 7.5 | .03067 | .18017 |
| Paramacula LT | A1C > 7.5 | .02472 | .19305 | |
| Perimacula LT | A1C > 7.5 | .04557 | .15635 | |
| 15-30 years | ||||
| Macthick RT | 34 | BMI | .04004 | .09443 |
| Paramacula RT | A1C > 7.5 | .03129 | .18613 | |
| Paramacula RT | BMI | .0055 | .16579 | |
| Perimacula RT | A1C > 7.5 | .01625 | .22625 | |
| Perimacula RT | BMI | .03309 | .10132 | |
Table 3.
General Trend of Thickening of the Macula, Paramacula, and Perimacula Observed With Increasing HbA1C (>7.5%) and Increasing BMI.
| Mean A1C/BMI | Macthick RT | Macthick LT | Para RT | Para LT | Peri RT | Peri LT | |
|---|---|---|---|---|---|---|---|
| 6-8 years | |||||||
| A1C > 7.5 | 8.096 | 243.708 | 251.753 | 303.419 | 301.958 | 282.424 | 282.024 |
| BMI | 15.755 | 239.231 | 241.859 | 306.724 | 300.813 | 286.328 | 285.025 |
| 9-14 years | |||||||
| A1C > 7.5 | 8.439 | 243.708 | 253.986 | 320.043 | 313.538 | 292.689 | 289.073 |
| BMI | 20.204 | 259.018 | 256.954 | 316.797 | 316.242 | 289.898 | 290.604 |
| 15-30 years | |||||||
| A1C > 7.5 | 8.7100 | 256.723 | 258.850 | 316.157 | 313.286 | 292.218 | 289.691 |
| BMI | 26.209 | 256.609 | 258.745 | 315.148 | 313.983 | 289.818 | 289.098 |
Discussion
The implementation of newer imaging modalities has supplemented traditional forms of examination and diagnostic testing in patients with DM1 and preclinical diseases. The American Academy of Ophthalmology recommends annual screenings between 3 and 5 years post–onset of disease for patients less than 30 years of age.3 These recommendations date back to the “pre-OCT” era. Based on the abilities of OCT, it has become a standard-of-care test in adults with diabetes and retinal disease. In view of the possible blinding complications of DM1, the growing incidence of ocular manifestations of DM1, and the advancement in noninvasive imaging technologies; we believe the younger population may benefit from an earlier and more frequent recommendation of in-depth retinal imaging that includes an OCT.
The Early Treatment of Diabetic Retinopathy Study supports the need for early evaluation and treatment for a common and often asymptomatic manifestation of DM1: proliferative DR.11 This ocular complication of DM1 is a micro vascular disease that is capable of producing irreversible blindness.12,13 The Wisconsin Epidemiologic Study of Diabetic Retinopathy reported 3.6% of DM1 patients suffering from legal blindness.14
Treatment for DR begins only after a patient presents with decreased visual acuity or with the appearance of abnormalities in the vasculature. It is only after diagnosis, that laser therapy, or antivascular endothelial growth factors are used to prevent further loss of existing vision.7
In comparison to the above-mentioned studies which focused on treatments after diagnosis, our study (1) focused primarily on SD-OCT findings in the pediatric DM1 population with a normal fundus exam (not done before), (2) used an SD-OCT with the ability to generate 17 vertical B scans with an acquisition time of less than 2 seconds, and (3) included a more comprehensive assessment of patient overall health status (blood pressure, A1C, BMI) in addition to visual acuity. SD-OCT is a noninvasive imaging study that does not require pupil dilation and has the potential benefit to detect early or preclinical stages of DR prior to their appearance on fundus examination or color imaging.15-17
Poor metabolic control of diabetes mellitus poses the highest risk for DR that can manifest as changes in the vasculature and in the retinal thickness of these patients (Figure 3).18 In our study, we completed linear regression analyses of macula, paramacula and perimacula thicknesses in both eyes in relation to the participants’ HbA1C and BMI values. The Meta-analysis for Eye Disease study supports our analysis of childhood obesity (higher BMI) and poor glycemic control (measured by HbA1C levels) as contributing risk factors in the development of DR.19, Dirani et al found a 3-fold increase in DR prevalence in obese patients.20
Figure 3.
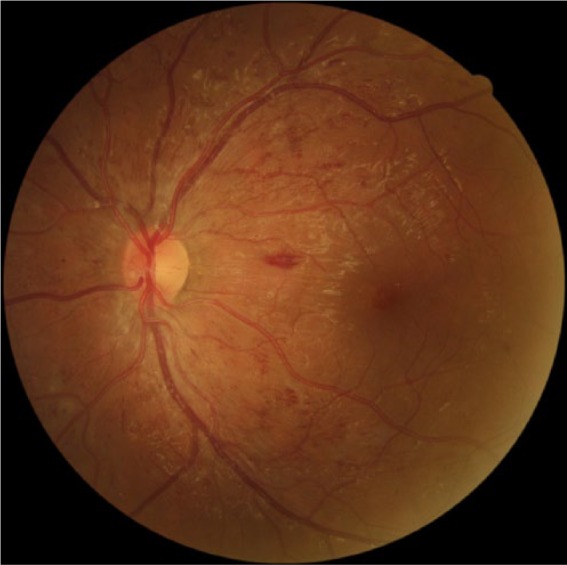
Retinal image of DM1 left eye demonstrating proliferative diabetic retinopathy.
In our study, thicknesses for macula RT, paramacula RT, paramacula LT, perimacula RT with BMI were statistically significant (P < .05). HbA1C > 7.5% was also found statistically significant in the macula LT, paramacula RT, paramacula LT, perimacula RT, and perimacula LT. A general trend of thickening of the macula, paramacula and perimacula was observed with increasing HbA1C (>7.5%) and increasing BMI; however, no statistical significance was found. However, of these 2 risk factors, the most important in relation to the onset and progression of DR is an increase in HbA1C levels.
The Diabetes Control and Complications Trial (DCCT) supports the benefits of lowering HbA1C levels and managing glycemic control in reducing the rate of such complications.21 By implementing the use of a SD-OCT in measuring central fovea thickness and providing a measure of macular thickness, patients with diabetes may uncover early changes and receive timely intervention that can save vision.22-25 The DCCT discovered a decrease in the risk of retinopathy progression by 53% in children ages 13 to 17.25 The UK Prospective Diabetes Study found a 35% decrease in the risk of developing micro vascular complications for every percentage decrease in HbA1C levels (eg, from 7 to 6%).26-28 As supported by our study, there remains a strong correlation between DR and HbA1C.25,29
Some of the limitations of our study include: a self-reported duration of diabetes and self-reported A1C levels. BMI was an objective measurement that was calculated and included in the analysis to further corroborate the reported data on diabetes control. The study population was relatively homogenous (79% Caucasian) and a self-selected participant population of likely higher socioeconomic status, which may have affected the rate of pathology.
Conclusions
The success of SD-OCT is warranted in its role of detecting vision-threatening abnormalities prior to vision loss, providing patients with immediate preventative measures and a way to monitor the response to a selected therapy.7 In our study, SD-OCT with retinal imaging was feasible in young individuals and revealed ultra-structural macular and perimacular changes in subjects with DM1 prior to manifested clinical disease. The ultra-structural changes observed on OCT within our given age group were not detectable on prior higher resolution digital fundus imaging. Thus, our results of initial neurodegenerative changes seen on SD-OCT warrant further investigation with a larger study and a comparative normal, reference database.
Footnotes
Abbreviations: BMI, body mass index; DCCT, Diabetes Control and Complications Trial; DM1, type 1 diabetes mellitus; DR, diabetic retinopathy; LT, left eye; RT, right eye; SD-OCT, spectral domain optical coherence tomography.
Declaration of Conflicting Interests: The author(s) declared no potential conflicts of interest with respect to the research, authorship, and/or publication of this article.
Funding: The author(s) received no financial support for the research, authorship, and/or publication of this article.
References
- 1. Lueder GT, Silverstein J. Screening for retinopathy in the pediatric patient with type 1 diabetes mellitus. Pediatrics. 2005;116:270-273. [DOI] [PubMed] [Google Scholar]
- 2. Sivaprasad S, Gupta B, Crosby-Nwaobi R, Evans J. Prevalence of diabetic retinopathy in various ethnic groups: a worldwide perspective. Surv Ophthalmol. 2012;57:347-370. [DOI] [PubMed] [Google Scholar]
- 3. American Academy of Ophthalmology Preferred Practice Patterns Committee. Preferred Practice Pattern® guidelines. Diabetic retinopathy. San Francisco, CA: American Academy of Ophthalmology; 2014. Available at: www.aao.org/ppp. [Google Scholar]
- 4. Martinez Rubio M, Moya Moya M, Bernbe Bellot A, Martinez Belmonte J. Cribado de retinopatia diabetic y teleoftalmologia. Arch Soc Esp Oftalmol. 2012;87:392-395. [DOI] [PubMed] [Google Scholar]
- 5. Bronson-Castain K, Bearse MA, Jr, Neuville J, et al. Early neural and vascular changes in the adolescent type 1 and type 2 diabetic retina. Retina. 2012;32(1):92-102. [DOI] [PMC free article] [PubMed] [Google Scholar]
- 6. Bearse MA, Jr, Adams AJ, Han Y, et al. A multifocal electroretinogram model predicting the development of diabetic retinopathy. Prog Retin Eye Res. 2006;25(5):425-448. [DOI] [PMC free article] [PubMed] [Google Scholar]
- 7. Dhamdhere KP, Bearse MA, Jr, Harrison W, et al. Associations between local retinal thickness and function in early diabetes. Invest Ophthalmol Vis Sci. 2012;53(10):6122-6128. [DOI] [PMC free article] [PubMed] [Google Scholar]
- 8. Sivaprasad S, Gupta B, Crosby-Nwaobi R, Evans J. Prevalence of diabetic retinopathy in various ethnic groups: a worldwide perspective. Surv Ophthalmol. 2012;57(4):347-370. [DOI] [PubMed] [Google Scholar]
- 9. Children with Diabetes. Friends for life. May 5, 2015. Available at: http://www.childrenwithdiabetes.com/activities/orlando2014/. Accessed May 10, 2015.
- 10. Shahid K, Kolomeyer AM, Nayak NV, et al. Ocular telehealth screenings in an urban community. Telemed J E Health. 2012;8:95-100. [DOI] [PubMed] [Google Scholar]
- 11. Early Treatment of Diabetic Retinopathy Study Research Group. Photocoagulation therapy for diabetic eye disease. JAMA.1985;254:3086. [PubMed] [Google Scholar]
- 12. Mohamed Q, Gillies MC, Wong TY. Management of diabetic retinopathy: a systematic review. JAMA. 2007;298(8):902-916. [DOI] [PubMed] [Google Scholar]
- 13. Cheung N, Mitchell P, Wong TY. Diabetic retinopathy. Lancet. 2010;376;124-136. [DOI] [PubMed] [Google Scholar]
- 14. Klein R, Klein BE, Moss SE, Davis MD, DeMets DL. The Wisconsin Epidemiologic Study of Diabetic Retinopathy. II. Prevalence and risk of diabetic retinopathy when age at diagnosis is less than 30 years. Arch Ophthalmol. 1984;102:520-526. [DOI] [PubMed] [Google Scholar]
- 15. Abu El-Asrar AM, Midena E, Al-Shabrawey M, Mohammad G. New developments in the pathophysiology and management of diabetic retinopathy. J Diabetes Res. 2013;2013:424258. [DOI] [PMC free article] [PubMed] [Google Scholar]
- 16. Vujosevic S, Midena E, Pilotto E, Radin PP, Chiesa L, Cavarzeran F. Diabetic macular edema: correlation between microperimetry and optical coherence tomography findings. Invest Ophthalmol Vis Sci. 2006;47(7):3044-3051. [DOI] [PubMed] [Google Scholar]
- 17. Murakami T, Yoshimura N. Structural changes in individual retinal layers in diabetic macular edema. J Diabetes Res. 2013;2013:920713. [DOI] [PMC free article] [PubMed] [Google Scholar]
- 18. Fong DS, Aiello L, Gardner TW, et al. Diabetic retinopathy. Diabetes Care. 2003;26:226-229. [DOI] [PubMed] [Google Scholar]
- 19. Yau JW, Rogers SL, Kawasaki R, et al. Global prevalence and major risk factors of diabetic retinopathy. Diabetes Care. 2012;35(3):556-564. [DOI] [PMC free article] [PubMed] [Google Scholar]
- 20. Dirani M, Xie J, Fenwick E, et al. Are obesity and anthropometry risk factors for diabetic retinopathy? The diabetes management project. Invest Ophthalmol Vis Sci. 2011;52:4416-4421. [DOI] [PubMed] [Google Scholar]
- 21. Diabetes Control and Complications Trial Research Group. The effect of intensive treatment of diabetes on the development and progression of long-term complications in insulin-dependent diabetes mellitus. N Engl J Med. 1993;329:977-986. [DOI] [PubMed] [Google Scholar]
- 22. Hee MR, Puliafito CA, Duker JS, et al. Topography of diabetic macular edema with optical coherence tomography. Ophthalmology. 1998;105:360-370. [DOI] [PMC free article] [PubMed] [Google Scholar]
- 23. Hee MR, Puliafito CA, Wong C, et al. Quantitative assessment of macular edema with optical coherence tomography. Arch Ophthalmol. 1995;113(8):1019-1029. [DOI] [PubMed] [Google Scholar]
- 24. Otani T, Kishi S, Maruyama Y. Patterns of diabetic macular edema with optical coherence tomography. Am J Ophthalmol. 1999;127:688-693. [DOI] [PubMed] [Google Scholar]
- 25. Diabetes Control and Complications Trial Research Group. Effect of intensive diabetes treatment on the development and progression of long-term complications in adolescents with insulin-dependent diabetes mellitus. J Pediatr. 1994;125:177-188. [DOI] [PubMed] [Google Scholar]
- 26. UK Prospective Diabetes Study Group. Tight blood pressure control and risk of macrovascular and microvascular complications in type 2 diabetes: UKPDS 38. BMJ. 1998;317:703-713. [PMC free article] [PubMed] [Google Scholar]
- 27. UK Prospective Diabetes Study Group. Intensive blood-glucose control with sulphonylureas or insulin compared with conventional treatment and risk of complications in patients with type 2 diabetes (UKPDS 33). Lancet. 1998;352:837-853. [PubMed] [Google Scholar]
- 28. UK Prospective Diabetes Study Group. Effect of intensive blood-glucose control with metformin on complications in overweight patients with type 2 diabetes (UKPDS 34). Lancet. 1998;352:854-865. [PubMed] [Google Scholar]
- 29. Stratton IM, Kohner EM, Aldington SJ, et al. UKPDS 50: risk factors for incidence and progression of retinopathy in type II diabetes over 6 years from diagnosis. Diabetologia. 2001;44:156-163. [DOI] [PubMed] [Google Scholar]