Abstract
Background:
Hard exudates (HE) are used as a surrogate marker for sight-threatening diabetic macular edema (DME) in most telemedicine-based screening programs in the world. This study investigates whether proximity of HE to the center of the macula, and extent of HE are associated with greater clinically significant macular edema (CSME) severity. A novel method for associating optical coherence tomography (OCT) scans with CSME was developed.
Methods:
Eligible subjects were recruited from a DRS program in a community clinic in Oakland, California. Ocular fundus of each subject was imaged using 3-field 45-degree digital retinal photography and scanned using central 7-line spectral domain OCT. Two certified graders separated subjects into 2 groups, those with and without HE within 500 microns from the center of the macula. A modified DME severity scale, developed from Early Treatment Diabetic Retinopathy Study data and adapted to OCT thickness measurements, was used to stratify CSME into severe and nonsevere levels for all subjects.
Results:
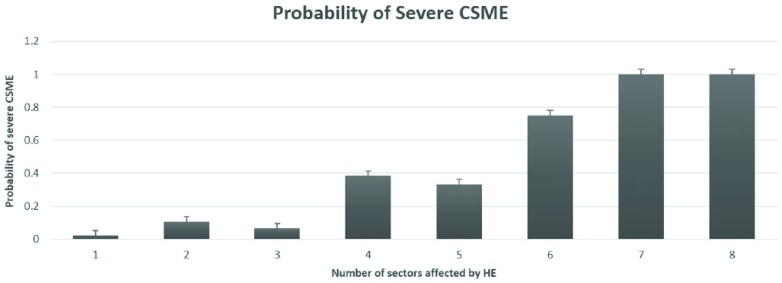
The probabilities of severe CSME in groups 1 and 2 were 14.4% (95% CI: 8.2%-23.8%) and 9% (95% CI: 2.4%-25.5%), respectively (P = .556). In post hoc analysis, increase in the number of sectors affected by HE within the central zone of the macula was associated with the increase in the probability of being diagnosed with severe CSME.
Conclusion:
We have proposed OCT-based classification of DME into severe and nonsevere CSME. Based on this limited analysis, severity of CSME is related more to extent of HE rather than proximity to the center of the macula.
Keywords: diabetic macular edema, hard exudates, optical coherence tomography, screening
Diabetes mellitus is becoming one of the most prevalent diseases worldwide, with well over 300 million people projected to be affected by the year 2030.1 According to different estimates, between 9% and 14% of adults in the United States have diabetes and almost a third of those are undiagnosed.2,3 Microvascular complications of diabetes remain the leading cause of blindness among working-age adults in the United States.4 The economic burden of diabetes in the United States is difficult to overstate, with an estimated $245 billion spent in 2012. This includes direct medical costs as well as costs related to disability and inability to work.2 In spite of the scope of the problem, nationwide compliance with regular eye exams is only 60% in patients with diabetes.5 In an effort to improve compliance with regular eye care among diabetic patients, diabetic retinopathy screening (DRS) programs in primary care and diabetes clinics have been implemented and shown to be effective.6,7
After proliferative diabetic retinopathy (PDR), the second most common cause of persistent severe vision loss in patients with diabetes is diabetic macular edema (DME).8 The Early Treatment Diabetic Retinopathy Study (ETDRS) defined a subset of DME, clinically significant macular edema (CSME), and demonstrated that prompt laser photocoagulation for CSME reduces the likelihood of moderate vision loss by 50%.9 Since then, the use of anti–vascular endothelial growth hormone (VEGF) therapy that inhibits vascular endothelial growth factor was shown not only to reduce the risk of vision loss in patients with CSME but also to improve visual acuity and reduce central macular thickness.10-12 Therefore, timely detection and prompt referral for suspected CSME by DRS programs is of critical importance. DRS programs generally use nonmydriatic, 2-dimensional monoscopic fundus photos for the detection of sight-threatening retinopathy. Rather than directly observing increased retinal thickening from edema, they must rely on a surrogate marker of CSME. Presence and location of hard exudates (HE) are used to detect CSME, since the stereoscopic (3-dimensional) effect needed to detect retinal thickening (edema) is absent in such images. In patients with diabetes, eyes with HE within 1 optic nerve disc diameter (1DD – approximately 1500 microns) of the center of the macula manifest CSME more frequently than those without HE within 1DD. This surrogate marker has been shown to have good utility in referring patients with suspected CSME in a screening setting.13,14 It is unknown whether eyes with HE within 500 microns of the fovea present with more severe sight-threatening DME than those with HE located greater than 500 microns but within 1DD from the fovea and, therefore, would require a more urgent referral. In an effort to improve the triaging ability of DRS programs, this study aims to answer this question.
Methods
Subject recruitment and data collection was done at 4 community health clinics, part of the Alameda Health System (AHS) in Northern California. Subjects were recruited from a consecutive stream of patients evaluated as part of an established DRS program. All patients with diabetes mellitus were eligible for recruitment if they were at least 18 years of age, not pregnant, and were able to understand and give informed consent to participate in the study. We obtained Retina Map OCT scans and 3-field fundus photographs on both eyes of 1814 adult patients with diabetes. Study protocol was approved by the Institutional Review Boards of the AHS and the University of California, Berkeley. Three-field nonmydriatic digital fundus photographs were obtained using a CR6-45NM fundus camera (Canon Inc, Tokyo, Japan) according to EyePACS protocol.15 Macular thickness optical coherence tomography (OCT) scans were obtained using iVUE OCT (Optovue, Inc, Fremont, CA) Retina Map scanning protocol. Only 1 eligible eye from each patient was used for analysis. 159 eyes with HE within 1DD from the center of the macula were initially selected. 36 eyes were excluded because of the macular pathology other than DME or because of the poor image quality. The level of retinopathy was established in each eye based on grading of the digital fundus photographs done by an EyePACS-certified grader following the International Clinical Diabetic Retinopathy Severity Scale.16
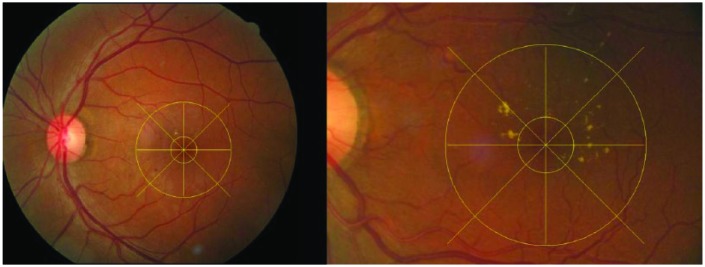
Custom software, Matlab (MathWorks, Natick, MA) was used to apply a measuring grid to the photographs to judge the proximity of HE to the fovea and to determine the location in the central macula affected by HE (Figure 1). We used a scaling factor to determine the distance from the fovea based on the measured pixels. Eyes were classified by 2 masked graders (TL and CW) as those having HE within 500 microns from the center of the fovea (Group 1) and those with HE located at a distance greater than 500 microns from the center of the fovea but within 1DD (Group 2). In case of disagreement between the 2 graders, adjudication was performed by a third expert grader (JC).
Figure 1.
Digital fundus photos. The outer ring centered on the fovea is 1DD in radius. The inner ring centered on the fovea is 500 microns inradius. (A) 45° image showing HE located further than 500 microns away from the center of the macula but within 1DD. HE are present in 2 out of 8 sectors within the central zone (CZ; within 1DD). (B) An enlarged image of the macula. HE are located within 500 microns from the center of the macula and in 5 out of 8 sectors within the CZ.
To stratify eyes by the severity of CSME and to determine the proportion of eyes with severe CSME in Groups 1 and 2, we have adapted a modified DME severity scale developed from ETDRS data.17 The ETDRS severity scale for DME was derived based on the extent of visual impairment as a function of the degree of retinal thickening in the macular center and the size and location of retinal thickening within the central zone (CZ, the area within 1DD from the center of the macula).17 We adapted this scale to the OCT measurements in the following way. We defined severe CSME as the level of thickening in the central macula corresponding to Level 3B or worse on a 9-step ETDRS scale which was associated with the number of letters read at baseline equal to or less than 77.17 This value approximates Snellen acuity of 20/30 or worse. We chose this level of visual impairment as a cutoff because we consider it to be clinically significant.
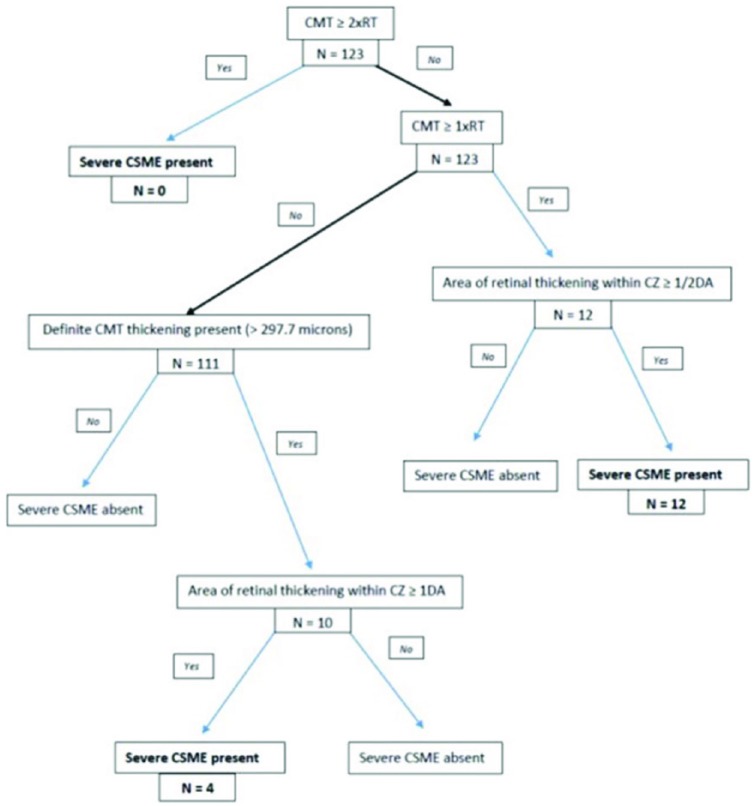
Eyes were deemed to be in the severe CSME category if they met at least 1 of the following 3 criteria that match Level 3B or worse and are based on OCT scan analysis: (1) retinal thickening at the macular center (central ring of 1mm in diameter centered on the fovea), defined as central macular thickness (CMT), greater than 2 standard deviations from the mean normal thickness derived from a normative database18 but less than 1 × the reference thickness (RT; the 95th percentile of normal retinal thickness in the region located 1 to 3 mm from the macular center) AND retinal thickening within CZ that is at least 1 disc area in size; (2) CMT greater or equal to 1 × RT but less than 2 × RT AND area of retinal thickening within CZ that is equal to or greater than half disc area; (3) CMT equal to or greater than 2 × RT (Figure 2). It has been shown that age and sex have an effect on retinal thickness19-21 so we corrected our cutoff RT values based on these parameters for each individual subject. These RT values were derived from a regression equation based on normative database.18 The area of retinal thickening in the CZ was established by inspecting each topographic map and b-scans (Figure 3). We calculated and compared the proportion of eyes that met the criteria for severe CSME in Group 1 and Group 2.
Figure 2.
Digital fundus photos. The outer ring centered on the fovea is 1DD in size. The inner ring centered on the fovea is 500 microns in size. (A) 450 image showing HE located further than 500 microns away from the center of the macula but within 1DD. HE are present in 2 out of 8 sectors within the central zone (CZ; within 1DD). (B) An enlarged image of the macula. HE are located within 500 microns from the center of the macula and in 5 out of 8 sectors within the CZ.
Figure 3.
iVue OCT scan showing 6x6 mm topographic map on the left. The inner ring radius is 500 microns, the middle ring radius is 1 disc diameter (CZ). Seven b-scans shown on the right are collected in the center of the macula with separation of 250 microns. The topographic map shows significant swelling within the CZ affecting the area that is at least 1DD in size. B-scans show accumulation of fluid in all 7 scans.
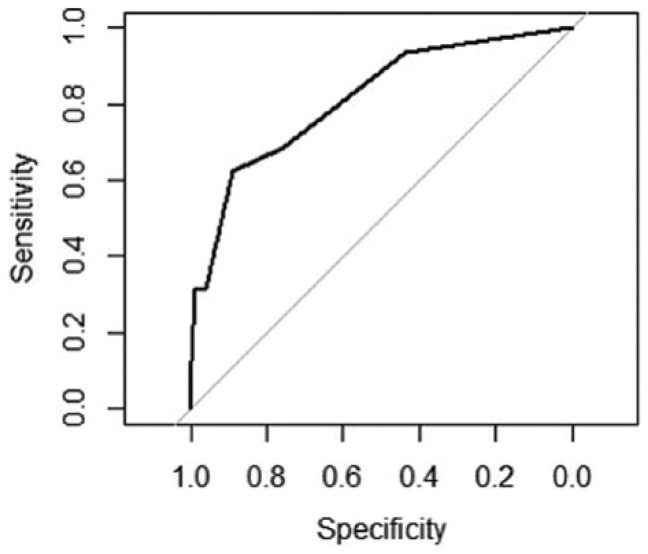
Statistical analysis was performed in R (https://cran.r-project.org/). We have used a 2-sided, 2-sample t test to compare groups with continuous variables. The Mann–Whitney test was performed when variables did not follow a normal distribution. A chi-square test was used to evaluate differences in proportions. The Fisher exact test was used when the cell count was small (eg, Table 1, Ethnicity). Intergrader agreement was evaluated using Cohen’s kappa. We also used logistic regression analysis to evaluate the relationship between the severity of CSME and the number of macular sectors affected by HE, the proximity of HE to the center of the macula, the subject’s age and sex, and the duration of diabetes. After selecting the most significantly associated independent variable we used ROC analysis to evaluate the characteristics of the screening test for the detection of severe CSME based on that variable. The ROC curve was built and analyzed using pROC package in R.22
Table 1.
Descriptive Statistics.
| Sample total | Group 1 | Group 2 | P value | |
|---|---|---|---|---|
| N (%) | 123 (100) | 90 (72.5) | 33 (27.4) | |
| Females (%) | 54 (43.9) | 36 (40) | 18 (54.5) | .217 |
| Mean age (SD) | 54.9 (8.3) | 54.7 (8.4) | 55.4 (8.1) | .684 |
| Mean duration of DM (SD) | 11.5 (5.9) | 11.7 (6.0) | 10.7 (5.6) | .358 |
| Ethnicity (%) | .159 | |||
| African descent | 26 (21.1) | 23 (25.6) | 3 (9.1) | |
| Hispanic | 43 (35.0) | 30 (33.3) | 13 (39.4) | |
| Asian | 45 (36.6) | 29 (32.2) | 16 (48.5) | |
| White | 8 (6.5) | 7 (7.8) | 1 (3.0) | |
| Other | 1 (0.8) | 1 (1.1) | 0 |
P values relate to the test statistic used to evaluate the difference in the corresponding variables between Group 1 and Group 2.
Results
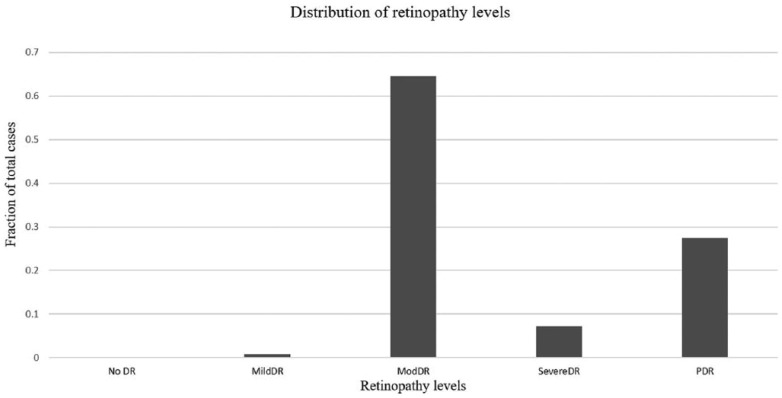
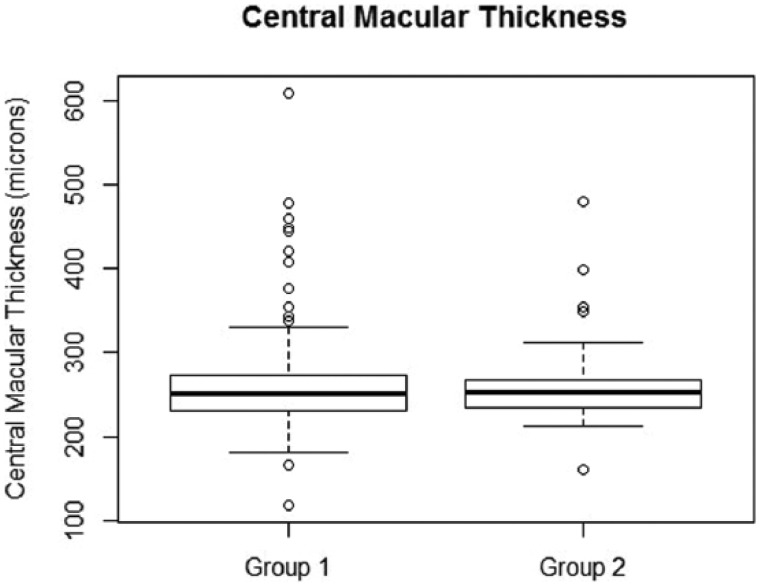
A total of 123 subjects with HE within 1DD from the center of the macula were included in the final analysis. The mean age of the sample was 54.9 ± 8.3 years. There were 54 (43.9%) females. HE within 500 microns of the center of the macula were observed in 90 subjects (73.2%) (Group 1). The intergrader agreement for judging the location of HE from digital fundus photos was good (k = 0.7). The distribution of retinopathy in our sample is shown in Figure 4. The overall prevalence estimate of severe CSME in our sample was 13.0% (95% CI: 7.8%-20.5%) (Figure 2). The demographic data is shown in Table 1. There was no difference in age, duration of diabetes, sex of the subject and ethnic composition between Groups 1 and 2. The prevalence estimate of severe CSME was 14.4% (95% CI: 8.2%-23.8%) in Group 1 and 9% (95% CI: 2.4%-25.5%) in Group 2. The difference in probabilities of severe CSME diagnosis was small, about 5%, between Group 1 and Group 2 and was not statistically significant (P value = .556), as seen in Table 2. The associated odds ratio was 1.83 (95% CI: 0.46-10.66). However, it must be noted that our sample sizes were not large enough to confidently detect that small of a difference, if it was truly present. We have also compared the absolute value of CMT in Group 1 and Group 2. In Group 1, the median, 25th and 75th percentiles were 250.0 microns, 231.5 microns, and 271.8 microns, respectively. In Group 2 the corresponding values were 252.0 microns, 234.0 microns, and 267.0 microns (Figure 5). There was no difference in CMT between the 2 groups (P value = .9).
Figure 4.
Distribution of retinopathy levels in the entire sample. Of note is the tendency toward more severe levels of retinopathy in this sample.
Table 2.
The Group of Subjects With the Absence of HE Within 500 Microns From the Center of the Macula Is Equivalent to the Group of Subjects With HE Located Between 500 Microns and 1DD From the Center of the Fovea.
| Severe CSME |
|||
|---|---|---|---|
| Present | Absent | ||
| HE within 500 microns from the center of the macula | Present | 13 | 77 |
| Absent | 3 | 30 | |
Fisher exact test was used to evaluate the association between the location of HE with respect to the center of the macula and the presence of severe CSME. Resulting P value is .556, which means that subjects with HE within 500 microns of the center of the macula do not have higher proportion of severe CSME when compared to subjects with HE located between 500 microns and 1DD from the center of the macula.
Figure 5.
Box plot showing the distribution of CMT values in Group 1 and Group 2. Median value for corresponding group is represented by the bold line inside each box. The 75th percentile is represented by the upper boundary of the box plot. The 25th percentile is represented by the bottom boundary of the box plot. Empty circles are outliers. Mann–Whitney test was used to compare CMT distribution in Groups 1 and 2. The resulting P value is .9. This means that distribution in Group 1 is not different from distribution in Group 2.
In post hoc analysis, increase in the number of sectors affected by HE within the central zone of the macula was associated with the increase in the probability of being diagnosed with severe CSME (Figure 6). In the logistic regression analysis, patient’s age, sex, and the number of macular sectors affected by HE were significantly associated with the presence of severe CSME (corresponding P values: .011, .045, <.001) when keeping other variables constant (Table 3). An increase in each year of subject’s age was associated with the odds ratio of 1.14 (95% CI: 1.04-1.28) for having severe CSME. Females had significantly lower relative risk of having CSME compare to males with the odds ratio of 0.21 (95% CI: 0.036-0.871). Finally, a 1-unit increase in the number of macular sectors affected by HE was associated with the odds ratio of having severe CSME equal to 2.18 (95% CI: 1.45-3.55).
Figure 6.
Probability of severe CSME as a function of the number of sectors within CZ that are affected by HE.
Table 3.
Results of the Logistic Regression Analysis.
| Variable | Coefficient | P value | Odds ratio | 95% CI |
|---|---|---|---|---|
| HE location | −0.257 | .755 | 0.773 | 0.158, 4.47 |
| Subject’s age | 0.134 | .011* | 1.14 | 1.04, 1.28 |
| Duration of DM | −0.03 | .572 | 0.968 | 0.861, 1.08 |
| Subject’s sex | −1.58 | .045* | 0.205 | 0.036, 0.871 |
| Number sectors | 0.779 | <.001* | 2.18 | 1.45, 3.55 |
Severe CSME is the outcome variable. A 1-year increase in subject’s age was associated with increase in the odds ratio of 1.15. Female sex had a protective effect, with odds ratio of 0.18. An increase by 1 additional macular sector affected by HE was associated with the odds ratio of 2.39. * indicates statistically significant association.
An ROC curve was plotted using the number of sectors as a predictor of severe CSME (Figure 7). The area under the curve was 81.5% (95% CI: 69.9%-93.2%). The sensitivity, specificity, positive predictive value (PPV), and negative predictive value (NPV) of the local maxima on the ROC curve (thresholds) are shown in Table 4. The overall “best” cutoff value is 3.5—that is, if more than 3 macular sectors are affected by HE, the sensitivity of this screening test is 62.5% and the specificity is 88.8%.
Figure 7.
ROC curve illustrating test characteristics for the detection of severe CSME based on different number of macular sectors affected by HE. Area under the curve (AUC) = 81.54% (95% CI: 69.92-93.17).
Table 4.
Sensitivity, Specificity, Positive Predictive Value (PPV), Negative Predictive Value (NPV) for the Different Cutoff (Threshold) Values of the ROC Curve Based on the Number of Macular Sectors Affected by HE.
| Threshold (# of sectors) | 1.5 | 2.5 | 3.5 | 5.5 | 6.5 |
|---|---|---|---|---|---|
| Sensitivity (%) | 93.75 | 68.75 | 62.50 | 31.25 | 12.50 |
| Specificity (%) | 43.93 | 75.70 | 88.79 | 99.06 | 100.00 |
| PPV (%) | 20.00 | 29.73 | 45.45 | 83.33 | 100.00 |
| NPV (%) | 97.92 | 94.19 | 94.06 | 90.59 | 88.43 |
Discussion
We have proposed OCT-based classification of DME into severe and nonsevere CSME (Figure 2). OCT-based approach to evaluating the severity of DME has the advantage of providing objectivity and, potentially, reducing the interobserver variability as well as adding precision to the estimate of change over time. This classification is proposed based on our adaptation of the DME severity scale reported by Gangnon et al.17 We have adapted this severity scale because it offers 2 crucial components required for OCT-based classification of CSME into severe and nonsevere subtypes. This scale defines the severity levels in semiquantitative terms which can be replicated using OCT data and, importantly, it links each severity level to the degree of visual impairment which is an accepted criterion for defining the severity of DME. This adaptation is important because the information regarding the risk of vision loss in CSME was derived by the ETDRS study when OCT technology was not available.9,23 In addition, the correlation between visual acuity and the absolute measurement of central retinal thickness in patients with DME is only modest, which makes it difficult to establish an absolute cutoff value for CSME.24
We were able to use this classification to determine if an urgent referral for suspected sight-threatening DME is required by DRS programs based on the proximity of HE to the center of the macula. Out of all the eyes with HE within 1DD of the center of the macula, nearly three-quarters had HE located within 500 microns of the center of the macula. In our sample, the difference in the probability of being diagnosed with severe CSME in the group of eyes with HE within 500 microns of the center of the macula and those with HE between 500 microns and 1DD was small and not statistically significant. In addition, the central macular thickness was not different in those 2 groups. These results should be interpreted cautiously because of the relatively small sample sizes of the 2 groups compared and the risk of Type II error.
Additional analysis of our data revealed that the measure of extent to which HE affect the central macula improves the ability to discriminate between the eyes with severe CSME and those without it. We have used the number of sectors within the central zone as the measure of extent to which HE affect the central macula (Figure 1). The probability of being diagnosed with severe CSME increased as the number of sectors affected by HE within the central zone of the macula increased. A plausible explanation for this association between a larger number of sectors within the central zone and the increased likelihood of severe CSME presence is that this reflects the extent of blood-retina barrier permeability. The formation of HEs is associated with the breakdown of blood-retina barrier and increase in retinal vascular permeability.25,26 It has been shown that the increase in blood-retina barrier permeability was significantly higher at baseline and at 18-month follow-up visit in eyes that eventually developed CSME than in the eyes that did not.27 Therefore, an increased number of sectors affected by HE within the central zone likely indicates a greater extent of increased blood-retina barrier permeability and may be useful in deciding on the urgency of referral once the patient is suspected of having CSME based on the presence of HE within 1DD from the center of the macula. We recognize that fundus photos obtained during screening may vary slightly in orientation. We do not expect the orientation of the macular grid relative to the macular orientation to substantially change the utility of this test because the measure of interest is the number of sectors affected by HE and not their specific segment location. Screening test characteristics for different cutoff values are provided in Table 4. A screening program may adopt various cutoff values to implement a more urgent referral strategy reflecting the unique needs of the community it serves based on the evaluation of tradeoff between over-referral and under-referral with the ultimate goal of improving the cost-effectiveness of the screening program.
The limitation of this study is that the proposed OCT-adaptation of the DME severity scale has not been validated on an independent set of data. We intend to perform this validation in the future. This, however, does not limit the outcomes of the study because we have also compared the absolute central macular thickness in Group 1 and Group 2 and did not find it to be statistically different. In addition, the severe CSME group clearly included eyes with more advanced cases of CSME and therefore provides information regarding the distribution of more advanced cases of CSME in Groups 1 and 2. Another limitation of this study is a relatively small sample size. It is possible that in a larger sample size a small effect size could be evaluated more confidently.
It has been reported that racial minorities have a higher rate of sight-threatening complications from diabetes and lower compliance with eye exams than non-Hispanic whites.28 A strength of this study is that non-Hispanic whites account for only 6.5% of our sample with the vast majority of our subjects representing Asian, Hispanic, and African descent ethnic groups. This ethnic distribution makes it easier to generalize the results of our study to the groups of people who stand to benefit most from the improvement in detection of sight-threatening diabetic retinopathy. Other programs with very different demographic characteristics should interpret our results with that in mind.
Acknowledgments
We would like to acknowledge Dr Matthew Davis, University of Wisconsin Fundus Photo Reading Center, for his advice regarding the modified ETDRS grading for macular edema severity.
Footnotes
Abbreviations: AHS, Alameda Health System; AUC, area under the curve; CI, confidence interval; CMT, central macular thickness; CSME, clinically significant macular edema; CZ, central zone; DD, disc diameter; DME, diabetic macular edema; DRS, diabetic retinopathy screening; ETDRS, Early Treatment Diabetic Retinopathy Study; HE, hard exudates; NPV, negative predictive value; OCT, optical coherence tomography; PDR, proliferative diabetic retinopathy; PPV, positive predictive value; ROC, receiver operating characteristic; RT, reference thickness; VEGF, vascular endothelial growth hormone.
Declaration of Conflicting Interests: The author(s) declared the following potential conflicts of interest with respect to the research, authorship, and/or publication of this article: Qienyuan Zhou is employed by Optovue, Inc. George Bresnick has a personal financial interest in EyePACS, LLC. Jorge Cuadros has a personal financial interest in EyePACS, LLC.
Funding: The author(s) disclosed receipt of the following financial support for the research, authorship, and/or publication of this article: This study was supported by the following funding, NIH K12EY017269 to TL and T35 to CW.
References
- 1. Wild S, Roglic G, Green A, Sicree RKH. Global prevalence of diabetes. Diabetes Care. 2004;27:1047-1053. [DOI] [PubMed] [Google Scholar]
- 2. Centers for Disease Control and Prevention. National diabetes statistics report: estimates of diabetes and its burden in the United States. 2014. Available at: http://www.cdc.gov/diabetes/pubs/statsreport14/national-diabetes-report-web.pdf. Accessed July 29, 2015.
- 3. Boyle JP, Thompson TJ, Gregg EW, Barker LE, Williamson DF. Projection of the year 2050 burden of diabetes in the US adult population: dynamic modeling of incidence, mortality, and prediabetes prevalence. Popul Health Metr. 2010;8:29. doi: 10.1186/1478-7954-8-29. [DOI] [PMC free article] [PubMed] [Google Scholar]
- 4. Kempen JH, O’Colmain BJ, Leske MC, et al. The prevalence of diabetic retinopathy among adults in the United States. Arch Ophthalmol. 2004;122(4):552-563. doi: 10.1001/archopht.122.4.552. [DOI] [PubMed] [Google Scholar]
- 5. Hazin R, Barazi MK, Summerfield M. Challenges to establishing nationwide diabetic retinopathy screening programs. Curr Opin Ophthalmol. 2011;22(3):174-179. doi: 10.1097/ICU.0b013e32834595e8. [DOI] [PubMed] [Google Scholar]
- 6. Mansberger SL, Sheppler C, Barker G, et al. Long-term comparative effectiveness of telemedicine in providing diabetic retinopathy screening examinations: a randomized clinical trial. JAMA Ophthalmol. 2015;133(5):518-525. doi: 10.1001/jamaophthalmol.2015.1. [DOI] [PMC free article] [PubMed] [Google Scholar]
- 7. Jones S, Edwards RT. Diabetic retinopathy screening: A systematic review of the economic evidence. Diabet Med. 2010;27(3):249-256. doi: 10.1111/j.1464-5491.2009.02870.x. [DOI] [PubMed] [Google Scholar]
- 8. Fong DS, Ferris FL, Davis MD, Chew EY. Causes of severe visual loss in the Early Treatment Diabetic Retinopathy Study: ETDRS report no. 24. Am J Ophthalmol. 1999;127(2):137-141. doi: 10.1016/S0002-9394(98)00309-2. [DOI] [PubMed] [Google Scholar]
- 9. Grand MG. Photocoagulation for diabetic macular edema. Arch Ophthalmol. 1986;104(8):1115-1116. doi: 10.1001/archopht.1986.01050200021013. [DOI] [PubMed] [Google Scholar]
- 10. Diabetic Retinopathy Clinical Research Network. Aflibercept, bevacizumab, or ranibizumab for diabetic macular edema. N Engl J Med. 2015;372:1193-1203. doi: 10.1056/NEJMoa1414264. [DOI] [PMC free article] [PubMed] [Google Scholar]
- 11. Nguyen QD, Shah SM, Heier JS, et al. Primary end point (six months) results of the Ranibizumab for Edema of the mAcula in Diabetes (READ-2) Study. Ophthalmology. 2009;116(11):2175-2181.e1. doi: 10.1016/j.ophtha.2009.04.023. [DOI] [PubMed] [Google Scholar]
- 12. Michaelides M, Kaines A, Hamilton RD, et al. A prospective randomized trial of intravitreal bevacizumab or laser therapy in the management of diabetic macular edema (BOLT Study). 12-month data: report 2. Ophthalmology. 2010;117(6):1078-1086.e2. doi: 10.1016/j.ophtha.2010.03.045. [DOI] [PubMed] [Google Scholar]
- 13. Bresnick GH, Mukamel DB, Dickinson JC, Cole DR. A screening approach to the surveillance of patients with diabetes for the presence of vision-threatening retinopathy. Ophthalmology. 2000;107(1):19-24. doi: 10.1016/S0161-6420(99)00010-X. [DOI] [PubMed] [Google Scholar]
- 14. Litvin TV, Ozawa GY, Bresnick GH, et al. Utility of hard exudates for the screening of macular edema. Optom Vis Sci. 2014;91(4):370-375. doi: 10.1097/opx.0000000000000205. [DOI] [PMC free article] [PubMed] [Google Scholar]
- 15. Cuadros J, Bresnick G. EyePACS: an adaptable telemedicine system for diabetic retinopathy screening. J Diabetes Sci Technol. 2009;3(3):509-516. [DOI] [PMC free article] [PubMed] [Google Scholar]
- 16. Wilkinson CP, Ferris FL, Klein RE, et al. Proposed international clinical diabetic retinopathy and diabetic macular edema disease severity scales. Ophthalmology. 2003;110(9):1677-1682. doi: 10.1016/S0161-6420(03)00475-5. [DOI] [PubMed] [Google Scholar]
- 17. Gangnon RE, Davis MD, Hubbard LD, et al. A severity scale for diabetic macular edema developed from ETDRS data. Investig Ophthalmol Vis Sci. 2008;49(11):5041-5047. doi: 10.1167/iovs.08-2231. [DOI] [PMC free article] [PubMed] [Google Scholar]
- 18. Comer G, Davey P, Cuadros J, et al. The Ivue Normative Database Study—methodology and distribution of OCT parameters. American Academy of Optometry; Available at: http://www.aaopt.org/ivuetm-normative-database-study-methodology-and-distribution-oct-parameters. Accessed July 24, 2015. [Google Scholar]
- 19. Kashani AH, Zimmer-Galler IE, Shah SM, et al. Retinal thickness analysis by race, gender, and age using Stratus OCT. Am J Ophthalmol. 2010;149(3):496-502.e1. doi: 10.1016/j.ajo.2009.09.025. [DOI] [PMC free article] [PubMed] [Google Scholar]
- 20. Ozawa GY, Baskaran K, Litvin TV, et al. Central macular thickness of diabetic eyes with and without exudates within one disc diameter of the fovea. Poster presented at: Association for Research in Vision and Ophthalmology; May 6, 2014. Available at: http://www.arvo.org/webs/am2014/abstract/sessions/345.pdf. Accessed July 24, 2015.
- 21. Chalam K V, Bressler SB, Edwards AR, et al. Retinal thickness in people with diabetes and minimal or no diabetic retinopathy: Heidelberg spectralis optical coherence tomography. Investig Ophthalmol Vis Sci. 2012;53(13):8154-8161. doi: 10.1167/iovs.12-10290. [DOI] [PMC free article] [PubMed] [Google Scholar]
- 22. Robin X, Turck N, Hainard A, et al. pROC: an open-source package for R and S+ to analyze and compare ROC curves. BMC Bioinfo. 2011;12(1):77. doi: 10.1186/1471-2105-12-77. [DOI] [PMC free article] [PubMed] [Google Scholar]
- 23. Sadda SR, Tan O, Walsh AC, Schuman JS, Varma R, Huang D. Automated detection of clinically significant macular edema by grid scanning optical coherence tomography. Ophthalmology. 2006;113(7):1-23. doi: 10.1016/j.ophtha.2005.12.020. [DOI] [PMC free article] [PubMed] [Google Scholar]
- 24. Diabetic Retinopathy Clinical Research Network, Browning DJ, Glassman AR, et al. The relationship between OCT-measured central retinal thickness and visual acuity in diabetic macular edema. Ophthalmology. 2007;114(3):525-536. doi: 10.1016/j.ophtha.2006.06.052. [DOI] [PMC free article] [PubMed] [Google Scholar]
- 25. Chew EY, Klein ML, Iii FLF, et al. Association of elevated serum lipid levels with retinal hard exudate in diabetic retinopathy. Arch Ophthalmol. 1996;114:1079-1084. [DOI] [PubMed] [Google Scholar]
- 26. Scholl S, Kirchhof J, Augustin AJ. Pathophysiology of macular edema. Ophthalmologica. 2010;224(suppl 1):8-15. doi: 10.1159/000315155. [DOI] [PubMed] [Google Scholar]
- 27. Sander B, Thornit DN, Colmorn L, et al. Progression of diabetic macular edema: correlation with blood retinal barrier permeability, retinal thickness, and retinal vessel diameter. Invest Ophthalmol Vis Sci. 2007;48(9):3983-3987. doi: 10.1167/iovs.06-1102. [DOI] [PubMed] [Google Scholar]
- 28. Shi Q, Zhao Y, Fonseca V, Krousel-Wood M, Shi L. Racial disparity of eye examinations among the U.S. working-age population with diabetes:2002-2009. Diabetes Care. 2014;37(5):1321-1328. doi: 10.2337/dc13-1038. [DOI] [PMC free article] [PubMed] [Google Scholar]


