Abstract
Background & objectives:
Leprosy type 1 reactions (T1R) are acute episodes of immune exacerbation that are a major cause of inflammation and nerve damage. T1R are diagnosed clinically and supported by histopathology. No laboratory marker is currently available that can accurately predict a T1R. Increased plasma and tissue expression of inducible nitric oxide synthase (i-NOS) and chemokine CXCL10 have been demonstrated in T1R. We studied the gene expression and immunoexpression of i-NOS, CXCL10 and its receptor CXCR3 in clinically and histopathologically confirmed patients with T1R and compared with non-reactional leprosy patients to understand which biomarker has better potential in distinguishing reaction from non-reaction.
Methods:
Gene expression of i-NOS, CXCL10 and CXCR3 was studied in 30 skin biopsies obtained from patients with borderline tuberculoid (BT), mid-borderline (BB) and borderline lepromatous (BL) leprosy with and without T1R by real-time PCR. Further validation was done by immunhistochemical expression on 60 borderline leprosy biopsies with and without T1R.
Results:
Of the 120 patients histopathological evaluation confirmed T1R in 65 (54.2%) patients. CXCR3 gene expression was significantly (P<0.05) higher in BT- and BB-T1R patients compared to those without T1R. The CXCL10 gene expression was significantly higher (P<0.05) in BB leprosy with T1R but the difference was not significant in patients with BT with or without T1R. Immunoexpression for CXCR3 was significant in both BB-T1R and BB (P<0.001) and BT and BT-T1R (P<0.001). Immunoexpression of CXL10 was significant only in differentiating BB from BB-T1R leprosy (P<0.01) and not the BT cases. i-NOS immunoexpression was not useful in differentiating reactional from non-reactional leprosy.
Interpretation & conclusions:
Both CXCL10 and CXCR3 appeared to be useful in differentiating T1R reaction in borderline leprosy while CXCR3 alone differentiated BT from BT-T1R. CXCR3 may be a potentially useful immunohistochemical marker to predict an impending T1R.
Keywords: CXCL10, CXCR3, inducible nitric oxide synthase, leprosy, leprosy type 1 reaction
The patients with borderline tuberculoid (BT), mid-borderline (BB) and borderline lepromatous (BL) leprosy are immunologically unstable and at risk of developing a leprosy reaction. During a type 1 leprosy reaction (T1R), a delayed type hypersensitivity reaction occurs that is characterized by enhanced Th1 (T helper cell type 1) cytokine response locally in skin as well as systemically in serum. This enhanced immune response culminates in an influx of activated CD4+ lymphocytes and macrophages that infiltrate the peripheral nerves and skin and eventually cause destruction of the nerves leading to nerve function impairment1. There are no clinical or laboratory tests that can accurately predict those patients who are most likely to develop a T1R or when it might occur. Studies in past have shown an increased immunohistochemical (IHC) expression of inducible nitric oxide synthase (i-NOS) in leprosy skin biopsies and indicated that i-NOS expression was strongest towards the tuberculoid pole of the leprosy spectrum. Some investigators suggested that i-NOS expression increased during reversal reaction while others found that non-reaction leprosy showed increased i-NOS expression2,3,4,5. To identify novel candidate markers in diagnosing leprosy T1R, Stefani et al6 have shown serially increased serum levels of chemokine CXCL10 in T1R, while Scollard et al7 have correlated the increased expression of CXCL10 in serum and in skin biopsies of patients with T1R suggesting a potential role of this chemokine in diagnosis.
The precise molecular events responsible for T1R and the factors which result in T1R in only a subset of leprosy patients remain to be understood. This study was undertaken to elucidate the comparative gene and protein expression of i-NOS, CXCL10 and its receptor CXCR3 in clinically and histopathologically confirmed patients with T1R to identify the markers which showed better potential in distinguishing a type 1 reaction from a non-reaction on skin biopsies of borderline leprosy patients.
Material & Methods
In this cross-sectional study 120 consecutive patients with clinical diagnosis of T1R presenting at the department of Dermatology, Venereology and Leprology of Safdarjung Hospital, New Delhi, India, from April 2010 to October 2012 were included. The patients selection was done after taking approval from the institutional ethical committee of the Safdarjung Hospital. Informed written consent was taken from all patients.
All patients were classified according to Ridley-Jopling classification8 on the basis of clinical examination, histopathological examination and the bacillary index. The clinical case definition for diagnosing T1R was if a patient had redness, swelling or tenderness of pre-existing lesions with or without appearance of new lesions, presence of oedema of face, hands or feet or had nerve tenderness.
Thirty patients gave consent for taking two biopsies from their skin lesions. One biopsy each from the leprosy patient was fixed in 10 per cent buffered formalin and was used for histopathological examination, Fite-Faraco staining and IHC study. The second biopsy from the 30 patients who gave consent for undergoing two biopsies was stabilized in RNA later (Ambion, USA) and stored at -70°C for the gene expression study. Two fresh skin biopsies from normal non-leprosy skin were obtained from two healthy normal volunteers for the purpose of normalization (Fig. 1). Skin biopsies from these 120 patients diagnosed clinically as T1R were stained with hematoxylin-eosin and Fite-Faraco stains for histological evaluation and for finding the bacillary index. Of these 120 skin biopsies, 65 were confirmed histopathologically as T1R and were chosen for immunohistochemistry. After IHC staining, only 60 biopsies were found suitable for evaluation.
Fig. 1.
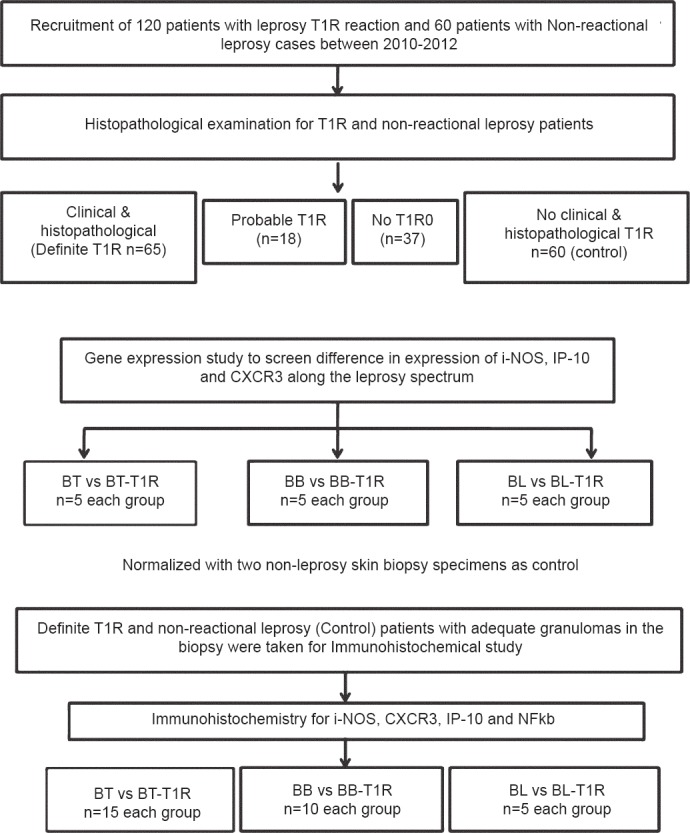
Flow diagram of the study design. BT, borderline tuberculoid leprosy; BT-T1R, borderline tuberculoid leprosy with type I reaction; BB, mid borderline leprosy; BB-T1R, mid borderline leprosy with type 1 reaction; BL, borderline lepromatous leprosy; BL-T1R, borderline lepromatous leprosy with type I reaction.
RNA extraction and real-time PCR: Total RNA was isolated from 32 skin biopsies (BT, n=5; BT-T1R, n=5; BB, n=5; BB-T1R, n=5; BL, n=5; BL-T1R, n=5 and normal skin, n=2) and stabilized in RNA stabilizing solution (Ambion, USA) using RNeasy Mini kit (Qiagen, Germany) according to manufacturer's instructions. Two microgram of this total RNA for each sample was reverse transcribed to single-stranded cDNA using High Capacity cDNA Reverse Transcription Kit (Applied Biosystems, USA) as per manufacturer's instructions. Real time PCR assay was conducted on ABI Prism 7000 (Applied Biosystems, USA) using TaqMan MGB probe (FAM labelled dye) and unlabelled primers for CXCL10 (Assay ID- Hs01075529_m1, Applied Biosystems, USA), i-NOS (Assay ID- Hs00171042_m1, Applied Biosystems, USA), CXCR3 [Assay ID-Hs01847760_s1 and glyceraldehyde-3-phosphate dehydrogenase (GAPDH), Applied Biosystems, USA]. All reactions were performed in duplicate.First PCR cycle was of two minutes at 50°C followed by 10 min at 95°C. Remaining 40 cycles were of 15 sec at 95°C and 60 sec at 60°C. The 2-ΔΔCT method9 was used to quantify the relative changes in gene expression using ABI PRISM® 7000 SDS Software v1.1 (Applied Biosystems, USA). The critical threshold (CT) mean of normal skin was selected as calibrator. Mean of CT of target gene was normalized with CT mean of endogenous control (GAPDH) for each sample.
Immunohistochemical staining and evaluation: A total of 60 skin biopsies of histopathologically confirmed leprosy patients with and without T1R were found suitable for interpretation after IHC staining. These included BT-T1R, (n=15), BB-T1R, (n=10) and BL-T1R, (n=5) and non-reactional BT (n=15), BB (n=10) and BL (n=5) biopsies. Formalin-fixed, paraffin-embedded sections of 4 μm thickness were taken on poly-L-lysine coated slides. These slides were first deparaffinized in xylene and rehydrated in graded alcohol. Antigen retrieval was done in Tris-EDTA, pH 9.0 buffer using EZ-Retriever (Biogenex, USA) at 95°C for 20 min. These sections were incubated at pH7.4 in 50mM Tris buffer (TBS). Endogenous peroxidase blocking was done in 3 per cent H2O2 and sections were incubated with protein block for 10 min followed by incubation with primary antibody at room temperature in humid chamber overnight at 4°C. Primary antibody rabbit anti-human IP-10 (Abcam, UK) was diluted at 1:250; mouse anti-human CXCR3 (clone 2Ar1) (Abcam) at 1:500; rabbit anti-human i-NOS (Abcam, UK) at 1:100 and rabbit anti-human nuclear factor (NF) kappa B (Thermo Scientific, USA) at 1:100 in TBS. After washing with TBS, the sections were incubated with Flex Envision Polymer (Dako, Denmark) for 30 min at room temperature in humidity chamber. After washing, reactions were developed with diamainobenzidine. After counter-staining with hematoxylin sections were dehydrated and mounted. The IHC staining was scored semiquantitatively in three grades depending on degree of positivity (X) and staining intensity of cells (Y) in the granuloma. X was graded as 0: <10 per cent positivity, 1:11-50 per cent positivity and 2: >50 per cent positivity. Y was graded as 0: no staining, 1: weak, 2: strong staining. The final score (S) was the multiplication product of X and Y, and S ≤2 was considered a weak immunoexpression and S=4 as strong immunoexpression.
Immunofluorescence: Procedure up to primary antibody incubation was the same as in immunohistochemistry. After incubation with primary antibody the sections were washed in TBS with three changes for five minutes each. Sections were incubated with anti-mouse/FITC (Dako, Denmark diluted at 1:40) for 30 min at room temperature in humidity chamber. After washing three times with TBS sections were counterstained with propridium iodide and mounted with Fluoromount™ Aqueous Mounting Medium (Sigma Aldrich, USA).
Statistical analysis: Statistical analysis was done using SPSS v17.0 (SPSS, Inc., Chicago, IL, USA). All comparisons were made using non-parametric Mann-Whitney U test for unpaired data.
Results
Among 120 cases of leprosy T1R, 88 (73.3%) patients were males and 32 (26.7%) were females. Mean age was 44.5 ± 14.1 yr (14-60 yr). The patients were classified as T1Rs with BT in 93 (77.5%), mid-borderline in 20 (16.7%) and BL in 7 (5.9%) patients. Of the 120 patients, 23 completed multidrug therapy and 36 were on therapy at the time of presentation. The remaining 64 (50.9%) patients did not give any history of receiving anti-leprosy treatment and presented first time with T1R.
Histopathological evaluation: The clinico-pathological findings of patients are summarized in Table I. The confirmatory parameters of T1R were dermal oedema, oedema within granuloma, lymphocytes within the granuloma and focal obliteration of the grenz zone by the granuloma. Bacillary index (BI) was calculated from Fite-Faraco staining on skin biopsies as slit skin smear data were not available for all the patients. Comparison of BI in non-reactional leprosy and those with T1R are given in Table I. Of the 120 patients after histopathology examination confirmed T1R was seen in 65/120 (54.2%).
Table I.
Clinico-pathological features and comparison of bacillary index among leprosy T1R and non-reaction leprosy

CXCL10, CXCR3 and i-NOS mRNA expression from skin biopsies: The mRNA expression levels of these three genes from skin biopsy of borderline leprosy cases with and without T1R (BT, n=5 and BT-T1R n=5); (BB, n=5 and BB-T1R n=5); (BL, n=5 and BL-T1R n=5) are shown in Fig. 2. Difference in mRNA expression of i-NOS did not show any significance between any group. The expression level of i-NOS was higher towards tuberculoid pole. CXCL10 expression was consistently high in all the groups with mRNA level reaching >500 fold in BB-T1R. Significant difference was observed between BB and BB-T1R (P<0.05) and not in other two groups of BT/BT-T1R and BL/BL-T1R. Similarly, CXCR3 expression was significantly (P<0.05) higher in BT- and BB- T1R in comparison to those without T1R. Difference in expression of all the three markers remained insignificant between BL and BL-T1R.
Fig. 2.
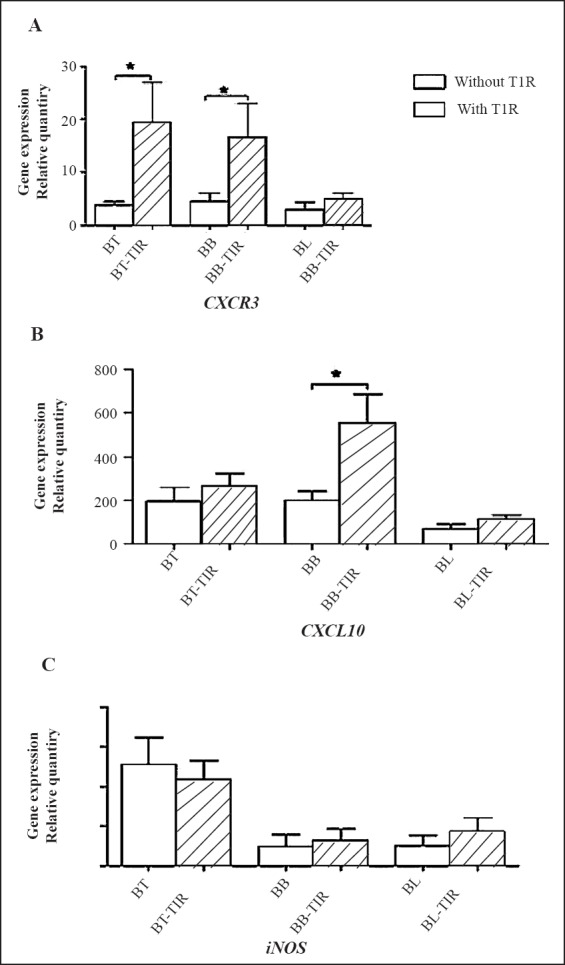
Comparative gene expression of CXCR3, CXCL10 and i-NOS in skin biopsies of leprosy patients with and without type 1 reaction (T1R) (n=5 in each group). Values are mean ± SD. BT, borderline tuberculoid leprosy; BB, mid borderline leprosy; BL, borderline lepromatous leprosy
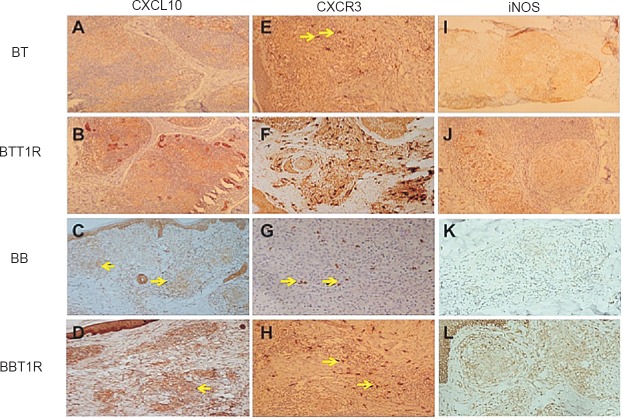
CXCL10, CXCR3, i-NOS and NF-kappa B immunoexpression in biopsies with and without T1R: IHC expressions of CXCL10, CXCR3, i-NOS and NF-kappa B in leprosy biopsies with and without T1R were studied in 65 biopsies but after undergoing IHC only 60 biopsies were found suitable for interpretation, BT (n=15), BT-T1R (n=15); BB (n=10), BB-T1R (n=10) and BL (n=5) and BL-T1R (n=5). The results are shown in Table II. The representative comparative IHC staining is shown in Fig. 3. A comparison of mRNA and protein expression for 30 patients for CXCR3, CXCL10 and i-NOS genes is shown in Table III which suggests corroboration between gene expression and immunoexpression of these markers.
Table II.
Immunohistochemical expression of i-NOS, CXCL10, CXCR3 and NFkB
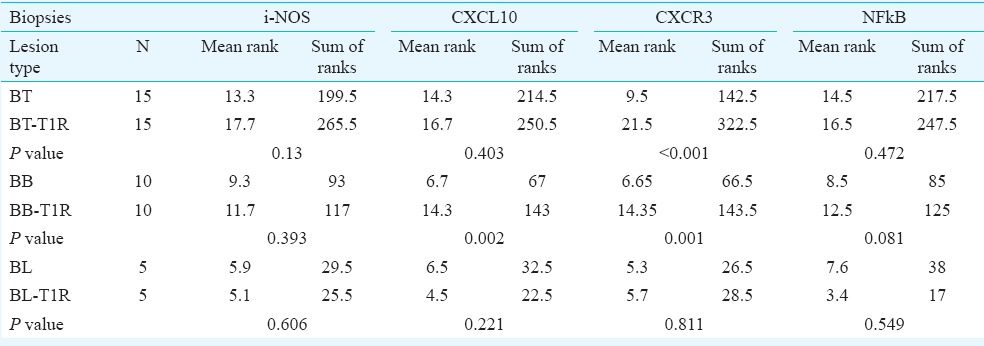
Fig. 3.
Immunohistochemical expression of CXCL10, (A-D), CXCR3 (E-H) and i-NOS (I-L) in borderline leprosy biopsies with and without reaction. BT, borderline tuberculoid leprosy; BB, mid borderline leprosy; BL, borderline lepromatous leprosy.
Table III.
Comparative expression of CXCR3, CXCL10 and i-NOS genes and protein in leprosy patients with and without T1R
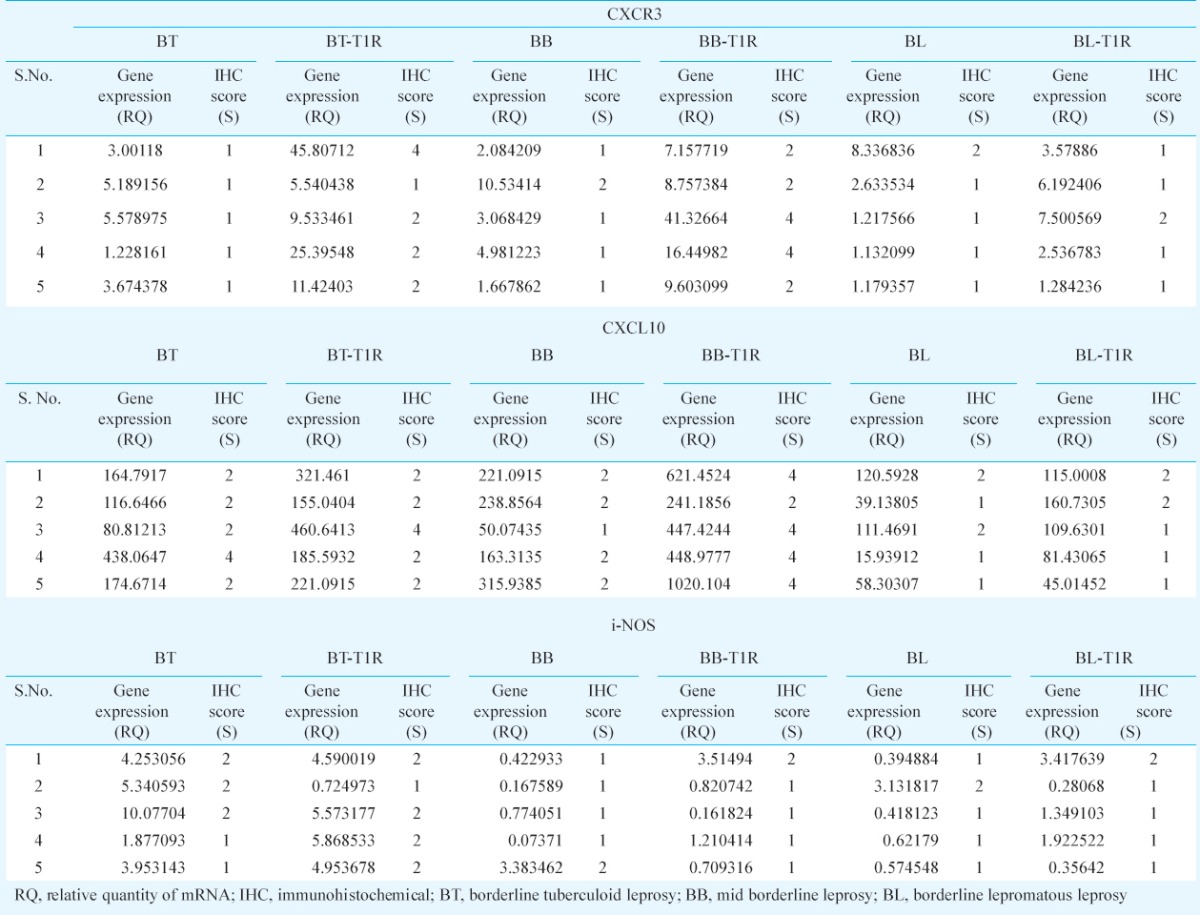
CXCL10 immunoexpression was seen localized in the cytoplasm of macrophages and epithelioid cells (Fig. 3A–D). CXCL10 staining was more intense in T1R biopsies in comparison with non-reactional BB leprosy. Corroborating with our gene expression results significant difference was seen between BB and BB-T1R (P<0.01) but not in other borderline leprosy. CXCR3 receptor was expressed selectively in the inflammatory cells and was localized on the cell membranes (Fig. 3E–H) and this localization was also confirmed on IF labelling (Fig. 4). It showed significant difference between BT and BT-T1R (P<0.001) and between BB and BB-T1R (P<0.001) which corroborated with gene expression study. Immunoexpression of i-NOS was localized in the cytoplasm of macrophages, epithelioid cells and giant cells of the granuolma in BT and the staining intensity was weak and dermal appendages did not stain. In comparison, BT-T1R sections showed stronger staining intensity with eccrine and sebaceous glands also getting stained (Fig. 3I–L). NF-kappa B expression was present in all the biopsies throughout the leprosy spectrum and was not significant in differentiating leprosy T1R from non-reactional leprosy.
Fig. 4.
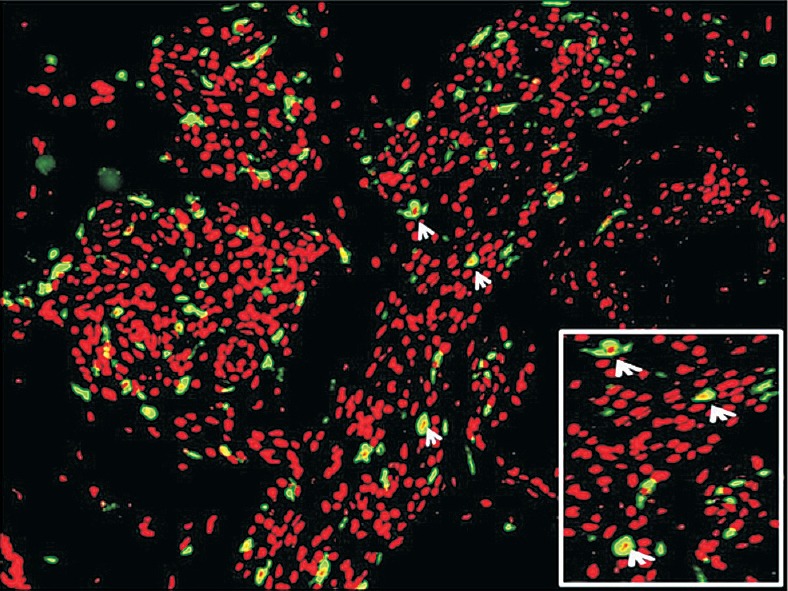
Immunofluorescent staining in leprosy patients with T1R showing localization of CXCR3 on the cell membrane (inset, arrows).
Discussion
India accounts for 58.8 per cent of total leprosy burden worldwide with 126,913 new cases reported in 201310. The prediction, early detection and timely treatment of leprosy reaction are key priorities in leprosy control and management. The epidemiological data of leprosy reactions show a wide variation with frequencies of T1R ranging between 8.9-30.1 per cent11,12. The patients are usually diagnosed clinically but skin biopsy is an important diagnostic tool that supports the clinical diagnosis. The histopathological features suggestive of T1R are dermal oedema, oedema and lymphocytes within the granuloma but due to lack of stringent diagnostic criteria and interobserver subjectivity these remain underdiagnosed histologically13.
Epidermal erosion and complete obliteration of the subepidermal grenz zone is a feature of primary tuberculoid (TT) leprosy but partial obliteration of grenz zone and erosion of basal epidermis is frequently seen in BT in T1R14. Increased number and size of Langhans giant cells and plasma cells have been previously reported as predictive factors of T1R13,15. We found a few plasma cells in the dermal cellular infiltrate in some of our biopsies. Iyer et al16 have demonstrated the presence of functionally active mature B-cells and plasma cells in leprosy borderline tuberculoid and lepromatous skin lesions. It is not yet fully understood whether there is a presence of B-cell directed event in leprosy.
T1R occurs as a result of increased activity of the immune system particularly of cell-mediated immune response fighting Mycobacterium lepre or remnants of the dead bacilli. It is characterized histopathologically by a shift towards the TT end of the leprosy spectrum with increased lymphocytic infiltration and decreased bacterial load. The direct cause of reaction is not whether bacilli are dead or alive but rather the changing status of immune response in each individual at a particular point in time17. T1Rs are mediated via the Th1 cells and the lesions in T1R express pro-inflammatory cytokines (IFN-γ, IL-12) and free radical producer i-NOS induced by transcription factor NF-kappa B18,19. In our study neither i-NOS gene expression nor i-NOS protein expression showed any significant differences between T1R and non-reactional BT, BB or BL leprosy.
The enhanced expression of CXCR3 after its interaction with CXCL10 is considered an important signal for selective homing of effector cells and trafficking of activated lymphocytes to the preferential inflammatory sites17. CXCR3+ cells also release Th1 cytokines potentially leading to further upregulation of CXCR3 ligands leading to T1R response and granuloma formation20. The granuloma formation not only helps kill the bacteria but also helps to restrict the inflammation preventing further spread21,22,23,24. In our study high expression of CXCL10 in both non-reactional and T1R biopsies further confirms the existence of this loop. Overall, the expression of CXCL10 was higher in BT, BB and BL leprosy with T1R compared to those without T1R. However, as a diagnostic aid we could only find significant difference between BB and BB-T1R. CXCL10 gave a more diffuse staining pattern with more profound difference in intensity than percentage positivity. This might make it less attractive diagnostic marker, since inter-observer variability is possible. This could be more useful where absolute quantification is possible as suggested by Stefani et al6.
CXCR3 expression on the other hand, was restricted to the cell membrane and was easier to quantify. A clear influx of CXCR3+ cells was visible in T1R cases in both BT and BB. While in BL, CXCR3+ cells were reduced dramatically. This could be due to diminished immune response towards the lepromatous pole.
The limitation of this study was that sequential pre- and post-T1R biopsies were not available to compare the expression of these markers for a better understanding of the changes evolving in a T1R. Also a long term follow up of the T1R patients was not available possibly because majority of leprosy patients who came to our hospital for treatment of acute reactions were migrants from neighbouring towns and villages and once their reactional episode is subsided with anti-inflammatory drugs, they are lost to follow up.
To conclude, our study showed increased gene and protein expression of CXCR3 in T1R in both mid-borderline and borderline tuberculoid leprosy as compared to expression of i-NOS. The role of this receptor-ligand complex may have potential to predict T1R. However, to conclusively confirm these findings, a study with larger sample size, sequential sampling during the course of leprosy reaction along with correlation with serum levels over a long-term follow up will provide useful insights into the molecular mechanism of T1R and help to possibly provide new therapeutic targets for treating T1R.
Acknowledgment
The authors acknowledge the Indian Council of Medical Research, New Delhi, for providing financial support for this study. The authors thank Shrimati Manjit Kaur for photomicrography and Shri Pushpraj, NIP, New Delhi for photoshop work.
Footnotes
Conflicts of Interest: None.
References
- 1.Spierings E, De Boer T, Zulianello L, Ottenhoff HM. Novel mechanisms in the immunopathogenesis of leprosy nerve damage: The role of Schwann cells, T cells and Mycobacteria leprae. Immunol Cell Biol. 2000;78:349–55. doi: 10.1046/j.1440-1711.2000.00939.x. [DOI] [PubMed] [Google Scholar]
- 2.Khanolkar-Young S, Snowdon D, Lockwood DNJ. Immunocytological localization of inducible nitric oxide synthase and transforming growth factor-beta (TGF-â) in leprosy lesions. Clin Exp Immunol. 1998;113:438–42. doi: 10.1046/j.1365-2249.1998.00669.x. [DOI] [PMC free article] [PubMed] [Google Scholar]
- 3.Schon T, Hernandez-Pando RH, Negesse Y, Leekassa R, Sundqvist T, Britton SE. Expression of inducible nitric oxide synthase and nitrotyrosine in borderline leprosy lesions. Br J Dermatol. 2001;145:809–15. doi: 10.1046/j.1365-2133.2001.04491.x. [DOI] [PubMed] [Google Scholar]
- 4.Schon T, Negussie G, Sundqvist T, Selassie H, Habetmariam HS, Engeda T, et al. Increased levels of nitric oxide metabolites in urine from leprosy patients in reversal reaction. Lepr Rev. 1999;70:52–5. doi: 10.5935/0305-7518.19990011. [DOI] [PubMed] [Google Scholar]
- 5.Little D, Khanolkar-Young S, Coulthart A, Suneetha S, Lockwood DNJ. Immunohistochemical analysis of cellular infiltrate and gamma interferon, interleukin-12 and inducible nitric oxide synthase expression in leprosy type 1 (reversal) reactions before and during prednisolone treatment. Infect Immun. 2001;69:3413–7. doi: 10.1128/IAI.69.5.3413-3417.2001. [DOI] [PMC free article] [PubMed] [Google Scholar]
- 6.Stefani MM, Guerra JG, Sousa ALH, Costa MB, Oliveira LW, Martelli CT, et al. Potential plasma markers of type 1 and type 2 leprosy reactions: a preliminary report. BMC Infect Dis. 2009;9:75. doi: 10.1186/1471-2334-9-75. [DOI] [PMC free article] [PubMed] [Google Scholar]
- 7.Scollard DM, Chaduvula MV, Martinez A, Fowlkes N, Nath I, Stryjewska BM, et al. Increased CXC Ligand 10 levels and gene expression in tpe 1 leprosy reactions. Clin Vaccine Immunol. 2011;18:947–53. doi: 10.1128/CVI.00042-11. [DOI] [PMC free article] [PubMed] [Google Scholar]
- 8.Ridley DS, Jopling WH. Classification of leprosy according to immunity. A five group system. Int J Lepr Other Mycobact Dis. 1966;34:255–73. [PubMed] [Google Scholar]
- 9.Livak KJ, Schmittgen TD. Analysis of relative gene expression data using real-time quantitative PCR and the 2(-Delta Delta C(T)) method. Methods. 2001;25:402–8. doi: 10.1006/meth.2001.1262. [DOI] [PubMed] [Google Scholar]
- 10.Global leprosy situation. WHO Wkly Epidemiol Record. 2014;89:389–400. [Google Scholar]
- 11.Lockwood DN, Vinaykumar S, Stanley JN, McAdam KP, Colston MJ. Clinical features and outcome of reversal (type 1) in Hyderabad, India. Int J Lepr Other Mycobact Dis. 1993;61:8–15. [PubMed] [Google Scholar]
- 12.Van Brakel WH, Khawas IB, Lucas SB. Reactions in leprosy: an epidemiological study of 386 patients in West Nepal. Lepr Rev. 1994;65:190–203. doi: 10.5935/0305-7518.19940019. [DOI] [PubMed] [Google Scholar]
- 13.Lockwood DN, Lucas SB, Desikan K, Ebenezer G, Suneetha S, Nicholls P. The histological diagnosis of leprosy Type 1 reactions: identification of key variables and an analysis of the process of histological diagnosis. J Clin Pathol. 2008;61:595–600. doi: 10.1136/jcp.2007.053389. [DOI] [PubMed] [Google Scholar]
- 14.Ridley DS. Skin biopsy in leprosy. Switzerland: Ciba-Geigy; 1977. Reactions; pp. 47–52. [Google Scholar]
- 15.Thomas M, Ponnaiya J, Emmanuel M, Richard J. Type 1 reaction in leprosy-A histopathological analysis. Indian J Lepr. 2013;85:1–4. [PubMed] [Google Scholar]
- 16.Iyer AM, Mohanty KK, van Egmond D, Katoch K, Faber WR, Das PK, et al. Leprosy specific B-cells within cellular infiltrates in active leprosy lesions. Hum Pathol. 2007;38:1065–73. doi: 10.1016/j.humpath.2006.12.017. [DOI] [PubMed] [Google Scholar]
- 17.Degang Y, Nakamura K, Akama T, Ishido Y, Lyo Y, Ishii N, et al. Leprosy as a model of immunity. Future Microbiol. 2014;9:43–54. doi: 10.2217/fmb.13.140. [DOI] [PubMed] [Google Scholar]
- 18.Xie QW, Kashiwabara Y, Nathan C. Role of transcription factor NFkB/Rel in induction of nitric oxide synthase. J Biol Chem. 1994;269:4705–8. [PubMed] [Google Scholar]
- 19.Karin M, Barnes PJ. Nuclear Factor-kappaB: a pivotal transcription factor in chronic inflammatory diseases. N Engl J Med. 1997;336:1066–71. doi: 10.1056/NEJM199704103361506. [DOI] [PubMed] [Google Scholar]
- 20.Garcia-Lopez MA, Sanchez-Madrid F, Rodriguez-Frade JM, Mellado M, Acevedo A, Garcia MI, et al. CXCR3 chemokine receptor distribution in normal and inflamed tissues: expression on activated lymphocytes, endothelial cells and dendritic cells. Lab Invest. 2001;81:409–18. doi: 10.1038/labinvest.3780248. [DOI] [PubMed] [Google Scholar]
- 21.Fuller CL, Flynn J JL, Reinhart TA. In-situ study of abundant expression of proinflammatory chemokines and cytokines in pulmonary granulomas that develop in cynomolgus macaques experimentally infected with Mycobacterium tuberculosis. Infect Immun. 2003;71:7023–34. doi: 10.1128/IAI.71.12.7023-7034.2003. [DOI] [PMC free article] [PubMed] [Google Scholar]
- 22.Stephanie N, Cross R, Fitzpatrick E. Chemokine production during hypersensitivity pneumonitis. Eur J Immunol. 2004;34:677–85. doi: 10.1002/eji.200324634. [DOI] [PubMed] [Google Scholar]
- 23.Algood HM, Lin PL, Flynn JL. Tumor necrosis factor and chemokine interaction in the formation and maintainance of granuloma in tuberculosis. Clin Infect Dis. 2005;41:S189–93. doi: 10.1086/429994. [DOI] [PubMed] [Google Scholar]
- 24.Agostini C, Cassatella M, Zambella R, Trentin L, Gasperin S, Perin A, et al. Involvement of IP-10 chemokine in sarcoid granulomatous reactions. J Immunol. 1998;141:6413–20. [PubMed] [Google Scholar]


