

Abstract
Objective
The diagnostic accuracy of cerebrospinal fluid (CSF) biomarkers for Alzheimer's disease (AD) must be improved before widespread clinical use. This study aimed to determine whether CSF Aβ42/Aβ40 and Aβ42/Aβ38 ratios are better diagnostic biomarkers of AD during both predementia and dementia stages in comparison to CSF Aβ42 alone.
Methods
The study comprised three different cohorts (n = 1182) in whom CSF levels of Aβ42, Aβ40, and Aβ38 were assessed. CSF Aβs were quantified using three different immunoassays (Euroimmun, Meso Scale Discovery, Quanterix). As reference standard, we used either amyloid (18F‐flutemetamol) positron emission tomography (PET) imaging (n = 215) or clinical diagnosis (n = 967) of well‐characterized patients.
Results
When using three different immunoassays in cases with subjective cognitive decline and mild cognitive impairment, the CSF Aβ42/Aβ40 and Aβ42/Aβ38 ratios were significantly better predictors of abnormal amyloid PET than CSF Aβ42. Lower Aβ42, Aβ42/Aβ40, and Aβ42/Aβ38 ratios, but not Aβ40 and Aβ38, correlated with smaller hippocampal volumes measured by magnetic resonance imaging. However, lower Aβ38, Aβ40, and Aβ42, but not the ratios, correlated with non‐AD‐specific subcortical changes, that is, larger lateral ventricles and white matter lesions. Further, the Aβ42/Aβ40 and Aβ42/Aβ38 ratios showed increased accuracy compared to Aβ42 when distinguishing AD from dementia with Lewy bodies or Parkinson's disease dementia and subcortical vascular dementia, where all Aβs (including Aβ42) were decreased.
Interpretation
The CSF Aβ42/Aβ40 and Aβ42/Aβ38 ratios are significantly better than CSF Aβ42 to detect brain amyloid deposition in prodromal AD and to differentiate AD dementia from non‐AD dementias. The ratios reflect AD‐type pathology better, whereas decline in CSF Aβ42 is also associated with non‐AD subcortical pathologies. These findings strongly suggest that the ratios rather than CSF Aβ42 should be used in the clinical work‐up of AD.
Introduction
Accumulation of β‐amyloid (Aβ) containing neuritic plaques is one of the core neuropathological characteristics of Alzheimer's disease (AD). Aβ is produced from a transmembrane Aβ precursor protein (APP), when the latter is sequentially cleaved by β‐ and γ‐secretase.1 Cleavage of APP by γ‐secretase generates a number of Aβ isoforms2 among which Aβ42, a 42 amino acid‐long peptide, has the highest propensity for aggregation3, 4 and appears to be the predominant species in neuritic plaques.5 Aβ42 in the cerebrospinal fluid (CSF) is an established biomarker of AD, and is used both in clinical trials and increasingly in clinical practice.6 Decreased CSF Aβ42 have been consistently found in the CSF of AD patients allowing discrimination from healthy aged controls with specificity and sensitivity between 80% and 90%.7 Postmortem studies have demonstrated inverse correlations between CSF Aβ42 and neuritic plaque burden suggesting that low levels of Aβ42 in CSF are caused by its deposition in the brain parenchyma.8, 9 While CSF analysis provides concentrations of soluble Aβ42, fibrillar amyloid plaques may be directly visualized using amyloid positron emission tomography (PET) imaging. A significant proportion of healthy individuals and patients with mild cognitive impairment (MCI) show discordant CSF Aβ42 and amyloid PET status, indicating that new algorithms for the use of CSF Aβ42 may improve its capacity to detect early amyloid pathology.10, 11 At the same time, reduced CSF levels of Aβ42 have also been found in non‐AD dementias such as vascular dementia (VaD), Parkinson's disease with dementia (PDD), and dementia with Lewy bodies (DLB).12 In these circumstances, the clinical utility of Aβ42 as AD biomarker is limited.
Besides Aβ42, several shorter isoforms of Aβ are present in CSF including Aβ40 and Aβ38.13 Some papers suggest that the CSF Aβ42/Aβ40 and Aβ42/Aβ38 ratios might improve discrimination of AD dementia from frontotemporal dementia (FTD) and/or DLB14, 15, 16 and improve prediction of AD in subjects with MCI compared to CSF Aβ42 alone.17 However, the Aβ42/Aβ40 and Aβ42/Aβ38 ratios have not yet been validated in large clinical cohorts and not against amyloid PET imaging. Further, the mechanisms underlying the improved diagnostic performance of Aβ42/Aβ40 and Aβ42/Aβ38 ratios are at present unknown. It is possible that these ratios may correct for interindividual variability in the overall Aβ production, since Aβ38 and Aβ40 are expected to increase due to higher overall Aβ production, but not decrease (in contrast to Aβ42) as a result of AD pathology. It is also possible that other non‐AD‐specific subcortical changes may affect global levels of all the three Aβ isoforms in the brain.18 Therefore, we evaluated whether the CSF Aβ42/Aβ40 and Aβ42/Aβ38 ratios would better reflect AD‐type pathology compared with CSF Aβ42 alone. This study comprised three different cohorts with 1182 individuals in total where we: (1) determined if the CSF Aβ42/Aβ40 and Aβ42/Aβ38 ratios measured using three different immunoassays showed improved agreement with amyloid (18F‐flutemetamol) PET imaging compared with CSF Aβ42; (2) investigated associations between CSF Aβ42, the Aβ42/Aβ40, and Aβ42/Aβ38 ratios with magnetic resonance imaging (MRI) measures of hippocampal volume, lateral ventricular volume, and white matter lesions; (3) studied if the CSF Aβ42/Aβ40 and Aβ42/Aβ38 ratios were more selective biomarkers for differentiating AD from other neurodegenerative dementias including VaD, DLB, and PDD.
Materials and Methods
Study populations
The study was approved by the Regional Ethics Committee in Lund, Sweden, and the patients and/or their relatives gave their informed consent (for research).
Cohort‐1
The study population stemmed from the prospective and longitudinal Swedish BioFINDER study (further information available at: www.biofinder.se). The included cases (n = 215) consisted of patients with mild cognitive complaints enrolled consecutively at three memory outpatient clinics in Sweden, who all had undergone 18F‐flutemetamol PET. The patients were referred for assessment of their cognitive complaints and were included between 2010 and 2014. They were thoroughly assessed for their cognitive complaints by physicians with special interest in dementia disorders. The inclusion criteria were: (1) cognitive symptoms; (2) not fulfilling the criteria for dementia; (3) a Mini‐Mental State Examination (MMSE) score of 24–30 points19; (4) age 60–80 years; and (5) fluent in Swedish. The exclusion criteria were: (1) cognitive impairment that without doubt could be explained by another condition (other than prodromal dementias); (2) severe somatic disease; and (3) refusing lumbar puncture or neuropsychological investigation. These criteria resulted in a clinically relevant population where 47% were classified as subjective cognitive decline, 40% as amnestic MCI, and 11% as non‐amnestic MCI. The classification was based on a neuropsychological battery assessing the cognitive domains of verbal ability, visuospatial construction, episodic memory, and executive functions and the clinical assessment by a senior neuropsychologist as described in Data S1. The characteristics of cohort‐1 are given in Table S1.
Cohort‐2
This study was performed at the Memory Clinic of Skåne University Hospital in Malmö. CSF samples were obtained from 53 cognitively healthy elderly subjects and from patients with stable MCI (sMCI, n = 62), MCI that subsequently developed AD dementia (MCI‐AD, n = 35), AD dementia (n = 75), subcortical VaD (n = 34), PDD or DLB (n = 47) as well as with FTD (n = 33). Diagnostic criteria in cohort‐2 are described in Data S1. The control population consisted of healthy elderly volunteers, who were recruited in the city of Malmö, Sweden. Inclusion criteria were (1) absence of memory complaints or any other cognitive symptoms; (2) preservation of general cognitive functioning; and (3) no active neurological or psychiatric disease. The characteristics of cohort‐2 are given in Table S2.
Cohort‐3
The study population stemmed from the prospective and longitudinal Swedish BioFINDER study (www.biofinder.se). We included healthy elderly controls (n = 328), cases with AD (n = 137), cases with PD (n = 128), and cases with PDD or DLB (n = 35). The same diagnostic criteria were used for AD, PD, and DLB as in cohort‐2. Subjects were eligible for inclusion in the cognitively healthy elderly cohort of the Swedish BioFINDER study if they (1) were aged ≥60 years old; (2) scored 28–30 points on MMSE; (3) did not suffer from any subjective cognitive impairment; and (4) were fluent in Swedish. Exclusion criteria included presence of significant neurologic disease (e.g., stroke, Parkinson's disease, multiple sclerosis), severe psychiatric disease (e.g., severe depression or psychotic syndromes), dementia or MCI. The characteristics of cohort‐3 are given in Table S3.
CSF sampling and analysis
The procedure and analysis of the CSF followed the Alzheimer's Association Flow Chart for CSF biomarkers.7 Lumbar CSF samples were collected at the three centers and analyzed according to a standardized protocol.7, 20 CSF Aβ42, Aβ40, and Aβ38 were analyzed by Euroimmun (EI) (EUROIMMUN AG, Lübeck, Germany) and Meso Scale Discovery (MSD) (Rockville, MD) immunoassays. CSF Aβ40 and Aβ42 were also analyzed using Quanterix (Quanterix, Lexington, MA) immunoassay. The EI assays were used to measure CSF Aβ (1–42, 1–40, and 1–38) in all three cohorts. In addition, in cohort‐1, all the CSF samples were analyzed with MSD kit (specific for AβN‐42, AβN‐40 and AβN‐38) and 70 CSF samples were analyzed using Quanterix kit (specific for AβN‐42 and AβN‐40).
Brain imaging
18F‐flutemetamol PET in cohort 1
Cerebral Aβ deposition was visualized with the PET tracer 18F‐flutemetamol (approved by the Food and Drug Administration, and the European Medical Agency). PET/CT scanning of the brain was conducted at two sites using the same type of scanner (Gemini, Philips Healthcare, Best, the Netherlands). Sum images from 90–110 min postinjection were analyzed using the software NeuroMarQ (GE Healthcare, Cleveland, OH). A volume of interest (VOI) template was applied for the following nine bilateral regions: prefrontal, parietal, lateral temporal, medial temporal, sensorimotor, occipital, anterior cingulate, posterior cingulate/precuneus, and a global neocortical composite region.21 The standardized uptake value ratio (SUVR) was defined as the uptake in a VOI normalized for the cerebellar cortex uptake.
Magnetic resonance imaging in cohort 1
All patients were examined using a single‐3T MR scanner (Trio; Siemens, Munich, Germany). The volumes of hippocampus and the lateral ventricles were analyzed with Volbrain 1.0.22 Quality control of the segmentation of subcortical structures on MRI images was done by visual inspection of all included subjects. Automated segmentation of white matter lesions was performed using the Lesion Segmentation Tool (LST) implemented in SPM8 (http://www.applied-statistics.de/lst.html); this generated a total white matter lesion volume (mL) for each individual. Prior to this, manual segmentation for reference of white matter lesions was performed on FLAIR images coregistered to the native MPRAGE in four MCI patients, with the segmented volume ranging from 0.5 to 106.3 mL; the resulting optimal κ based on the Dice coefficient was 0.423 and was used in the subsequent automated segmentation for all participants. The protocol comprised axial T2 FLAIR imaging (IPAT factor = 0, TR/TE/TI = 9000/89/2500 msec, 27 slices, reconstructed image resolution 0.7 × 0.7 × 5.2 mm3, acquisition time 4.14 min), and a coronal MPRAGE sequence (IPAT factor = 0, TR/TE/flip angle = 1950/3 msec/9°, 180 slices, slice thickness 1.2 mm, image resolution 1 × 1 × 1.2 mm3, acquisition time 6.02 min).
Computed tomography and magnetic resonance imaging in cohort 2
In cohort 2, 310 cases underwent CT (n = 266) and MRI (n = 44) examinations. Using axial CT or MRI images, Evan's index was calculated by dividing the distance between the frontal horns of the lateral ventricles at the level of foramen Monroi with the maximal internal diameter of the skull in the same plane.
Statistical analyses
SPSS (IBM, Armonk, NY) and R version 3.1.224 were used for statistical analysis. White matter lesion volumes were skewed and therefore ln‐transformed before statistical analysis. Linear regressions were used to investigate associations between a continuous‐dependent variable and continuous or categorical independent variables. For groupwise comparisons, we used univariate general linear models. Univariate logistic regression models were employed to predict a dichotomized categorical variable from categorical and continuous independent variables. To control the confounding factors, age and sex were included in all the regression models. 95% confidence intervals for β‐coefficients from linear regression models were estimated by a bootstrap procedure (n = 1000). To test if CSF biomarkers had different associations with different MRI measures (hippocampal volume, lateral ventricular volume and white matter lesions volume), we compared MRI measures pairwise and used linear mixed‐effects models after concatenating two (standardized) response vectors (the MRI measures being compared, for example hippocampus and lateral ventricle). We included an interaction between a factor for MRI measure and CSF biomarker, as a predictor. When this interaction was significant, it indicated that the tested biomarker had different statistical effects on the two included MRI measures. The models also included age, sex, and both main effects as predictors. All models included a random intercept and a random term for MRI measure. Area under the curve (AUC) of two receiver operating characteristic (ROC) curves were compared with DeLong test.25 Youden's J index was calculated as sensitivity + specificity − 1 for each of the points of the ROC curve. The optimal cutoff was defined as corresponding to the highest J index. P < 0.05 was considered statistically significant.
Results
CSF Aβ isoforms and amyloid PET imaging (cohort‐1)
To determine how well different CSF Aβ isoforms could distinguish patients in cohort‐1 with abnormal (PET+) and normal (PET−) amyloid PET, we compared the concordance between 18F‐flutemetamol imaging and CSF Aβ42, the Aβ42/Aβ40, and Aβ42/Aβ38 ratios measured with EI, MSD, and Quanterix immunassays. We have recently established that composite SUVR of 18F‐flutemetamol data show bimodal distribution and could be separated in two populations using mixture modeling analysis that generated the cutoff >1.42 SUVR for abnormally increased Aβ deposition.20 When using CSF values derived from the EI immunoassay, we found that Aβ42 outperformed Aβ40 and Aβ38 in terms of accuracy, specificity, and sensitivity (Table 1). When comparing AUCs of individual ROC curves, the Aβ42/Aβ40 and Aβ42/Aβ38 ratios performed significantly better than Aβ42 alone (P = 0.008 and 0.007; Table 1, Fig. 1A) whereas there was no difference between the Aβ42/Aβ40 and the Aβ42/Aβ38 ratios (P = 0.242). The results were the similar when Aβ isoforms were measured using the MSD and the Quanterix immunoassay (Table 1, Fig. 1B and C).
Table 1.
ROC analysis of CSF Aβ42, Aβ40, Aβ38, the Aβ42/Aβ40, and Aβ42/Aβ38 ratios for detecting abnormal (≥1.42) and normal (<1.42) amyloid PET
| AUC | Cutoff | Youden's J index | Sensitivity | Specificity | |
|---|---|---|---|---|---|
| Euroimmun | |||||
| Aβ42 | 0.894, 95% CI = 0.850–0.937, P < 0.001 | <507.5 pg/mL | 0.665 | 0.832 | 0.833 |
| Aβ40 | 0.556, 95% CI = 0.480–0.633, P = 0.153 | >3830 pg/mL | 0.115 | 0.722 | 0.393 |
| Aβ38 | 0.569, 95% CI = 0.492–0.646, P = 0.081 | >1662 pg/mL | 0.191 | 0.630 | 0.561 |
| Aβ42/Aβ40 | 0.954a, 95% CI = 0.923–0.986, P < 0.001 | <0.10 | 0.852 | 0.972 | 0.880 |
| Aβ42/Aβ38 | 0.943b, 95% CI = 0.911–0.975, P < 0.001 | <0.29 | 0.814 | 0.925 | 0.889 |
| MSD | |||||
| Aβ42 | 0.916, 95% CI = 0.876–0.956, P < 0.001 | <495.9 pg/mL | 0.739 | 0.850 | 0.889 |
| Aβ40 | 0.559, 95% CI = 0.483–0.636, P = 0.132 | >6117 pg/mL | 0.145 | 0.500 | 0.645 |
| Aβ38 | 0.566, 95% CI = 0.490–0.643, P = 0.093 | >3121 pg/mL | 0.136 | 0.435 | 0.701 |
| Aβ42/Aβ40 | 0.975c, 95% CI = 0.952–0.998, P < 0.001 | <0.09 | 0.907 | 0.953 | 0.954 |
| Aβ42/Aβ38 | 0.964d, 95% CI = 0.935–0.992, P < 0.001 | <0.17 | 0.889 | 0.972 | 0.917 |
| Quanterix | |||||
| Aβ42 | 0.810, 95% CI = 0.707–0.913, P < 0.001 | <1742 pg/mL | 0.508 | 0.733 | 0.775 |
| Aβ40 | 0.590, 95% CI = 0.450–0.730, P = 0.200 | >11,328 pg/mL | 0.317 | 0.750 | 0.567 |
| Aβ42/Aβ40 | 0.912e, 95% CI = 0.834–0.991, P < 0.001 | <0.16 | 0.800 | 0.900 | 0.900 |
ROC, receiver operating characteristic; CSF, cerebrospinal fluid; PET, positron emission tomography; AUC, area under the curve; MSD, Meso Scale Discovery.
a P=0.008, b P=0.007, c P<0.001, d P=0.007 and e P=0.002 when comparing to Aβ42 AUC.
Figure 1.
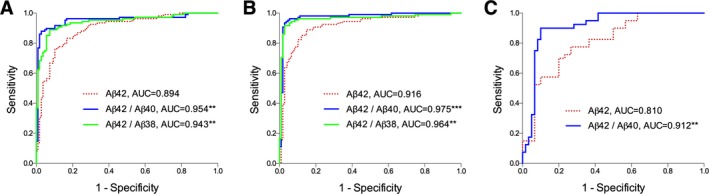
ROC curves of CSF Aβ42 and the Aβ42/Aβ40 and Aβ42/Aβ38 ratios for discriminating abnormal (≥1.42) and normal (<1.42) amyloid PET. Aβ isoforms were measured in 108 PET‐positive and 107 PET‐negative cases using the Euroimmun (A) and MSD (B) immunoassays, and in 40 PET‐positive and 30 PET‐negative cases using the Quanterix immunoassay (C); **P < 0.01, ***P < 0.001 when comparing to Aβ42 AUC. ROC, receiver operating characteristic; CSF, cerebrospinal fluid; PET, positron emission tomography; MSD, Meso Scale Discovery; AUC, area under the curve.
Based on the optimal cutoff points corresponding to the highest Youden's J indices (Table 1), we dichotomized CSF Aβ variables (derived from the EI assay) into abnormal (Aβ +) and normal (Aβ −) values. Logistic regression was used to predict probability of abnormal or normal PET composite score with dichotomized Aβ variables as predictors. Overall prediction success rate for the model including Aβ42 was 83% (odds ratio 25, 95% CI 12–51, P < 0.001). Prediction success rate increased to 93% for the Aβ42/Aβ40 ratio (odds ratio 253, 95% CI 70–916, P < 0.001) and 91% for the Aβ42/Aβ38 ratio (odds ratio 99, 95% CI 39–253, P < 0.001). The results were similar when adjusting for confounding effect of global cognition (MMSE score), APOE genotype, and education (data not shown). Cohen's κ for Aβ42, the Aβ42/Aβ40, and Aβ42/Aβ38 ratios were 66%, 85%, and 81%, respectively which suggests very good agreement between amyloid PET data and the CSF Aβ ratios26 (Fig. 2A–C). Very comparable results were obtained using the MSD and Quanterix immunoassays (Fig. 2D–F, Table S4, Fig. S1).
Figure 2.

Scatterplots of CSF Aβ42 and the Aβ42/Aβ40 and Aβ42/Aβ38 ratios and amyloid PET SUVR values. (A–C) depict CSF values derived from the Euroimmun immunoassay. Horizontal lines represent optimal cutoffs for Aβ42 (A, cut off 507.5 pg/mL, 83% was identified identically with CSF and PET), Aβ42/Aβ40 (B, cut off 0.10, 93% was identified identically with CSF and PET) and Aβ42/Aβ38 (C, cut off 0.29, 91% was identified identically with CSF and PET) corresponding to the highest Youden's J indices. (D and E) depict CSF values derived from the MSD immunoassay. Horizontal lines represent optimal cutoffs for Aβ42 (D, cut off 495.9 pg/mL, 87% was identified identically with CSF and PET), Aβ42/Aβ40 (E, cut off 0.09, 95% was identified identically with CSF and PET) and Aβ42/Aβ38 (F, cut off 0.17, 93% was identified identically with CSF and PET). The PET cutoff 1.42 has been defined previously.20 CSF, cerebrospinal fluid; PET, positron emission tomography; SUVR, standardized uptake value ratio.
Additional analyses were performed to better understand the effects of using the CSF Aβ42/Aβ40 ratio instead of CSF Aβ42 measurements alone. First, we plotted combinations of CSF Aβ42 and CSF Aβ42/Aβ40 as a function of amyloid PET (using standardized CSF measures; EI Fig. 3A and MSD Fig. 3C). This suggested that the CSF Aβ42/Aβ40 ratio had different effects in subjects with low versus high amyloid PET levels. Specifically, in subjects with low amyloid PET levels, the CSF Aβ42/Aβ40 ratio primarily adjusted low CSF Aβ42 toward higher (more normal) levels, and in subjects with intermediate amyloid PET levels, the CSF Aβ42/Aβ40 ratio primarily adjusted high CSF Aβ42 toward lower (more pathological) levels. This corresponded to a different classification of pathological versus normal amyloid status when using the CSF Aβ42/Aβ40 ratio. For the MSD assays (Fig. 3D), 15 subjects who were classified as pathological by CSF Aβ42 were reclassified as normal by the CSF Aβ42/Aβ40 ratio (12 [80%] of these had normal amyloid PET levels), and eight subjects who were classified as normal by CSF Aβ42 were reclassified as pathological by the CSF Aβ42/Aβ40 ratio (all [100%] of these had pathological amyloid PET levels). The results were very similar for the EI assay (Fig. 3B).
Figure 3.

Effects of using the CSF Aβ42/Aβ40 ratio instead of the CSF Aβ42 measurement alone. The CSF values derived from the EI assay are given in (A and B) and values from the MSD assay are given in (C and D). (A and C) depict the differences between standardized CSF Aβ42/Aβ40 ratio and CSF Aβ42 (y‐axis) as a function of amyloid PET (x‐axis). Cases where the ratio was lower than CSF Aβ42 alone are indicated by solid gray lines and cases where the ratio was higher than CSF Aβ42 alone are indicated by dashed red lines. A local regression line suggested that the ratio adjusted the results upwards mainly in the low amyloid PET range and downwards mainly in the medium‐high amyloid PET range. (B and D) depict the change in classification of subjects when using the CSF Aβ42/Aβ40 ratio instead of CSF Aβ42 alone (based on cutoffs presented in Table 1). Green and red circles indicate that subjects were consistently classified as normal or pathological, respectively, when using CSF Aβ42 alone or the ratio. Blue dots indicate that subjects changed classification from pathological to normal when using the ratio, and orange dots indicate that subjects changed classification from normal to pathological when using the ratio. CSF, cerebrospinal fluid; EI, Euroimmun; MSD, Meso Scale Discovery; PET, positron emission tomography.
CSF Aβ isoforms and MRI measures (cohort‐1)
Next, we wanted to understand why the ratios perform better than Aβ42 alone. We hypothesized that the ratios better reflect AD‐type pathology (such as hippocampal atrophy), but are not associated with imaging features not specific for AD such as white matter lesions and enlarged lateral ventricles. We found that lower CSF Aβ42, Aβ42/Aβ40, and Aβ42/Aβ38 ratios were associated with smaller hippocampal volumes (Table 2). No such correlations were observed for either Aβ40 or Aβ38. Further, lower levels of Aβ42, Aβ40, and Aβ38, but not the Aβ42/Aβ40 or Aβ42/Aβ38 ratios, were all associated with larger volumes of the lateral ventricles and white matter lesions (Table 2). When directly comparing the associations between CSF biomarkers and different MRI measures using linear mixed‐effects models, we found that CSF Aβ42, Aβ42/Aβ40, and Aβ42/Aβ38 ratios had significantly greater associations with hippocampal volume than with ventricular volume and white matter lesions (data not shown).
Table 2.
Associations between CSF biomarkers and MRI measures including hippocampal volume, lateral ventricular volume and white matter lesions volume
| Hippocampal volume | Lateral ventricular volume | White matter lesion volume | |
|---|---|---|---|
| Aβ38 | β = −0.056, P = 0.416 (−0.193, 0.081) | β = −0.433, P < 0.001 (−0.525, −0.341) | β = −0.256, P < 0.001 (−0.358, −0.154) |
| Aβ40 | β = −0.044, P = 0.533 (−0.191, 0.103) | β = −0.381, P < 0.001 (−0.475, −0.288) | β = −0.273, P < 0.001 (−0.382, −0.163) |
| Aβ42 | β = 0.177, P = 0.009 (0.061, 0.293) | β = −0.186, P = 0.004 (−0.285, −0.088) | β = −0.170, P = 0.010 (−0.308, −0.032) |
| Aβ42/Aβ40 | β = 0.234, P < 0.001 (0.117, 0.350) | β = 0.127, P = 0.060 (0.017, 0.237) | β = 0.052, P = 0.429 (−0.072, −0.177) |
| Aβ42/Aβ38 | β = 0.226, P = 0.001 (0.107, 0.344) | β = 0.037, P = 0.574 (−0.072, 0.146) | β = −0.037, P = 0.568 (−0.180, 0.105) |
Data are derived from linear regression models adjusting age and sex. β, standardized coefficient; data are presented as β (95% confidence interval); significant results are shown in bold. CSF, cerebrospinal fluid; MRI, magnetic resonance imaging.
CSF Aβ isoforms in AD and non‐AD dementia (cohort‐2)
Now, we wanted to establish whether CSF Aβ42/Aβ40 and Aβ42/Aβ38 ratios are significantly better than CSF Aβ42 alone to distinguish patients with AD dementia from those with non‐AD dementias, including non‐AD patients with subcortical pathology. To this end, we measured CSF levels of Aβ42, Aβ40, and Aβ38 in cohort‐2 that included healthy controls, patients with stable MCI, MCI who later developed AD, AD dementia, PDD/DLB, VaD, and FTD. Majority of individuals in cohort‐2 (310 out of 339) underwent CT or MRI (but not PET). CSF Aβ42 levels did not differ between AD and PDD/DLB, but were decreased in AD compared to controls, sMCI, VaD, and FTD (Fig. 4A). However, the Aβ42/Aβ40 and Aβ42/Aβ38 ratios were lower in AD compared to all the other diagnostic groups (Fig. 4D and E). Aβ40 and Aβ38 were lower in PDD/DLB and VaD groups compared to AD group (Fig. 4B and C). Differences between AD and other non‐AD dementias were more pronounced for Aβ42/Aβ40 and Aβ42/Aβ38 than for Aβ42 alone (Fig. 4A, D and E, Table S2).
Figure 4.

Aβ42, Aβ40, Aβ38, Aβ42/Aβ40 ratio, and Aβ42/Aβ38 ratio in the CSF of patients with different forms of dementia, sMCI and healthy controls. (A–E) Aβ42, Aβ40, Aβ38, Aβ42/Aβ40 ratio, and Aβ42/Aβ38 ratio in the CSF of healthy controls (n = 53) and patients with sMCI (n = 62 for Aβ42, Aβ40; n = 61 for Aβ38), AD (n = 110), PDD/DLB (n = 47), VaD (n = 34 for Aβ42, Aβ40; n = 33 for Aβ38) and FTD (n = 33). Data are presented as mean ± 95% CI; p values are from univariate general linear models controlling for age and sex; *P < 0.05; **P < 0.01; ***P < 0.001, ****P < 0.0001. (F) ROC curves of CSF Aβ42, Aβ42/Aβ40 ratio and Aβ42/Aβ38 ratio for discriminating AD from non‐AD dementias; ***P < 0.001 when comparing to Aβ42 AUC. CSF, cerebrospinal fluid; sMCI, stable mild cognitive impairment; AD, Alzheimer's disease; PDD, Parkinson's disease with dementia; DLB, dementia with Lewy bodies; VaD, vascular dementia; FTD, frontotemporal dementia; ROC, receiver operating characteristic; AUC, area under the curve.
We used ROC analysis to examine whether the Aβ42/Aβ40 and Aβ42/Aβ38 ratios improve the diagnostic accuracy of AD (the results are summarized in Table 3). We found that both ratios performed significantly better than Aβ42 when distinguishing patients with AD from those with PDD/DLB and VaD, as well as from those with non‐AD dementias as a whole group (Table 3, Fig. 4F).
Table 3.
ROC analysis of CSF Aβ42, Aβ42/Aβ40 ratio and Aβ42/Aβ38 ratio for differentiating AD from other diagnostic groups in cohort‐2
| AUC, 95% CI | AUC difference vs. Aβ42 (P‐value) | |
|---|---|---|
| AD vs. sMCI | ||
| Aβ42 | 0.817, 0.743–0.890, P < 0.001 | |
| Aβ42/Aβ40 | 0.879, 0.823–0.936, P < 0.001 | 0.062 (0.028a) |
| Aβ42/Aβ38 | 0.856, 0.790–0.923, P < 0.001 | 0.039 (0.222) |
| AD vs. PDD/DLB | ||
| Aβ42 | 0.583, 0.476–0.690, P = 0.100 | |
| Aβ42/Aβ40 | 0.792, 0.707–0.877, P < 0.001 | 0.209 (<0.001a) |
| Aβ42/Aβ38 | 0.796, 0.710–0.883, P < 0.001 | 0.213 (<0.001a) |
| AD vs. VaD | ||
| Aβ42 | 0.698, 0.580–0.816, P < 0.001 | |
| Aβ42/Aβ40 | 0.880, 0.814–0.946, P < 0.001 | 0.182 (<0.001a) |
| Aβ42/Aβ38 | 0.860, 0.786–0.935, P < 0.001 | 0.162 (<0.001a) |
| AD vs. FTD | ||
| Aβ42 | 0.937, 0.890–0.984, P < 0.001 | |
| Aβ42/Aβ40 | 0.946, 0.891–1.000, P < 0.001 | 0.009 (0.746) |
| Aβ42/Aβ38 | 0.961, 0.912–1.000, P < 0.001 | 0.024 (0.291) |
| AD vs. PDD/DLB and VaD | ||
| Aβ42 | 0.630, 0.546–0.715, P = 0.002 | |
| Aβ42/Aβ40 | 0.828, 0.767–0.890, P < 0.001 | 0.198 (<0.001a) |
| Aβ42/Aβ38 | 0.823, 0.759–886, P < 0.001 | 0.193 (<0.001a) |
| AD vs. non‐AD dementias | ||
| Aβ42 | 0.720, 0.651–0.788, P < 0.001 | |
| Aβ42/Aβ40 | 0.863, 0.813–0.912, P < 0.001 | 0.143 (<0.001a) |
| Aβ42/Aβ38 | 0.863, 0.813–0.913, P < 0.001 | 0.143 (<0.001a) |
The P‐values are for comparisons of AUC for the Aβ42/Aβ40 and Aβ42/Aβ38 ratios versus AUC for Aβ42. CSF values derived from the Euroimmun immunoassay. ROC, receiver operating characteristic; CSF, cerebrospinal fluid; AD, Alzheimer's disease; AUC, area under the curve; sMCI, stable mild cognitive impairment; PDD, Parkinson's disease with dementia; DLB, dementia with Lewy bodies; VaD, vascular dementia; FTD, frontotemporal dementia.
Significantly improved accuracy of the Aβ42/Aβ40 and Aβ42/Aβ38 ratios.
Similar to cohort‐1, all CSF Aβ isoforms, but not the ratios, inversely correlated with the size of the lateral ventricles in cohort‐2 (Aβ38, P < 0.001; Aβ40, P < 0.001; Aβ42, P = 0.015).
CSF Aβ isoforms in AD, PD, and PDD/DLB (cohort‐3)
To further validate our findings, we analyzed CSF levels of Aβ42, Aβ40, and Aβ38 in an additional cohort consisting of healthy controls and patients with AD, PD, and PDD/DLB. In agreement with the findings in cohort‐2, Aβ40 and Aβ38 levels were lower in the PDD/DLB group compared to the AD group and the separation between AD and PDD/DLB groups was more distinct for the Aβ42/Aβ40 and Aβ42/Aβ38 ratios than for Aβ42 (Fig. S2A–E). Furthermore, compared to Aβ42, the Aβ42/Aβ40, and Aβ42/Aβ38 ratios showed improved accuracy in distinguishing AD from PDD/DLB (P = 0.024 and P < 0.001, Fig. S2F).
Correlations between different CSF Aβ isoforms (cohort‐3)
We studied whether the different CSF Aβ species correlated in healthy elderly, which could indicate that all the three CSF Aβ species are affected similarly by interindividual differences in the underlying Aβ production. The correlations between CSF levels of Aβ42, Aβ40, and Aβ38 were investigated in healthy elderly group in cohort‐3 because it included the largest number of cases. In this group, Aβ42 positively correlated with CSF Aβ40 (Spearman's r = 0.568, P < 0.001) and CSF Aβ38 (Spearman's r = 0.484, P < 0.001).
Discussion
The main finding of this study is that the CSF Aβ42/Aβ40 and Aβ42/Aβ38 ratios are superior biomarkers of AD pathology compared with Aβ42 alone, which is independent on the applied immunoassay technology. Firstly, using three different immunoassays already used in the field of AD, we showed that the CSF Aβ42/Aβ40 and Aβ42/Aβ38 ratios predicted cortical accumulation of Aβ fibrils (measured with amyloid PET) with higher accuracy than Aβ42 alone. Secondly, the CSF Aβ42/Aβ40 and Aβ42/Aβ38 ratios improved differentiation of AD from non‐AD dementias, especially from PDD/DLB and VaD.
Most of the previous studies have found a strong association between CSF Aβ42 and amyloid PET measurements. However, in these studies, 10–20% of healthy individuals and MCI patients show mismatch in CSF Aβ42 and amyloid PET status.10, 11, 20 To the best of our knowledge, this study is first to demonstrate that the CSF Aβ42/Aβ40 and Aβ42/Aβ38 ratios better predict abnormal cortical amyloid deposition (visualized with PET) compared with Aβ42. The ratios increased the classification performance both for people who were falsely classified as positive (by low CSF Aβ42) and for people who were falsely classified as negative (by high CSF Aβ42). In line with our findings, a positive correlation between the CSF Aβ38/Aβ42 ratio and cortical amyloid load (assessed with Pittsburgh compound B PET) has been reported in cognitively healthy individuals.27, 28
There are several potential explanations for improved concordance between amyloid PET and CSF Aβ, when using the CSF Aβ42/Aβ40 and Aβ42/Aβ38 ratios instead of Aβ42. It might be that subcortical pathologies not specific to AD cause reduced levels of CSF Aβ42. Some studies have found low CSF Aβ42 levels in multiple system atrophy and multiple sclerosis.27, 28 In this study, we show that in patients with mild cognitive complaints, low CSF Aβ42, Aβ40, and Aβ38 were all linked to subcortical injury, including increased white matter lesions and enlarged lateral ventricles. The mechanisms underlying these associations are likely related to dysregulation in APP pathways with a general decline in the production of Aβ.18 Subcortical injury is accompanied by psychomotor slowing29, 30 and preclinical studies suggest that levels of Aβ are modulated by neuronal activity.31, 32, 33 Thus, subcortical injury might result in reduced activity in neuronal networks and thereby diminished production of all Aβ species, including Aβ42. However, in accordance with earlier investigations,34, 35 we found that low CSF levels of Aβ42, but not Aβ40 and Aβ38, were associated with more AD‐specific neurodegeneration (i.e., hippocampal atrophy). Altogether, these results indicate that an isolated drop in CSF Aβ42 is more specific for AD‐type pathology, whereas lower CSF levels of all three Aβ isoforms might be associated with subcortical damage in general. In fact, we observed reduced levels of all three Aβ species in PDD/DLB and VaD, disorders that are accompanied by subcortical changes. Further, the Aβ42/Aβ40 and Aβ42/Aβ38 ratios showed 23–36% increase in accuracy compared to Aβ42 alone when differentiating AD from PDD/DLB and VaD (or from non‐AD dementias as a whole group), which is in keeping with previous investigations.17, 36
A second explanation for the improved diagnostic accuracy of the Aβ42/Aβ40 and Aβ42/Aβ38 ratios could be that differences in the overall production and clearance of Aβ probably contribute to interindividual variability in total CSF Aβ levels. This is supported by the present finding that in CSF Aβ42 correlate Aβ38 and Aβ40 even in healthy controls. Consequently, when detecting Aβ42 brain pathology with CSF Aβ42, using ratios to Aβ40 or Aβ38 might correct for interindividual differences in total Aβ levels.15 Total tau (t‐tau) and phospho‐tau (t‐tau) are biomarkers of neurofibrillary tangles and neurodegeneration7 and other studies have shown increased diagnostic performance of the Aβ42/t‐tau ratio37, 38, 39 and Aβ42/p‐tau ratio in AD,40, 41 but such ratios could be altered due to an isolated increase in CSF tau as seen in, for example brain ischemia or in Creutzfeldt–Jakob disease.42, 43
One potential limitation of this study is the lack of cases with histologically confirmed amyloid pathology. However, supporting the validity of our findings, amyloid PET data show very strong agreement with postmortem plaque measurements.44, 45, 46
In conclusion, we established that the CSF Aβ42/Aβ40 and Aβ42/Aβ38 ratios increase the level of precision in detecting AD Aβ pathology during both predementia and dementia stages. The introduction of these ratios in clinical practice as well as in clinical trials would be an important step forward to improve the diagnostic work‐up of AD.
Author Contributions
S. J., H. Z., N. M., S. P., H. V., O. L., D. v. W., E. S., L. N., K. B., O. H. collected the data and reviewed the manuscript for intellectual content. S. J. and O. H. analyzed and interpreted the data, prepared figures and cowrote the manuscript. O. H. was the principal designer and coordinator of the study and overviewed collection, analysis and interpretation of the study data.
Conflict of Interest
Dr Blennow has served at advisory boards for IBL International, Pfizer, Roche Diagnostics, Lilly and Kyowa Kirin Pharma. Dr Hansson has served at advisory boards for GE Healthcare. Dr Vanderstichele is a cofounder of ADx NeuroSciences and a founder of Biomarkable bvba. Drs Janelidze, Zetterberg, Mattsson, Palmqvist, Lindberg, van Westen, Stomrud, Minthon report no disclosures.
Supporting information
Data S1. Supplementary methods.
Table S1. Cohort 1 characteristics.
Table S2. Cohort 2 characteristics.
Table S3. Cohort 3 characteristics.
Table S4. Logistic regression analysis for predicting abnormal or normal PET using CSF Aβ measurements derived from MSD and Quanterix immunoassays.
Figure S1. Scatterplots of CSF Aβ42 and Aβ42/Aβ40 ratio (Quanterix immunoassay) and amyloid PET scores.
Figure S2. Aβ42, Aβ40, Aβ38, the Aβ42/Aβ40 and Aβ42/Aβ38 ratio (Euroimmun immunoassay) in the CSF of patients with AD, PD, DLB/PDD and healthy controls.
Acknowledgments
The authors thank the collaborators of this study and the entire BioFINDER Study group (www.biofinder.se), including Susanna Vestberg for classifying the MCI‐AD patients into MCI subgroups, Katarina Nägga for clinical evaluations of cognitively healthy individuals, Per Wollmer and Douglas Hägerström for help with 18F‐flutemetamol PET imaging, and Karin Nilsson, Rosita Nordkvist, Ida Friberg and Cecilia Dahl for organizing inclusions and assessments. Thanks to Leentje Demeyer, Erik Stoops, and Kimberley Mauroo for analysis of the CSF samples for the collection study. Thanks to EUROIMMUN for the delivery of the ELISA assays for the study. The study was supported by the European Research Council, the Swedish Research Council, the Strategic Research Area MultiPark (Multidisciplinary Research in Parkinson's disease) at Lund University, the Crafoord Foundation, the Swedish Brain Foundation, The Swedish Alzheimer foundation, the Torsten Söderberg Foundation at the Royal Swedish Academy of Sciences, the Knut and Alice Wallenberg Foundation and the Swedish federal government under the ALF agreement. Doses of 18F‐flutemetamol injection were sponsored by GE Healthcare. The funding sources had no role in the design and conduct of the study; in the collection, analysis, interpretation of the data; or in the preparation, review, or approval of the manuscript.
References
- 1. Wilquet V, De Strooper B. Amyloid‐beta precursor protein processing in neurodegeneration. Curr Opin Neurobiol 2004;14:582–588. [DOI] [PubMed] [Google Scholar]
- 2. Portelius E, Price E, Brinkmalm G, et al. A novel pathway for amyloid precursor protein processing. Neurobiol Aging 2011;32:1090–1098. [DOI] [PubMed] [Google Scholar]
- 3. Meisl G, Yang X, Hellstrand E, et al. Differences in nucleation behavior underlie the contrasting aggregation kinetics of the Abeta40 and Abeta42 peptides. Proc Natl Acad Sci USA 2014;111:9384–9389. [DOI] [PMC free article] [PubMed] [Google Scholar]
- 4. Sanchez L, Madurga S, Pukala T, et al. Abeta40 and Abeta42 amyloid fibrils exhibit distinct molecular recycling properties. J Am Chem Soc 2011;133:6505–6508. [DOI] [PubMed] [Google Scholar]
- 5. Iwatsubo T, Odaka A, Suzuki N, et al. Visualization of A beta 42(43) and A beta 40 in senile plaques with end‐specific A beta monoclonals: evidence that an initially deposited species is A beta 42(43). Neuron 1994;13:45–53. [DOI] [PubMed] [Google Scholar]
- 6. Blennow K, Mattsson N, Scholl M, et al. Amyloid biomarkers in Alzheimer's disease. Trends Pharmacol Sci 2015;36:297–309. [DOI] [PubMed] [Google Scholar]
- 7. Blennow K, Hampel H, Weiner M, Zetterberg H. Cerebrospinal fluid and plasma biomarkers in Alzheimer disease. Nat Rev Neurol 2010;6:131–144. [DOI] [PubMed] [Google Scholar]
- 8. Strozyk D, Blennow K, White LR, Launer LJ. CSF Abeta 42 levels correlate with amyloid‐neuropathology in a population‐based autopsy study. Neurology 2003;60:652–656. [DOI] [PubMed] [Google Scholar]
- 9. Tapiola T, Alafuzoff I, Herukka SK, et al. Cerebrospinal fluid {beta}‐amyloid 42 and tau proteins as biomarkers of Alzheimer‐type pathologic changes in the brain. Arch Neurol 2009;66:382–389. [DOI] [PubMed] [Google Scholar]
- 10. Landau SM, Lu M, Joshi AD, et al. Comparing positron emission tomography imaging and cerebrospinal fluid measurements of beta‐amyloid. Ann Neurol 2013;74:826–836. [DOI] [PMC free article] [PubMed] [Google Scholar]
- 11. Mattsson N, Insel PS, Donohue M, et al. Independent information from cerebrospinal fluid amyloid‐beta and florbetapir imaging in Alzheimer's disease. Brain 2015;138(Pt 3):772–783. [DOI] [PMC free article] [PubMed] [Google Scholar]
- 12. Ewers M, Mattsson N, Minthon L, et al. CSF biomarkers for the differential diagnosis of Alzheimer's disease. A large‐scale international multicenter study. Alzheimers Dement 2015;11:1306–1315. [DOI] [PubMed] [Google Scholar]
- 13. Portelius E, Tran AJ, Andreasson U, et al. Characterization of amyloid beta peptides in cerebrospinal fluid by an automated immunoprecipitation procedure followed by mass spectrometry. J Proteome Res 2007;6:4433–4439. [DOI] [PubMed] [Google Scholar]
- 14. Bibl M, Gallus M, Welge V, et al. Cerebrospinal fluid amyloid‐beta 2‐42 is decreased in Alzheimer's, but not in frontotemporal dementia. J Neural Transm 2012;119:805–813. [DOI] [PMC free article] [PubMed] [Google Scholar]
- 15. Lewczuk P, Lelental N, Spitzer P, et al. Amyloid‐beta 42/40 cerebrospinal fluid concentration ratio in the diagnostics of Alzheimer's disease: validation of two novel assays. J Alzheimers Dis 2015;43:183–191. [DOI] [PubMed] [Google Scholar]
- 16. Struyfs H, Van Broeck B, Timmers M, et al. Diagnostic accuracy of cerebrospinal fluid amyloid‐beta isoforms for early and differential dementia diagnosis. J Alzheimers Dis 2015;45:813–822. [DOI] [PubMed] [Google Scholar]
- 17. Hansson O, Zetterberg H, Buchhave P, et al. Prediction of Alzheimer's disease using the CSF Abeta42/Abeta40 ratio in patients with mild cognitive impairment. Dement Geriatr Cogn Disord 2007;23:316–320. [DOI] [PubMed] [Google Scholar]
- 18. Selnes P, Blennow K, Zetterberg H, et al. Effects of cerebrovascular disease on amyloid precursor protein metabolites in cerebrospinal fluid. Cerebrospinal Fluid Res 2010;7:10. [DOI] [PMC free article] [PubMed] [Google Scholar]
- 19. Folstein MF, Folstein SE, McHugh PR. “Mini‐mental state”. A practical method for grading the cognitive state of patients for the clinician. J Psychiatr Res 1975;12:189–198. [DOI] [PubMed] [Google Scholar]
- 20. Palmqvist S, Zetterberg H, Blennow K, et al. Accuracy of brain amyloid detection in clinical practice using cerebrospinal fluid beta‐amyloid 42: a cross‐validation study against amyloid positron emission tomography. JAMA Neurol 2014;71:1282–1289. [DOI] [PubMed] [Google Scholar]
- 21. Lundqvist R, Lilja J, Thomas BA, et al. Implementation and validation of an adaptive template registration method for 18F‐flutemetamol imaging data. J Nucl Med 2013;54:1472–1478. [DOI] [PubMed] [Google Scholar]
- 22. Manjón JV, Coupé P. VolBrain: an online MRI brain volumetry system, Organization for Human Brain Mapping 15. Available at: http://volbrain.upv.es (accessed December 2014).
- 23. Schmidt P, Gaser C, Arsic M, et al. An automated tool for detection of FLAIR‐hyperintense white‐matter lesions in multiple sclerosis. Neuroimage 2012;59:3774–3783. [DOI] [PubMed] [Google Scholar]
- 24. R Core Team . R: a language and environment for statistical computing. Vienna, Austria: R Foundation for Statistical Computing, 2014. Available at: http://www.R-project.org/ (accessed October 2014). [Google Scholar]
- 25. Robin X, Turck N, Hainard A, et al. pROC: an open‐source package for R and S+ to analyze and compare ROC curves. BMC Bioinformatics 2011;12:77. [DOI] [PMC free article] [PubMed] [Google Scholar]
- 26. Altman DG. Practical statistics for medical research. Boca Raton, FL: Chapman & Hall/CRC, 1999. [Google Scholar]
- 27. Chandra A. Role of amyloid from a multiple sclerosis perspective: a literature review. Neuroimmunomodulation 2015;22:343–346. [DOI] [PubMed] [Google Scholar]
- 28. Holmberg B, Johnels B, Blennow K, Rosengren L. Cerebrospinal fluid Abeta42 is reduced in multiple system atrophy but normal in Parkinson's disease and progressive supranuclear palsy. Mov Disord 2003;18:186–190. [DOI] [PubMed] [Google Scholar]
- 29. Ballard C, O'Brien J, Gray A, et al. Attention and fluctuating attention in patients with dementia with Lewy bodies and Alzheimer disease. Arch Neurol 2001;58:977–982. [DOI] [PubMed] [Google Scholar]
- 30. de Groot JC, de Leeuw FE, Oudkerk M, et al. Cerebral white matter lesions and cognitive function: the Rotterdam Scan Study. Ann Neurol 2000;47:145–151. [DOI] [PubMed] [Google Scholar]
- 31. Cirrito JR, Yamada KA, Finn MB, et al. Synaptic activity regulates interstitial fluid amyloid‐beta levels in vivo. Neuron 2005;48:913–922. [DOI] [PubMed] [Google Scholar]
- 32. Kamenetz F, Tomita T, Hsieh H, et al. APP processing and synaptic function. Neuron 2003;37:925–937. [DOI] [PubMed] [Google Scholar]
- 33. Yamamoto K, Tanei Z, Hashimoto T, et al. Chronic optogenetic activation augments abeta pathology in a mouse model of Alzheimer disease. Cell Rep 2015;11:859–865. [DOI] [PubMed] [Google Scholar]
- 34. Schuff N, Woerner N, Boreta L, et al. MRI of hippocampal volume loss in early Alzheimer's disease in relation to ApoE genotype and biomarkers. Brain 2009;132(Pt 4):1067–1077. [DOI] [PMC free article] [PubMed] [Google Scholar]
- 35. Stricker NH, Dodge HH, Dowling NM, et al. CSF biomarker associations with change in hippocampal volume and precuneus thickness: implications for the Alzheimer's pathological cascade. Brain Imaging Behav 2012;6:599–609. [DOI] [PMC free article] [PubMed] [Google Scholar]
- 36. Mulugeta E, Londos E, Ballard C, et al. CSF amyloid beta38 as a novel diagnostic marker for dementia with Lewy bodies. J Neurol Neurosurg Psychiatry 2011;82:160–164. [DOI] [PubMed] [Google Scholar]
- 37. Duits FH, Teunissen CE, Bouwman FH, et al. The cerebrospinal fluid “Alzheimer profile”: easily said, but what does it mean? Alzheimers Dement 2014;10:713–723.e2. [DOI] [PubMed] [Google Scholar]
- 38. Hertze J, Minthon L, Zetterberg H, et al. Evaluation of CSF biomarkers as predictors of Alzheimer's disease: a clinical follow‐up study of 4.7 years. J Alzheimers Dis 2010;21:1119–1128. [DOI] [PubMed] [Google Scholar]
- 39. Palmqvist S, Zetterberg H, Mattsson N, et al. Detailed comparison of amyloid PET and CSF biomarkers for identifying early Alzheimer disease. Neurology 2015;85:1240–1249. [DOI] [PMC free article] [PubMed] [Google Scholar]
- 40. Hansson O, Zetterberg H, Buchhave P, et al. Association between CSF biomarkers and incipient Alzheimer's disease in patients with mild cognitive impairment: a follow‐up study. Lancet Neurol 2006;5:228–234. [DOI] [PubMed] [Google Scholar]
- 41. Mattsson N, Zetterberg H, Hansson O, et al. CSF biomarkers and incipient Alzheimer disease in patients with mild cognitive impairment. JAMA 2009;302:385–393. [DOI] [PubMed] [Google Scholar]
- 42. Hesse C, Rosengren L, Andreasen N, et al. Transient increase in total tau but not phospho‐tau in human cerebrospinal fluid after acute stroke. Neurosci Lett 2001;297:187–190. [DOI] [PubMed] [Google Scholar]
- 43. Karch A, Hermann P, Ponto C, et al. Cerebrospinal fluid tau levels are a marker for molecular subtype in sporadic Creutzfeldt‐Jakob disease. Neurobiol Aging 2015;36:1964–1968. [DOI] [PubMed] [Google Scholar]
- 44. Ikonomovic MD, Klunk WE, Abrahamson EE, et al. Post‐mortem correlates of in vivo PiB‐PET amyloid imaging in a typical case of Alzheimer's disease. Brain 2008;131(Pt 6):1630–1645. [DOI] [PMC free article] [PubMed] [Google Scholar]
- 45. Thal DR, Beach TG, Zanette M, et al. [(18)F]flutemetamol amyloid positron emission tomography in preclinical and symptomatic Alzheimer's disease: specific detection of advanced phases of amyloid‐beta pathology. Alzheimers Dement 2015;11:975–985. [DOI] [PubMed] [Google Scholar]
- 46. Wolk DA, Grachev ID, Buckley C, et al. Association between in vivo fluorine 18‐labeled flutemetamol amyloid positron emission tomography imaging and in vivo cerebral cortical histopathology. Arch Neurol 2011;68:1398–1403. [DOI] [PMC free article] [PubMed] [Google Scholar]
Associated Data
This section collects any data citations, data availability statements, or supplementary materials included in this article.
Supplementary Materials
Data S1. Supplementary methods.
Table S1. Cohort 1 characteristics.
Table S2. Cohort 2 characteristics.
Table S3. Cohort 3 characteristics.
Table S4. Logistic regression analysis for predicting abnormal or normal PET using CSF Aβ measurements derived from MSD and Quanterix immunoassays.
Figure S1. Scatterplots of CSF Aβ42 and Aβ42/Aβ40 ratio (Quanterix immunoassay) and amyloid PET scores.
Figure S2. Aβ42, Aβ40, Aβ38, the Aβ42/Aβ40 and Aβ42/Aβ38 ratio (Euroimmun immunoassay) in the CSF of patients with AD, PD, DLB/PDD and healthy controls.