Abstract
Retinal ganglion cells (RGCs) integrate visual information from the retina and transmit collective signals to the brain. A systematic investigation of functional and morphological characteristics of various types of RGCs is important to comprehensively understand how the visual system encodes and transmits information via various RGC pathways. This study evaluated both physiological and morphological properties of 67 RGCs in dark-adapted flat-mounted salamander retina by examining light-evoked cation and chloride current responses via voltage-clamp recordings and visualizing morphology by Lucifer yellow fluorescence with a confocal microscope. Six groups of RGCs were described: asymmetrical ON–OFF RGCs, symmetrical ON RGCs, OFF RGCs, and narrow-, medium- and wide-field ON–OFF RGCs. Dendritic field diameters of RGCs ranged 102–490 µm: narrow field (<200 µm, 31% of RGCs), medium field (200–300 µm, 45%) and wide field (>300 µm, 24%). Dendritic ramification patterns of RGCs agree with the sub-lamina A/B rule. 34% of RGCs were monostratified, 24% bistratified and 42% diffusely stratified. 70% of ON RGCs and OFF RGCs were monostratified. Wide-field RGCs were diffusely stratified. 82% of RGCs generated light-evoked ON–OFF responses, while 11% generated ON responses and 7% OFF responses. Response sensitivity analysis suggested that some RGCs obtained separated rod/cone bipolar cell inputs whereas others obtained mixed bipolar cell inputs. 25% of neurons in the RGC layer were displaced amacrine cells. Although more types may be defined by more refined classification criteria, this report is to incorporate more physiological properties into RGC classification.
Keywords: Retinal ganglion cell, Retina, Salamander, Electrophysiology
1. Introduction
In vertebrates, the visual system is functionally divided into ON and OFF pathways which originate at the photoreceptor-bipolar cell synapses in the retina (Kaneko, 1970; Werblin & Dowling, 1969). The general pattern of the retinal circuitry is that the input from depolarizing bipolar cells (DBCs) through sign–preserving synapses localized to sublamina b (the inner part) of the inner plexiform layer (IPL) contributes to the ON responses of ganglion and amacrine cells, whereas input from hyperpolarizing bipolar cells (HBCs) through sign-preserving synapses in sublamina a (the outer part) of the IPL function in generating the OFF responses (Belgum, Dvorak, & McReynolds, 1982; Boycott & Wassle, 1999; Miller & Dacheux, 1976; Roska & Werblin, 2001; Wunk & Werblin, 1979).
In the mammalian retina, cone signals in both pathways are relayed via cone bipolar cells that make direct contacts onto ganglion cells (Famiglietti & Kolb, 1975; Roska & Werblin, 2003). Rod signals are carried by the rod bipolar cells that are presynaptic to bistratified AII amacrine cells (Kolb & Famiglietti, 1974; Pang, Gao, & Wu, 2004a; Wassle & Boycott, 1991). The AII amacrine cells transmit rod signals in the ON pathway through gap junctional contacts with depolarizing cone bipolar cells and in the OFF pathway through inhibitory chemical synapses with hyperpolarizing bipolar cells and then OFF ganglion cells (Daw, Jensen, & Brunken, 1990; Vaney, Young, & Gynther, 1991).
In contrast, it was originally thought that there is no anatomical or functional segregation of rod and cone pathways at the level of the bipolar cells in the amphibian retina (Lasansky, 1973). The tiger salamander retina possesses two types of rods and three types of cones. Rods and cones comprised about 62% and 38% of all photoreceptors, respectively. The majority of rods with peak spectral sensitivity at ~520 nm accounts for 99% of the rod population and the second type of rods (1%) with peak spectral sensitivity at 435 nm. L-cones with peak spectral sensitivity at 620 nm account for 84% of the cone population, S-cone (7%) with peak at 440 nm and UV cone (9%). (Makino, Taylor, & Baylor, 1991; Sherry, Bui, & Degrip, 1998; Zhang & Wu, 2009). Early studies have suggested that all bipolar cells in the tiger salamander make synaptic contact with both rods and cones (Lasansky, 1973, 1978). Therefore it has been thought that there is no segregation of rod and cone pathways at the bipolar cell level in salamander retina. This would imply that the relative rod/cone inputs of the receptive-field center of the ganglion cells should reflect those of the mixed rod–cone bipolar cells. However, previous studies have suggested that the relative rod/cone inputs to higher order neurons in amphibian retina are more complex. For example, in the dark-adapted tiger salamander retina, the relative inputs from rods and cones to horizontal cells have been shown to vary from cell to cell, following a normal distribution (Yang & Wu, 1990). In addition, recent studies have compared light responses and cell morphology of bipolar cells in the salamander retina and have identified more than 20 types of bipolar cells, including rod-dominant, cone- dominant and mixed input bipolar cells (Gao, Pang, & Wu, 2013; Pang, Gao, & Wu, 2004b; Wu, Gao, & Maple, 2000). These studies provide evidence that the rod and cone signals are more segregated than previously thought at the second-order cell level in the tiger salamander retina and that the retinal circuitry in the amphibian retina may share similar organizational principles as the mammalian retina.
A systematic survey of neuronal cell types and the distinct function of each type are important in understanding the function of retina. More than 20 types of retinal ganglion cells (RGCs) have been structurally defined in the retinal ganglion cell layer of the mammalian retina (Coombs, van der List, Wang, & Chalupa, 2006; Freed & Sterling, 1988; Volgyi, Chheda, & Bloomfield, 2009). However, most of these classifications are based only on the morphological properties of RGCs or the physiological characteristics of RGCs. A combination of both morphological and physiological criteria should be taken into consideration for classification of RGCs. In the present work we investigated physiological and morphological characteristics of RGCs in salamander retina by recording light-evoked post-synaptic current responses, comparing relative rod/cone input and visualizing three-dimensional morphology via confocal imaging. By combining both morphological and physiological criteria, we reported six major groups of RGCs in the RGC layer of dark-adapted salamander retina. Examination of response waveform, polarity and sensitivity suggested that some RGCs obtained segregated rod/cone bipolar cell inputs while others obtained mixed bipolar cell inputs. Preliminary results of the present study have been reported in ARVO 2014 annual meeting as an abstract E-2388 (Wang & Wu, 2014).
2. Materials and methods
2.1. Preparation
The subjects in the present study were the flat-mounted retinas of larval tiger salamanders (Ambystoma tigrinum, from Charles E. Sullivan Company, Nashville, TN). All experimental and animal care procedures adhered to the policies on treatment of laboratory animals of Baylor College of Medicine and the National Institutes of Health. Animals were dark-adapted for at least 2 h and then the retinas were isolated and transferred to a chamber for recording. During the recording, the chamber was continuously perfused with oxygenated Ringer’s solution containing 2.5 mM KCl, 108 mM NaCl, 2 mM CaCl2, 1.2 mM MgCl2, 5mM Hepes (titrated to pH 7.4). All procedures including preparation, dissection and recording were conducted under infrared illumination with a dual-unit Nitemare (BE Meyers, Redmond, WA). The detailed procedures of dissection and recording were described clearly in previous publications (Yang & Wu, 1989; Zhang, Zhang, & Wu, 2006).
2.2. Light source
The isolated retinal preparation was illuminated with light from a halogen source, which was adjusted by interference filters and passed through neutral density filters. 2.5 s 500 nm and 700 nm whole field light was transmitted to the retina through the light pipe. The light flashes were presented from the low light energy to the strong light energy. The interval between the light flashes was adjusted from 5 s at the lowest light energy to 10 s at the highest light energy. The unattenuated 500 nm light intensity (log I = 0) was 8.26 * 104 photons µm−2 s−1. The photoisomerization cross section (PIC) was calculated by the following equation
| (1) |
In this equation, the rod outer segment of a tiger salamander is assumed as 25 µm long and 10 µm in diameter (Diamond & Copenhagen, 1995), the axial density of rhodopsin is taken as 0.015 µm−1 and the quantum efficiency for photoisomerization is taken as 0.67 (Dartnall, 1968; Liebman & Entine, 1968). So, 1 photon µm−2 s−1 is approximately equivalent to 30 Rh* (activated rhodopsin molecules) rod−1 s−1.
The relation between the peak voltage responses and light stimulus intensity fitted to the following equation (Thibos and Werblin, 1978)
| (2) |
where V is the response amplitude, Vmax is the maximum response amplitude, σ is the light intensity that elicits a half-maximal response, N is a constant, tanh is the hyperbolic tangent function, and log is the logarithmic function of base 10. In the present study, the V was plotted against the log I.
2.3. Recording
Whole-cell voltage-clamp recordings used an Axopatch 200B amplifier which was controlled by a DigiData 1440A interface and pClamp 10.0 software (Axon Instruments, Foster City, CA). The micropipettes were drawn out by Sutter patch electrode pullers. The tip resistance of micropipette was 6–8 MΩ when filled with internal solution. The internal solution contained 10 mM CsCl, 5 mM EGTA, 118 mM Cs methanesulfonate, 0.5 mM CaCl2, 0.8 mM Lucifer yellow, 10 mM Tris, 4 mM ATP, 0.3 mM GTP, and was titrated with CsOH to pH 7.4. All chemicals were purchased from Research Biochemical International (Natick, MA) or Sigma (St Louis, MO).
2.4. Imaging
Lucifer yellow fluorescence was intracellularly injected to RGCs during whole cell recordings and the cell morphology of RGCs was later captured with a ×40 water immersion objective on a confocal microscope (LSM 510; Carl Zeiss Meditec). The compressed “Z-stack” confocal images of RGCs were presented to show the integrity of RGCs dendrites. The analysis of RGCs did not include the data of cells that had no clear axons. After the stacked confocal images were obtained in the flat-mount retina, the retinas were immersed in 4% paraformaldehyde (Electron Microscopy Sciences, Fort Hatfield, PA) overnight and subsequently vertical sections of 80 µm thick were cut with a microtome (Vibratome; Leica Microsystems, Bannockburn, IL). Retinal vertical sections were obtained from 33 out of 67 flat-mounted retinas. The compressed “Z-stack” confocal images were captured from the retinal vertical sections with the confocal microscope. Then based on these images, the sketches of RGCs’ dendritic lamination were made manually. The inner plexiform layer (IPL) was divided into 10 strata to show the dendritic stratification pattern of filled RGCs, as shown in Fig. 3D. The first 5 strata are considered as sublamina a, while the 6 to 10 strata are considered as sublamina b.
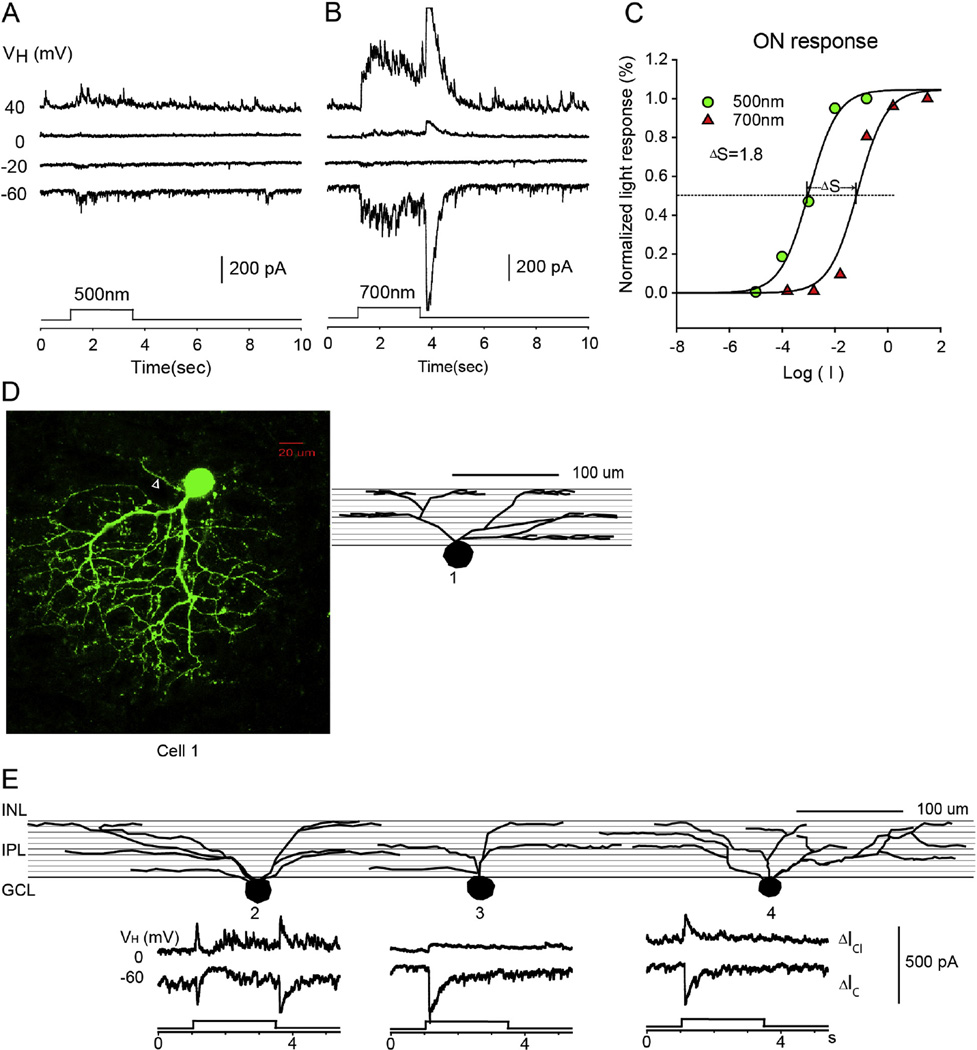
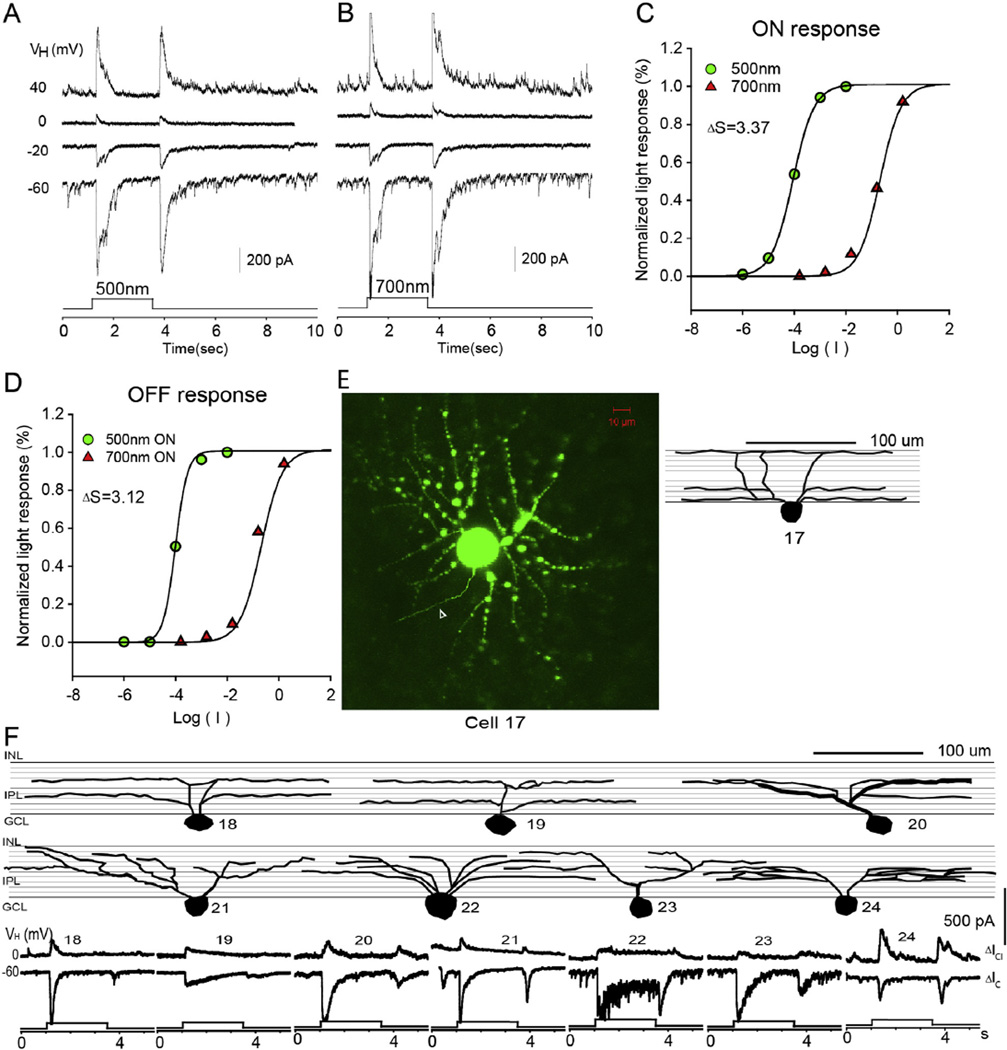
Fig. 3.
Asymmetrical-dendritic-field ON–OFF RGC. The current responses evoked by 2.5 s 500 nm light (A) and 700 nm light (B) of unattenuated 0 log unit intensity at various holding potentials; (C) the stimulus intensity–response relations for the ON responses; (D) the stacked confocal fluorescent image in the flat-mounted retina and the open triangle points to the axon; (E) sketches of 4 asymmetrical RGCs on a schematic background of the inner plexiform layer of retina divided into 10 strata, and corresponding LePSCs evoked by 2.5 s 500 nm light at holding potentials near ECl (ΔIC) and near EC (ΔICl) for each cell. INL: inner nuclear layer; IPL: inner plexiform layer; RGC: retinal ganglion cell layer.
2.5. Retrograde labeling of cells in the retinal ganglion cell layers
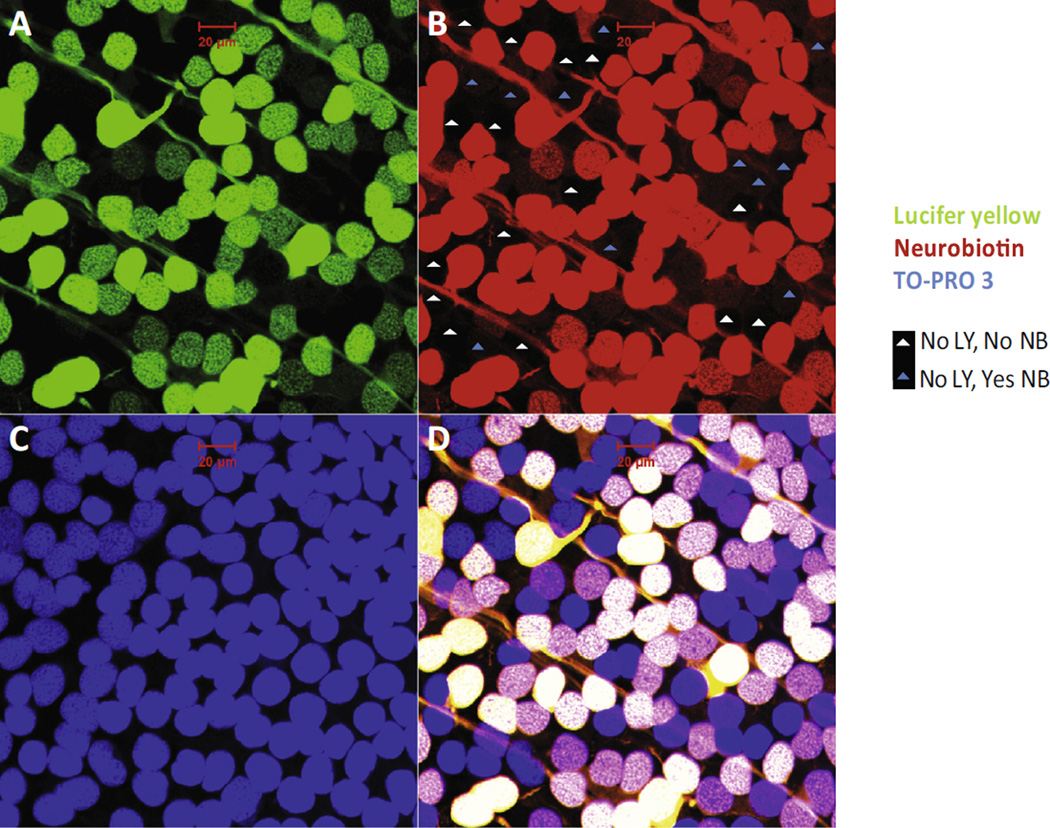
In order to retrograde label RGCs and amacrine cells coupled with RGCs, the gap-junction-impermeable dye Lucifer yellow (LY) and permeable dye Neurobiotin (NB) were applied to three ocular stumps of optic nerves of salamanders. The detailed procedures were described in a previous paper (Pang & Wu, 2011). Briefly, the optic nerve stump was first dipped into 2 µl of internal solution that contained 3% LY and 8% NB for 30 min. After washed out extra dye, the eye cup with intact retina and sclera tissue was maintained in fresh oxygenated Ringers external solution for another 40 min. Then, the whole retinas were immersed in 4% paraformaldehyde (Electron Microscopy Sciences, Fort Hatfield, PA) and 0.5% glutaraldehyde (Sigma–Aldrich) in phosphate buffer (D-PBS, pH 7.4; Invitrogen, Carlsbad, CA), for 30 min at room temperature. The whole retinas were incubated in the secondary antibody of Cy3-conjugated streptavidin (1:200 dilution; Jackson ImmunoResearch), for one day at 4 °C (Pang, Paul, & Wu, 2013). TO-PRO-3 (1: 3000 dilution; Molecular Probes) was used to stain all nuclei in the retinas. RGCs were double labeled by LY and NB; RGC-coupled displaced amacrine cells were labeled by NB but not LY; non-RGC-coupled displaced amacrine cells were only identified by TO-PRO-3.
The only primary antibody used in the present study is polyclonal goat Anti-Choline Acetyltransferase (ChAT) antibody (Chemicon, Goat, Cat#:AB144P, lot 21100523, RRID: AB_2079751, concentration: 1:100) (Bordt, Hoshi, Yamada, Perryman-Stout, & Marshak, 2006) to label cholinergic neurons in the retina.
The fluorescent retinas were visualized with the confocal microscope (Zeiss, NY). Images were captured with the 20× objective lens and scanned with 512 × 512 pixels. To obtain quantitative numbers of neurons in the RGC layer, stacked images through the RGC layer were taken from the central zone and peripheral zone of the retina. The cell density were presented as mean ± standard deviation. Each central retinal zone and peripheral retinal zone represents the confocal image of a 230 µm × 230 µm patch of retina which is 450 µm and 900 µm away from the optic nerve head, respectively, in the dorsal, ventral, nasal and temporal retinas.
3. Results
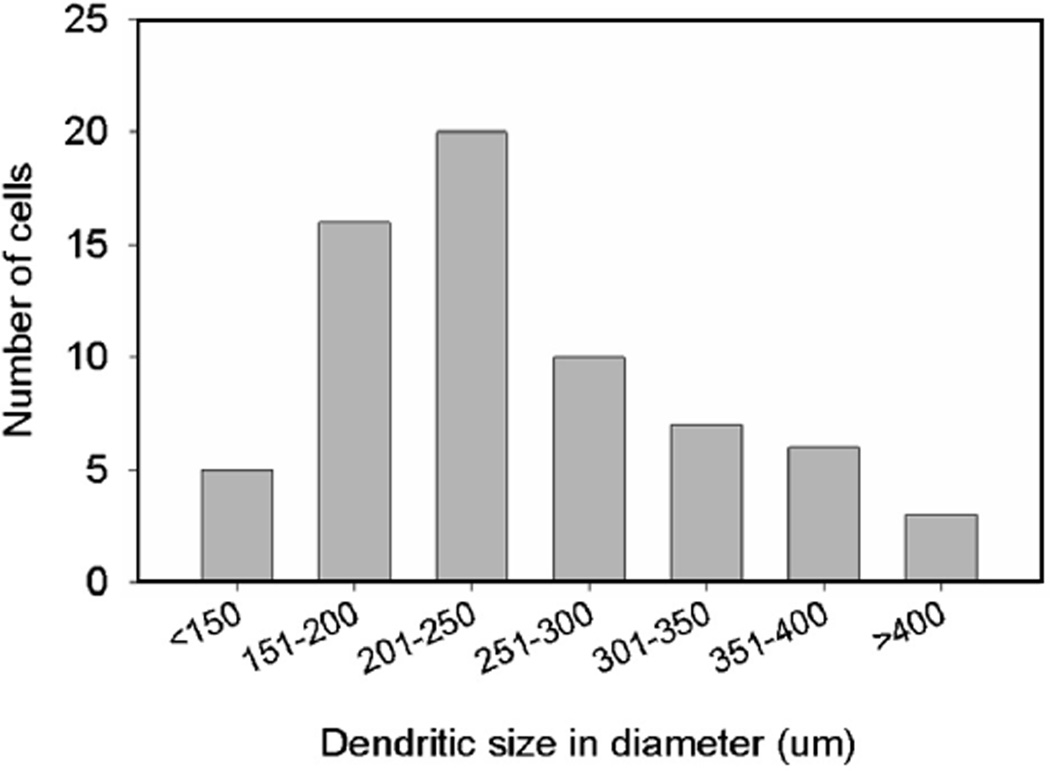
We have recorded sixty-seven RGCs in the flat-mounted retinas of tiger salamanders under dark-adapted conditions. These RGCs were identified by their dendritic morphology, soma location in the ganglion cell layer and the presence of axons. Six major groups of RGCs are reported here, based on their light-evoked response polarity and waveform, dendritic field diameter and profiles and relative rod/cone inputs. The distribution of dendritic field diameters of pooled 67 RGCs was plotted in Fig. 1. The dendritic field diameters of RGCs could be classified into 3 size ranges: narrow-dendritic-field (diameter <201 µm, 31% of RGCs), medium-dendritic-field (201–300 µm, 45% of RGCs) and wide-dendritic-field (>300 µm, 24% of RGCs). The average dendritic field diameter of RGCs found in the present study was 244 ± 82 µm (see Table 1).
Fig. 1.
Distribution of the dendritic field diameters of 67 RGCs.
Table 1.
Morphological and electrophysiological characteristics of the six types of RGCs.
| Type | n | Morphology of dendritic field |
Dendritic field diameter (µm) |
Light response |
|---|---|---|---|---|
| Asymmetrical ON–OFF GC | 5 | Single sided | 267 ± 70 | ON–OFF |
| Narrow ON–OFF GC | 14 | Symmetrical | 165 ± 22 | ON–OFF |
| Medium ON–OFF GC | 22 | Symmetrical | 246 ± 25 | ON–OFF |
| Wide ON–OFF GC | 14 | Symmetrical | 373 ± 73 | ON–OFF |
| ON GC | 7 | Symmetrical | 195 ± 53 | ON |
| OFF GC | 5 | Symmetrical | 205 ± 54 | OFF |
3.1. Relative rod/cone inputs in RGCs
The relative rod/cone inputs to the light-evoked post-synaptic current in RGCs is determined by the difference between response sensitivities to 500 nm light and 700 nm light, as described in previous studies (Pang et al., 2004b; Wu et al., 2000; Yang & Wu, 1990). Two types of rods, M and S rods, and three types of cones, L, S and UV cones, are present in salamander retina. Due to the low population of S-rods (1% of rod population and 0.6% of photoreceptor population) and S-cones (7% of cone population and 2% of photoreceptor population) and the light source used in the present study not strong enough to stimulate UV cones, we assumed only one type of rod, M rod and one type of cone, L-cone in our analysis.(Makino et al., 1991; Sherry et al., 1998) Based on the spectral sensitivity curves of rod and cone in salamander retina, (Yang & Wu, 1996) the rod sensitivity drops steeply as the wavelength increases, while the sensitivity of cones to 700 nm light is only 1 log unit lower than that to 500 nm light. As shown in Fig. 3C, the normalized peak light responses recorded from RGCs are plotted against the intensity of 500 and 700 nm light steps. The response–intensity relations of current responses were fitted by Eq. (2). The spectral sensitivity difference (ΔS) is defined by the difference between the intensities of the 500 nm and 700 nm lights (S700−S500) which elicits a response of 50% maximal amplitude. In the retina of tiger salamander, the spectral sensitivity difference is 3.4 for the rods and 0.1 for the cones (Yang & Wu, 1990). Thus, the closer to 3.4 the ΔS is, the more rod–dominated the input is. The closer to 0.1 the ΔS is, the more cone-dominated the input is. For RGCs, cone–dominated input is defined ΔS < 1, rod-dominated input with ΔS > 2 and rod/cone mixed input with ΔS from 1–2. The spectral sensitivity difference (ΔS) measured from the response-intensity curves evaluates the ability of RGCs to receive input from rod and/or cone pathways at dark-adapted condition. It does not indicate the specific sensitivity of particular RGC to the light of specific intensity or relative contribution of rod and cone at a specific light intensity, although it is predictable that rod-dominated RGCs are more sensitive than cone-dominated RGCs. ΔS > 2 indicates that this RGC synapses with rod-input-only bipolar cells and has the ability to respond to very dim light. ΔS < 1 indicates that this RGC synapses with cone-input-only bipolar cells and has the ability to respond to strong light only. ΔS from 1 to 2 indicates that this RGC synapses with cone-and-rod-input bipolar cells and has the ability to respond to both dim and strong lights (see Table 2).
Table 2.
Relative rod/cone inputs of RGCs determined by DS.
| ON response | OFF response | |||
|---|---|---|---|---|
| ΔIC (BP input) (%) | ΔICl (AC input) (%) | ΔIC (BP input) (%) | ΔICl (AC input) (%) | |
| Rod dominated (ΔS > 2) | 59 | 67 | 62 | 60 |
| Cone dominated (ΔS < 1) | 7 | 7 | 13 | 15 |
| Rod/cone mixed (ΔS = 1–2) | 34 | 26 | 25 | 25 |
ΔIC: excitatory cation current recorded near −60 mV. ΔICl: inhibitory current recorded near 0 mV.
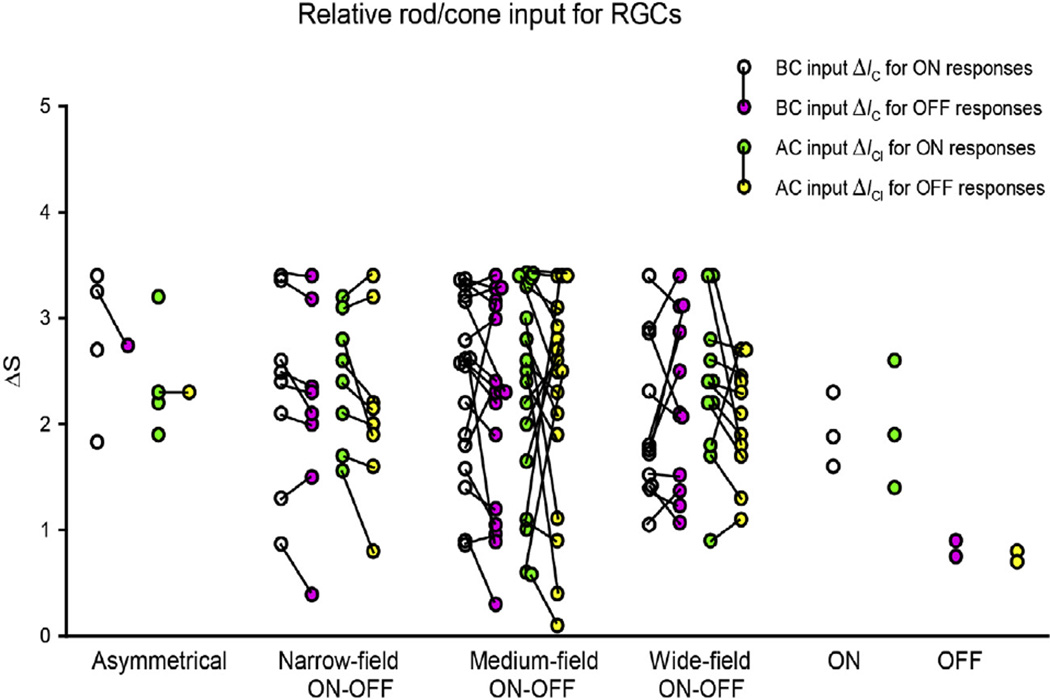
The post-synaptic current responses evoked by 500 nm light were recorded in 67 RGCs. In 45 of these various types of RGCs we also measured current responses evoked by 700 nm light. Fig. 2 shows the relative rod/cone input, calculated from responses evoked by both 500 nm and 700 nm light, for ΔIC (excitatory cation current recorded near −60 mV, bipolar cell input) and ΔICl (inhibitory current recorded near 0 mV, amacrine cell input) of the 45 RGCs of various types. A great number of RGCs received mixed rod/cone input. ON responses exhibited mixed rod/cone input in 34% (ΔIC) and 26% (ΔICl) of RGCs, while OFF responses exhibited mixed rod/cone input in 25% (ΔIC) and 25% (ΔICl) of RGCs. However, some other RGCs received rod-dominated or cone-dominated input. For the ON response, 59% (ΔIC) and 67% (ΔICl) of RGCs were rod-dominated. For the OFF response, 62% of ΔIC and 60% of ΔICl were rod-dominated. Cone-dominated input was found in a smaller proportion of RGCs, ON responses: 7% (ΔIC) and 7% (ΔICl), OFF responses 13% (ΔIC) and 15% (ΔICl). OFF responses 7% (ΔIC) and 12% (ΔICl). Additionally, in pooled RGCs of various types, ON responses (ΔS = 2.29 ± 0.79) received (t = 0.98, p < 0.05) slightly more rod input, compared with OFF responses (ΔS = 2.10 ± 0.87) which received slightly more cone input. T-test was performed to determine whether there was a significant difference in the ΔS between the ON responses and OFF responses. In 73% of ON–OFF RGCs, ΔS of ON responses (2.32 ± 0.83 on average) tended to be greater than that of OFF responses (2.19 ± 0.89 on average), but not significantly (p > 0.05). As shown in Fig. 2, more black short lines point downward from ON responses to OFF responses. This trend is present for both ΔIC (bipolar cell input) and ΔICl (amacrine cell input). For ΔIC, 67% of ON–OFF RGCs have greater ΔS of ON responses than that of OFF responses. For ΔICl, 77% of ON–OFF RGCs have greater ΔS of ON responses than that of OFF responses. ON RGCs (ΔS = 2.19 ± 0.89 on average) received more rod input than OFF RGCs (ΔS = 0.78 ± 0.08 on average), as well.
Fig. 2.
Relative cone/rod input for RGCs. Relative cone/rod input based on spectral sensitivity ΔS for ΔIC (excitatory cation current recorded near −60 mV, bipolar cell input) and ΔICl (inhibitory current recorded near 0 mV, macrine cell input) of six types of RGCs. Black lines connect ON and OFF responses which were recorded from the same cell.
3.2. Six groups of RGCs
Six major groups of RGCs are reported here, based on their light-evoked response waveform, their morphology and relative rod/cone inputs.
3.2.1. Asymmetrical-dendritic-field ON–OFF RGCs
The first group of RGCs (n = 5) are the asymmetrical-dendritic-field ON–OFF RGCs. More than 90% of the dendritic branches of these RGCs were confined to one side of the soma as shown in Fig. 3D.The dendritic field ranged from 205 µm to 375 µm in diameter. Fig. 3E shows sketches of representative asymmetrical–dendritic-field ON–OFF RGCs on a schematic background of the inner plexiform layer (IPL) divided into 10 strata to show the dendritic stratification pattern of filled RGCs. The dendrites of asymmetrical-dendritic-field RGCs ramified in multiple strata of the IPL, including both inner and outer halves. Light-evoked post–synaptic currents (LePSCs) were recorded at six holding potentials from −60 to 40 mV with 20 mV steps in dark-adapted retina. 2.5 sec light stimuli of 500 nm or 700 nm with various intensities was delivered to the retinas. Fig. 3A and B show the light-evoked responses of an asymmetrical-dendritic-field RGC evoked by 500 and 700 nm light of 0 log unit intensity under voltage clamp conditions. These RGCs exhibit transient ON responses to 500 nm light and sustained ON responses and transient OFF responses to 700 nm light. The discrepancy of responses to 500 nm and 700 nm light is consistent for all light intensities. The reversal potential of the LePSC was between −20 and 0 mV. The ΔS ranged from 1.84 to 3.8 for the ON responses. 75% of these RGCs received rod-dominated BP input (ΔIC) and AC input (ΔICl).
3.2.2. Narrow-dendritic-field ON–OFF RGCs
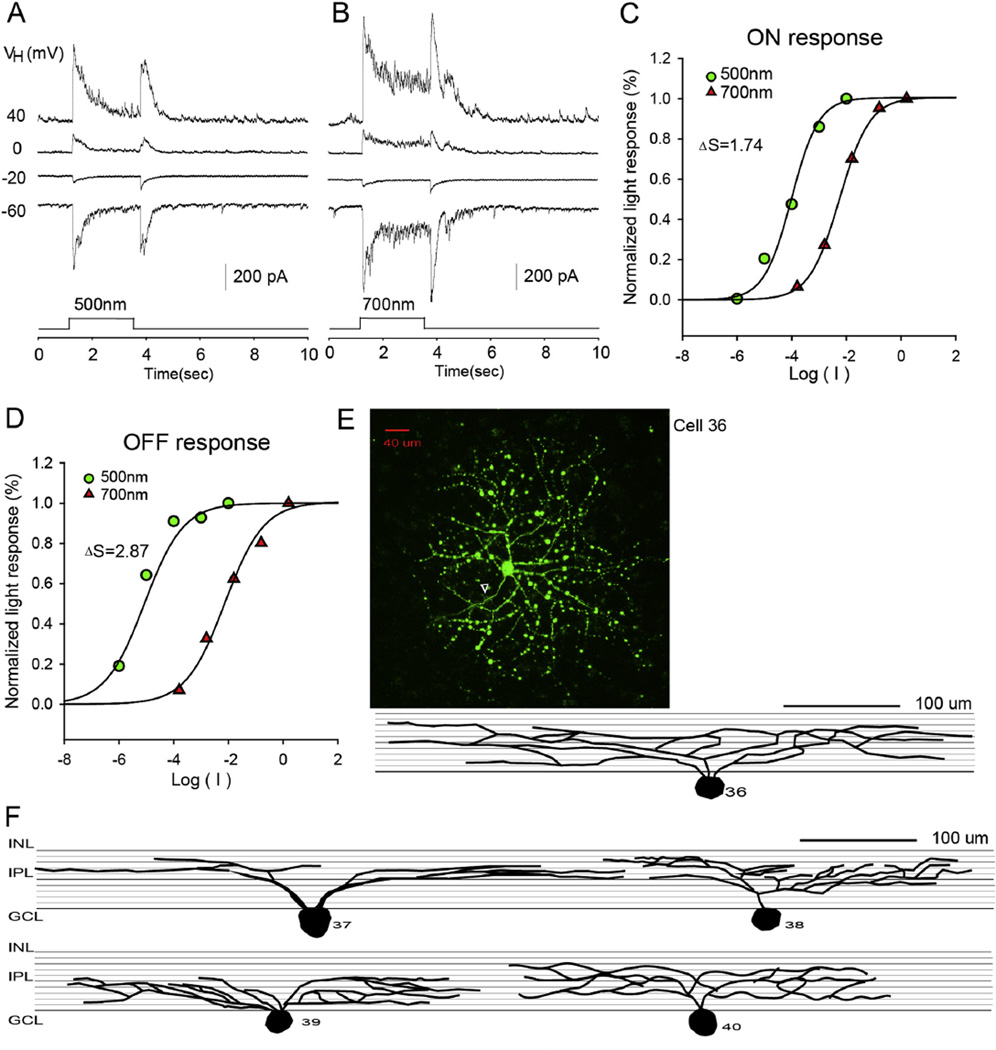
The second group of RGCs (n = 14) are the narrow-dendritic-field ON–OFF RGCs. The dendritic branches of these cells were distributed symmetrically around the soma as shown in Fig. 4E, and the dendritic field diameter ranged from 102 to 200 µm. The dendrites were either bistratified (dendrites ramified in two noncontiguous strata) or diffusely ramified (dendrites ramified in four or more strata) as shown in Fig. 4F. In response to 500 nm or 700 nm light, these cells generated transient LePSCs at both light onset and offset. The peak amplitude of light-evoked excitatory cation current (ΔIC) ranged from 300 to 1200 pA for ON responses and from 300 to 1300 pA for OFF responses. The reversal potential of the LePSC was between −20 and 0 mV. Based on the ΔS (n = 8), ΔICl reflected mixed rod/cone inputs to 25% (ON responses) and 38% (OFF responses) of these RGCs. For the light-evoked excitatory cation current (ΔIC), 13% of ON responses and 25% of OFF responses of narrow-dendritic-field RGCs received mixed rod/cone inputs
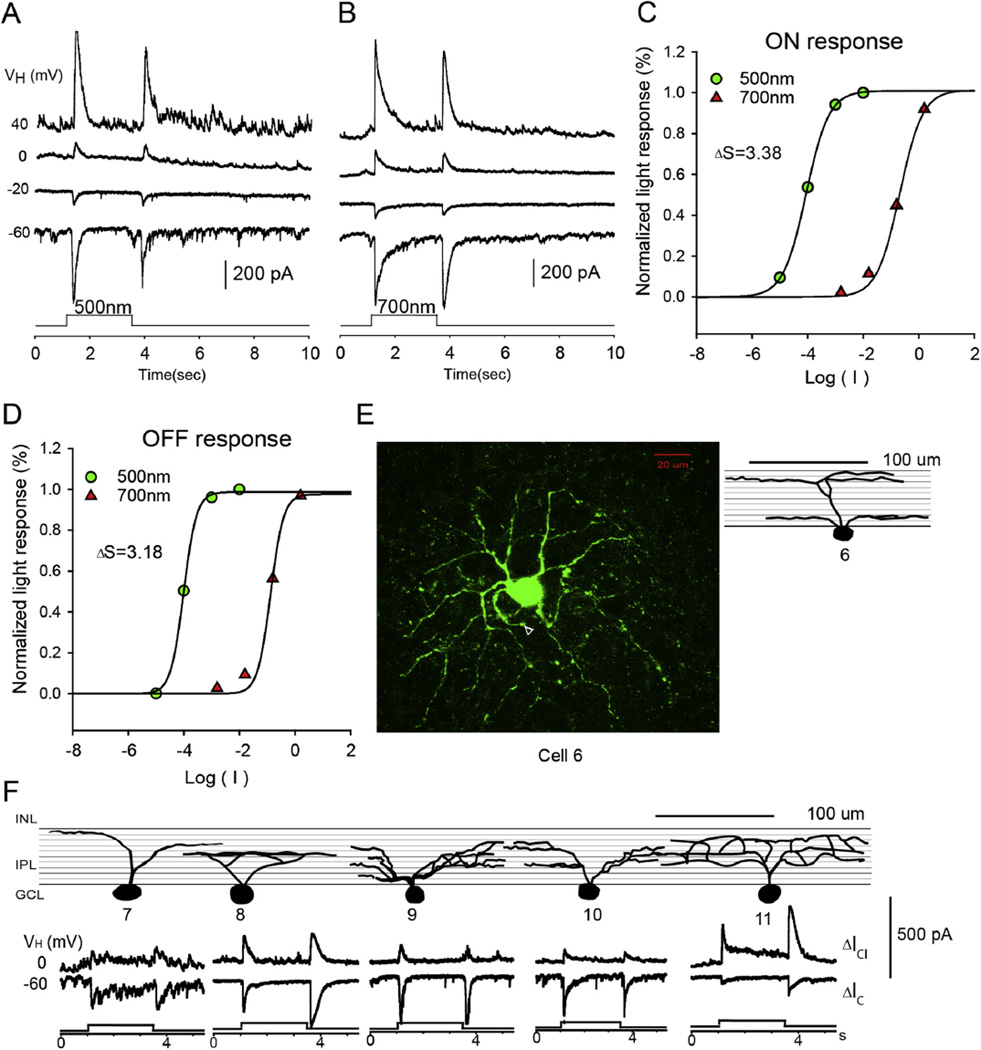
Fig. 4.
Narrow-dendritic-field ON–OFF RGC. The current responses evoked by 2.5 s 500 nm light (A) and 700 nm light (B) of unattenuated 0 log unit intensity at various holding potentials; (C and D) the stimulus intensity–response relations for the ON and OFF responses; (E) the stacked confocal fluorescent image in the flat-mounted retina and the open triangle points to the axon; (F) sketches of narrow-dendritic-field ON–OFF RGCs on a schematic background of the inner plexiform layer, and corresponding LePSCs evoked by 2.5 s 500 nm light at holding potentials near ECl (ΔIC) and near EC (ΔICl) for each cell. INL: inner nuclear layer; IPL: inner plexiform layer; RGC: retinal ganglion cell layer.
3.2.3. Medium-dendritic-field ON–OFF RGCs
The third group of RGCs (n = 22) are the medium-dendritic-field ON–OFF RGCs, as shown in Fig. 5. These GCs had dendrites sym- metrically distributed around the soma with dendritic field size ranging from 201 to 300 µm. The dendrites of these cells were monostratified (dendrites ramified in one single strata of the IPL), bistratified or diffusely stratified, as shown in Fig. 5F. These cells generated transient LePSCs at both light onset and offset of both 500 nm and 700 nm light. The reversal potential of the LePSC was between −20 and 0 mV. The pattern of rod/cone input varied among the 17 RGCs in which light responses to 700 nm light were recorded to get ΔS. In terms of ΔIC, for both ON and OFF responses, 24% of medium-dendritic-field ON–OFF RGCs received mixed rod/-cone input; 64% received pure rod input; 12% pure cone input. For the ΔICl, the ON responses of 24% of these RGCs received mixed rod/cone input and the remaining 76% received pure rod or pure cone input.
Fig. 5.
Medium-dendritic-field ON–OFF RGC. The current responses evoked by 2.5 s 500 nm light (A) and 700 nm light (B) of unattenuated 0 log unit intensity at various holding potentials; (C and D) the stimulus intensity–response relations for the ON and OFF responses; (E) the stacked confocal fluorescent image in the flat-mounted retina and the open triangle points to the axon; (F) sketches of medium-dendritic-field ON–OFF RGCs on a schematic background of the inner plexiform layer, and corresponding LePSCs evoked by 2.5 s 500 nm light at holding potentials near ECl (ΔIC) and near EC (ΔICl) for each cell. INL: inner nuclear layer; IPL: inner plexiform layer; RGC: retinal ganglion cell layer.
3.2.4. Wide-dendritic-field ON–OFF RGCs
The fourth group of RGCs (n = 14) are the wide-dendritic-field ON–OFF RGCs, as shown in Fig. 6. These GCs had dendrites symmetrically distributed around the soma, and the dendritic field size ranged from 301 to 474 µm in diameter. The dendrites of the majority of these cells were diffusely stratified, as shown in Fig. 6F. These cells generated light-evoked current responses at both light onset and offset to both 500 and 700 nm light. For cells where ΔS was measured (n = 11), bipolar cell inputs (ΔIC) were mixed rod/cone in 64% (ON responses) and 36% (OFF responses) of RGCs. Amacrine cell inputs (ΔICl) contained mixed rod/cone signals in 18% (ON responses) and 45% (OFF responses) of these RGCs.
Fig. 6.
Wide-dendritic-field ON–OFF RGC. The current responses evoked by 2.5 s 500 nm light (A) and 700 nm light (B) of unattenuated 0 log unit intensity at various holding potentials; (C and D) the stimulus intensity–response relations for the ON and OFF responses; (E) the stacked confocal fluorescent image in the flat-mounted retina and the open triangle points to the axon; (F) sketches of wide-dendritic-field ON–OFF RGCs on a schematic background of the inner plexiform layer, and corresponding LePSCs evoked by 2.5 s 500 nm light at holding potentials near ECl (ΔIC) and near EC (ΔICl) for each cell. INL: inner nuclear layer; IPL: inner plexiform layer; RGC: retinal ganglion cell layer.
3.2.5. ON RGCs
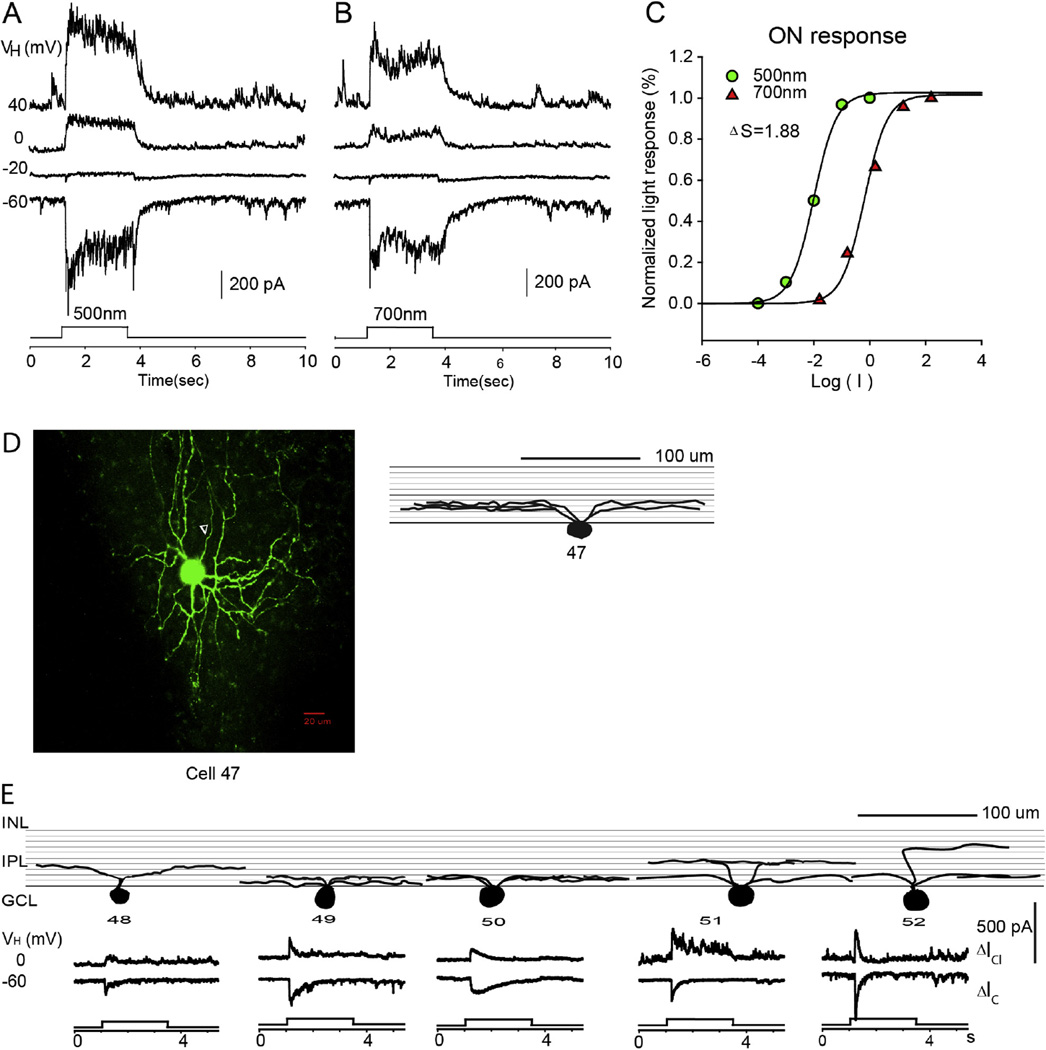
The fifth group of RGCs (n = 7) are the ON RGCs, as shown in Fig. 7. These RGCs have symmetrically distributed dendritic fields with sizes ranging from 148 to 298 µm. Nearly all of these cells ramified in the inner IPL, and 67% of these cells were monostratified, as shown in Fig. 7E. Cell 52 ramified in strata 3 in the outer part of IPL, in Fig. 7E. ON RGCs generated light responses at the light onset but no response at the light offset of both 500 nm and 700 nm. The reversal potential of the LePSC was between −40 and −20 mV. ΔS was measured for 3 ON RGCs and they 2 of them exhibited mixed rod/cone input for both ΔIC and ΔICl.
Fig. 7.
ON RGC. The current responses evoked by 2.5 s 500 nm light (A) and 700 nm light (B) of unattenuated 0 log unit intensity at various holding potentials; (C) the stimulus intensity–response relations for the ON responses; (D) the stacked confocal fluorescent image in the flat-mounted retina and the open triangle points to the axon; (E) sketches of ON RGCs on a schematic background of the inner plexiform layer, and corresponding LePSCs evoked by 2.5 s 500 nm light at holding potentials near ECl (ΔIC) and near EC (ΔICl) for each cell. INL: inner nuclear layer; IPL: inner plexiform layer; RGC: retinal ganglion cell layer.
3.2.6. OFF RGCs
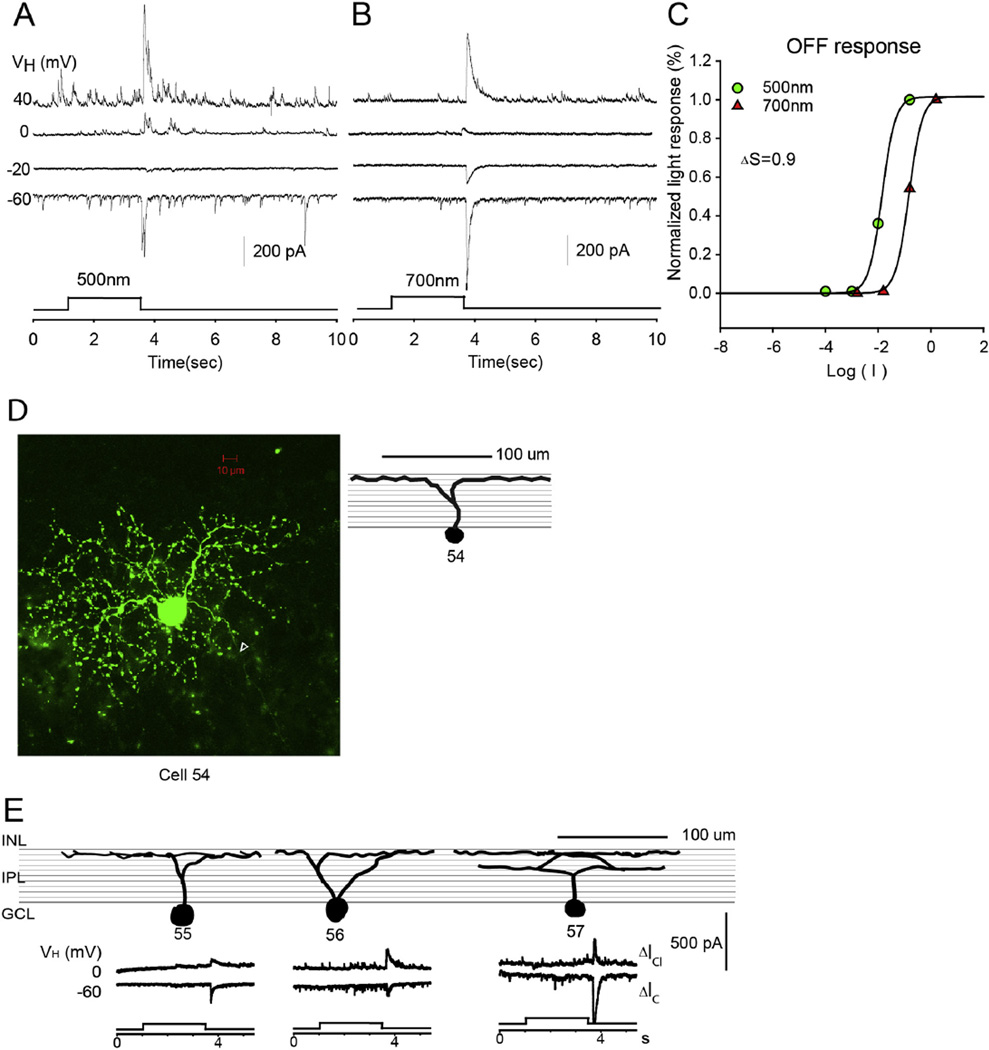
The sixth group of RGCs (n = 5) are the OFF RGCs, as shown in Fig. 8. These RGCs have symmetrically distributed dendritic fields with medium diameter ranging from 145 to 289 µm. The dendrites of all recorded OFF RGCs ramified in the outer half of the IPL, and most of these (75%) were monostratified as shown in Fig. 8E. OFF RGCs generated light responses at light offset but no response at light onset of both 500 nm and 700 nm. This type of RGC only constituted 7% of RGCs. The reversal potential of the LePSC was between −20 and 0 mV. ΔS was measured for 2 OFF RGCs, and they both received cone-dominant input for both ΔIC and ΔICl.
Fig. 8.
OFF RGC. The current responses evoked by 2.5 s 500 nm light (A) and 700 nm light (B) of unattenuated 0 log unit intensity at various holding potentials; (C) the stimulus intensity–response relations for the OFF responses; (D) the stacked confocal fluorescent image in the flat-mounted retina and the open triangle points to the axon; (E) sketches of OFF RGCs on a schematic background of the inner plexiform layer, and corresponding LePSCs evoked by 2.5 s 500 nm light at holding potentials near ECl (ΔIC) and near EC (ΔICl) for each cell. INL: inner nuclear layer; IPL: inner plexiform layer; RGC: retinal ganglion cell layer.
3.3. Displaced amacrine cells in the RGC layer
The cells retrograde-labeled by both LY and NB in the RGC layer were recognized as RGCs as shown in Fig. 9. Those without LY and NB labeling were mainly displaced amacrine cells, and those labeled only by NB but not LY were identified as displaced amacrine cells that are coupled via gap junction with RGCs. TO-PRO-3 visualized all nuclei in the retina. In the RGC layer, cell density was about 2038–2794 cells/mm2. The central zone presented insignificantly (t = 0.96, p = 0.053) but slightly higher cell density (2510 ± 36 cells/mm2) compared with the peripheral zone (2377 ± 91 cells/mm2). The average density of RGCs was about 1434–2207 cells/mm2 which accounted for 77.6 ± 5.1% of the total cells in the RGC layer. The displaced amacrine cells constituted 22.2 ± 4.8% of the total neurons in the RGC layer. Moreover, the RGC-coupled displaced amacrine cells represented 7.8 ± 1.2% of total neurons and 37.1 ± 13.3% of displaced amacrine cells. ChAT labeled amacrine cells accounted for 6.2 ± 1% of the total neurons and 22.5 ± 6.1% of the displaced amacrine cells in the RGC layer. Only 4.2% of ChAT amacrine cells in the RGC layer were coupled with RGCs.
Fig. 9.
Displaced amarine cells in the RGC layer. In the RGC layer, retrograde–identified RGCs with both LY and NB labeling constituted 3/4 of the total neurons; the remaining 1/4 of neurons with no LY signal were displaced amacrine cells which are either coupled to RGCs (with NB signal) or not coupled to RGCs (without NB signal). (A) LY labeling, green; (B) NB labeling, red; (C) TO-PRO-3 labeling, blue; (D) combined. Scale bar: 20 µm. (For interpretation of the references to color in this figure legend, the reader is referred to the web version of this article.)
4. Discussion
4.1. Physiological properties of RGCs
It is known that vertebrate retinal GCs exhibit great morphological diversity (Volgyi et al., 2009), while many of these morphologically distinct RGCs share similar physiological responses. RGCs in salamander retina exhibit three basic types of light response waveforms: ON, OFF and ON–OFF LePSCs. We found that 82% of RGCs generate ON–OFF responses, while the remaining 18% generate only ON or OFF light responses. This is consistent with what (Hensley, Yang, & Wu, 1993) reported in salamander retina: about 80% of ganglion cells are ON–OFF cells, 15% are ON cells and only about 5% are OFF cells. The sustained ON cells, transient ON cells and transient OFF cells recorded in the present study were also reported in multi-channel array study in salamander retina (Segev, Puchalla, & Berry, 2006). Another important physiological parameter, the receptive field of RGCs was not included in the pre- sent study and will be studied by future experiments. Analysis of response sensitivity, polarity and waveform in the present study suggests that 25–34% of RGCs receive mixed rod/cone inputs, 7–15% of RGCs receive cone-dominated input and 59–67% of RGCs receive rod–dominated inputs. Pang et al. (2004) reported that of the 20 types of bipolar cells, 4 types had rod-dominated input, while 9 types of bipolar cells had cone-dominated input. These studies provide further evidence that some RGCs receive segregated bipolar cell inputs whereas others receive mixed bipolar cell inputs in the tiger salamander retina. The present study also found that ON responses tend to receive more rod input, while OFF responses tend to receive more cone input.
4.2. Morphological characteristics of RGCs
The present study found that dendritic field diameters of RGCs in salamander retina ranged from 130 to 490 µm. RGCs could be classified based on dendritic field diameter into 3 size ranges: narrow-dendritic-field (diameter <200 µm), medium-dendritic-field (200–300 µm) and wide-dendritic-field (>300 µm). The average dendritic field diameter (244 ± 82 µm) of RGCs found in the present study is smaller than what Zhang and Wu reported (Zhang & Wu, 2010). The discrepancy may be due to different intracellular filling dyes used in these two studies. Zhang used neurobiotin which can cross gap junctions between cells, whereas the present study used Lucifer Yellow which does not cross gap junctions and may not fill the dendritic tips completely. The present study also found that the dendrites of 34% of RGCs were monostratified, 24% were bistratified and 42% were diffusely stratified. 70% of ON RGCs and all OFF RGCs were monostratified, and wide-dendritic-field RGCs tended to be diffusely stratified. Analysis of dendritic ramification patterns and light evoked responses of RGCs suggests that dendrites which ramified on the strata 1, 2 and 4 received OFF responses, while dendrites which ramified on the strata 3, 7, 8, 9 and 10 received ON responses, and dendrites in strata 5 and 6 contained both ON and OFF responses. This dendritic pattern largely agrees with the sublamina A/B rule observed in many vertebrate species (Famiglietti & Kolb, 1975). Axon terminals of bipolar cells and amacrine cells in the salamander retina obey the sublamina A/B rule as well (Pang, Gao, & Wu, 2002; Pang et al., 2004b). The only exception is that RGCs with dendritic terminals in stratum 3 exhibit ON responses. Pang and her colleagues (Pang et al., 2002, 2004b) reported that in salamander retina, bipolar cells and amacrine cells with axon terminals in stratum 3 also exhibit ON responses. RGCs that ramified exclusively in the sublamina A could also have ON responses. This may provide a clue to the fact that a greater proportion of RGCs are ON–OFF RGCs in salamander retina, compared with other species such as mice and non-human primates.
4.3. Asymmetrical-dendritic-field RGCs
Morphologically, the majority of RGCs have dendrites that radiate symmetrically around the soma, while about 7% of RGCs in the RGC layer have asymmetrically distributed dendritic field. These asymmetrical-dendritic-field RGCs are defined as their dendritic arbors forming a continuum on one side of the soma with no dendritic arbors on the other side of the soma, and these RGCs exhibit unique transient ON response to 500 nm light and sustained ON and transient OFF response to 700 nm light. This is the first time that asymmetrical RGCs have been reported in the salamander retina. These asymmetrical-dendritic-field RGCs in salamander retina have more than 90% of their dendritic field area falling on one side of the soma which is similar to direction selective J-RGCs in mouse retina (Kim, Zhang, Yamagata, Meister, & Sanes, 2008). However, the ramification pattern in the IPL is different for these two types of RGCs, since direction selective J-RGCs ramify in the distal IPL within a narrow band. Although direction selective RGCs have not been reported in salamander retina, RGCs with object motion selection properties do exist in salamander retina (Marre et al., 2015; Olveczky, Baccus, & Meister, 2003). Further study is needed to determine whether the asymmetrical-dendritic-field RGCs recorded in the present study are direction selective RGCs and whether dendrites of all these asymmetric RGCs pointed in the same direction as J-RGCs do.
4.4. Displaced amacrine cells in the RGC layer
The retrograde–labeling experiment in the present study has revealed that RGCs (positive NB and positive LY) constituted three fourths of the neurons in the RGC layer and the remaining one fourth of neurons were displaced amacrine cells (negative LY). Previous studies have shown that displaced amacrine cells accounted for 34% of neurons in the RGC layer of rabbit retina (Vaney, Peichi, & Boycott, 1981), 40% in rat (Perry, 1981) and 56–59% in mouse (Jeon, Strettoi, & Masland, 1998). Our experiments also demonstrate for the first time that in the salamander retina about 37% of displaced amacrine cells (negative LY and positive NB) were coupled to RGCs. In the mouse retina, the population of coupled displaced ACs constituted about 10% of the total displaced ACs (Pang & Wu, 2011), although most (16/22) ganglion cell subtypes were coupled to adjacent ganglion and amacrine cells (Volgyi et al., 2009). These data indicate that the population and function of displaced ACs varies among species. Among the cholinergic displaced amacrine cells in the RGC layer, which are identified by ChAT, 4.2% were coupled with RGCs. It is not clear whether these cells are related to direction-selective RGCs.
In the mammalian retina, the significant implications of heterologous coupling between RGCs and diverse subtypes of ACs are still largely unknown. One function is to provide synchronous activity of neighboring RGCs. The electrical coupling between RGCs and ACs through gap junctions was found to be responsible for the concerted firing pattern of RGCs (Brivanlou, Warland, & Meister, 1998; Schnitzer & Meister, 2003). The synchronous signal can be transmitted more efficiently and reliably to brain and also enhance the bandwidth of the optic nerve (Meister & Berry, 1999; Singer, 1999). Moreover, Meister and his colleagues have proposed that ACs may excite RGCs through the coupling between RGCs and ACs by gap junctions, not only inhibit RGCs through chemical synapses (Brivanlou et al., 1998). It is known that in mouse retina, connexin 36 (Pan, Paul, Bloomfield, & Volgyi, 2010) and connexin 45 (Schubert, Maxeiner, Kruger, Willecke, & Weiler, 2005) mediate gap junctions between RGCs and ACs, and these gap junction likely allow RGC somas to obtain the small molecular weight neurotransmitter GABA, (Pang & Wu, 2011) and probably glycine (Vaney, Nelson, & Pow, 1998) as well. However, in salamander retina, the protein that mediates the RGC and AC coupling and whether small molecules can cross these junctions are still unknown.
4.5. Classification of RGCs
The present study characterized the light response waveforms, relative rod/cone input, dendritic field properties and dendritic ramification patterns of 67 RGCs in dark-adapted flat-mounted salamander retina. Based on the light response waveforms and dendritic field diameter and symmetricity, six major groups of RGCs were described: asymmetrical-field ON–OFF RGCs; symmetrical ON RGCs; OFF RGCs; narrow-, medium- and wide-field ON–OFF RGCs. One important physiological character, light response waveforms and one important morphological character, dendritic field were chosen as criteria for classification. This classification represents the minimum number of basic groups. These criteria were chosen for practical purposes and were not based on any cluster analysis. We define the symmetricity of dendritic field as that dendritic arbors radiate symmetrically in all directions around the soma. Since each of these general groups can likely be sub-divided furtherly into additional types as more characteristics are taken into account. It is clear from the light responses and morphologies presented here that there is much diversity among RGCs and classification depends entirely on criteria chosen.
The criteria of either morphology or physiology alone cannot satisfy all purposes, due to limitation of current morphological and physiological techniques. As the labeling technique improves, such as genetic markers, better classification and more types of RGCs will be defined.
References
- Belgum JH, Dvorak DR, McReynolds JS. Sustained synaptic input to ganglion cells of mudpuppy retina. Journal of Physiology. 1982;326:91–108. doi: 10.1113/jphysiol.1982.sp014179. [DOI] [PMC free article] [PubMed] [Google Scholar]
- Bordt AS, Hoshi H, Yamada ES, Perryman-Stout WC, Marshak DW. Synaptic input to OFF parasol ganglion cells in macaque retina. Journal of Comparative Neurology. 2006;498:46–57. doi: 10.1002/cne.21040. [DOI] [PMC free article] [PubMed] [Google Scholar]
- Boycott B, Wassle H. Parallel processing in the mammalian retina: The Proctor Lecture. Investigative Ophthalmology & Visual Science. 1999;40:1313–1327. [PubMed] [Google Scholar]
- Brivanlou IH, Warland DK, Meister M. Mechanisms of concerted firing among retinal ganglion cells. Neuron. 1998;20:527–539. doi: 10.1016/s0896-6273(00)80992-7. [DOI] [PubMed] [Google Scholar]
- Coombs J, van der List D, Wang GY, Chalupa LM. Morphological properties of mouse retinal ganglion cells. Neuroscience. 2006;140:123–136. doi: 10.1016/j.neuroscience.2006.02.079. [DOI] [PubMed] [Google Scholar]
- Dartnall HJ. The photosensitivities of visual pigments in the presence of hydroxylamine. Vision Research. 1968;8:339–358. doi: 10.1016/0042-6989(68)90104-1. [DOI] [PubMed] [Google Scholar]
- Daw NW, Jensen RJ, Brunken WJ. Rod pathways in mammalian retinae. Trends in Neurosciences. 1990;13:110–115. doi: 10.1016/0166-2236(90)90187-f. [DOI] [PubMed] [Google Scholar]
- Diamond JS, Copenhagen DR. The relationship between light-evoked synaptic excitation and spiking behaviour of salamander retinal ganglion cells. Journal of Physiology. 1995;487:711–725. doi: 10.1113/jphysiol.1995.sp020912. [DOI] [PMC free article] [PubMed] [Google Scholar]
- Famiglietti EV, Jr, Kolb H. A bistratified amacrine cell and synaptic circuitry in the inner plexiform layer of the retina. Brain Research. 1975;84:293–300. doi: 10.1016/0006-8993(75)90983-x. [DOI] [PubMed] [Google Scholar]
- Freed MA, Sterling P. The ON-alpha ganglion cell of the cat retina and its presynaptic cell types. Journal of Neuroscience. 1988;8:2303–2320. doi: 10.1523/JNEUROSCI.08-07-02303.1988. [DOI] [PMC free article] [PubMed] [Google Scholar]
- Gao F, Pang JJ, Wu SM. Sign-preserving and sign-inverting synaptic interactions between rod and cone photoreceptors in the dark-adapted retina. Journal of Physiology. 2013;591:5711–5726. doi: 10.1113/jphysiol.2013.260984. [DOI] [PMC free article] [PubMed] [Google Scholar]
- Hensley SH, Yang XL, Wu SM. Relative contribution of rod and cone inputs to bipolar cells and ganglion cells in the tiger salamander retina. Journal of Neurophysiology. 1993;69:2086–2098. doi: 10.1152/jn.1993.69.6.2086. [DOI] [PubMed] [Google Scholar]
- Jeon CJ, Strettoi E, Masland RH. The major cell populations of the mouse retina. Journal of Neuroscience. 1998;18:8936–8946. doi: 10.1523/JNEUROSCI.18-21-08936.1998. [DOI] [PMC free article] [PubMed] [Google Scholar]
- Kaneko A. Physiological and morphological identification of horizontal, bipolar and amacrine cells in goldfish retina. Journal of Physiology. 1970;207:623–633. doi: 10.1113/jphysiol.1970.sp009084. [DOI] [PMC free article] [PubMed] [Google Scholar]
- Kim IJ, Zhang Y, Yamagata M, Meister M, Sanes JR. Molecular identification of a retinal cell type that responds to upward motion. Nature. 2008;452:478–482. doi: 10.1038/nature06739. [DOI] [PubMed] [Google Scholar]
- Kolb H, Famiglietti EV. Rod and cone pathways in the inner plexiform layer of cat retina. Science. 1974;186:47–49. doi: 10.1126/science.186.4158.47. [DOI] [PubMed] [Google Scholar]
- Lasansky A. Organization of the outer synaptic layer in the retina of the larval tiger salamander. Philosophical Transactions of the Royal Society of London. Series B, Biological sciences. 1973;265:471–489. doi: 10.1098/rstb.1973.0033. [DOI] [PubMed] [Google Scholar]
- Liebman PA, Entine G. Visual pigments of frog and tadpole (Rana pipiens) Vision Research. 1968;8:761–775. doi: 10.1016/0042-6989(68)90128-4. [DOI] [PubMed] [Google Scholar]
- Makino CL, Taylor WR, Baylor DA. Rapid charge movements and photosensitivity of visual pigments in salamander rods and cones. Journal of Physiology. 1991;442:761–780. doi: 10.1113/jphysiol.1991.sp018818. [DOI] [PMC free article] [PubMed] [Google Scholar]
- Marre O, Botella-Soler V, Simmons KD, Mora T, Tkacik G, Berry MJ., 2nd High accuracy decoding of dynamical motion from a large retinal population. PLoS Computational Biology. 2015;11:e1004304. doi: 10.1371/journal.pcbi.1004304. [DOI] [PMC free article] [PubMed] [Google Scholar]
- Meister M, Berry MJ., 2nd The neural code of the retina. Neuron. 1999;22:435–450. doi: 10.1016/s0896-6273(00)80700-x. [DOI] [PubMed] [Google Scholar]
- Miller RF, Dacheux RF. Synaptic organization and ionic basis of on and off channels in mudpuppy retina. III. A model of ganglion cell receptive field organization based on chloride-free experiments. Journal of General Physiology. 1976;67:679–690. doi: 10.1085/jgp.67.6.679. [DOI] [PMC free article] [PubMed] [Google Scholar]
- Olveczky BP, Baccus SA, Meister M. Segregation of object and background motion in the retina. Nature. 2003;423:401–408. doi: 10.1038/nature01652. [DOI] [PubMed] [Google Scholar]
- Pan F, Paul DL, Bloomfield SA, Volgyi B. Connexin36 is required for gap junctional coupling of most ganglion cell subtypes in the mouse retina. Journal of Comparative Neurology. 2010;518:911–927. doi: 10.1002/cne.22254. [DOI] [PMC free article] [PubMed] [Google Scholar]
- Pang JJ, Gao F, Wu SM. Segregation and integration of visual channels: layer-by-layer computation of ON–OFF signals by amacrine cell dendrites. Journal of Neuroscience. 2002;22:4693–4701. doi: 10.1523/JNEUROSCI.22-11-04693.2002. [DOI] [PMC free article] [PubMed] [Google Scholar]
- Pang JJ, Gao F, Wu SM. Light-evoked current responses in rod bipolar cells, cone depolarizing bipolar cells and AII amacrine cells in dark-adapted mouse retina. Journal of Physiology. 2004a;558:897–912. doi: 10.1113/jphysiol.2003.059543. [DOI] [PMC free article] [PubMed] [Google Scholar]
- Pang JJ, Gao F, Wu SM. Stratum-by-stratum projection of light response attributes by retinal bipolar cells of Ambystoma. Journal of Physiology. 2004b;558:249–262. doi: 10.1113/jphysiol.2004.063503. [DOI] [PMC free article] [PubMed] [Google Scholar]
- Pang JJ, Paul DL, Wu SM. Survey on amacrine cells coupling to retrograde-identified ganglion cells in the mouse retina. Investigative Ophthalmology & Visual Science. 2013;54:5151–5162. doi: 10.1167/iovs.13-11774. [DOI] [PMC free article] [PubMed] [Google Scholar]
- Pang JJ, Wu SM. Morphology and immunoreactivity of retrogradely double-labeled ganglion cells in the mouse retina. Investigative Ophthalmology & Visual Science. 2011;52:4886–4896. doi: 10.1167/iovs.10-5921. [DOI] [PMC free article] [PubMed] [Google Scholar]
- Perry VH. Evidence for an amacrine cell system in the ganglion cell layer of the rat retina. Neuroscience. 1981;6:931–944. doi: 10.1016/0306-4522(81)90174-3. [DOI] [PubMed] [Google Scholar]
- Roska B, Werblin F. Vertical interactions across ten parallel, stacked representations in the mammalian retina. Nature. 2001;410:583–587. doi: 10.1038/35069068. [DOI] [PubMed] [Google Scholar]
- Roska B, Werblin F. Rapid global shifts in natural scenes block spiking in specific ganglion cell types. Nature Neuroscience. 2003;6:600–608. doi: 10.1038/nn1061. [DOI] [PubMed] [Google Scholar]
- Schnitzer MJ, Meister M. Multineuronal firing patterns in the signal from eye to brain. Neuron. 2003;37:499–511. doi: 10.1016/s0896-6273(03)00004-7. [DOI] [PubMed] [Google Scholar]
- Schubert T, Maxeiner S, Kruger O, Willecke K, Weiler R. Connexin45 mediates gap junctional coupling of bistratified ganglion cells in the mouse retina. Journal of Comparative Neurology. 2005;490:29–39. doi: 10.1002/cne.20621. [DOI] [PubMed] [Google Scholar]
- Segev R, Puchalla J, Berry MJ., 2nd Functional organization of ganglion cells in the salamander retina. Journal of Neurophysiology. 2006;95:2277–2292. doi: 10.1152/jn.00928.2005. [DOI] [PubMed] [Google Scholar]
- Sherry DM, Bui DD, Degrip WJ. Identification and distribution of photoreceptor subtypes in the neotenic tiger salamander retina. Visual Neuroscience. 1998;15:1175–1187. doi: 10.1017/s0952523898156201. [DOI] [PubMed] [Google Scholar]
- Singer W. Neuronal synchrony: A versatile code for the definition of relations? Neuron. 1999;24(49–65):111–125. doi: 10.1016/s0896-6273(00)80821-1. [DOI] [PubMed] [Google Scholar]
- Vaney DI, Nelson JC, Pow DV. Neurotransmitter coupling through gap junctions in the retina. Journal of Neuroscience. 1998;18:10594–10602. doi: 10.1523/JNEUROSCI.18-24-10594.1998. [DOI] [PMC free article] [PubMed] [Google Scholar]
- Vaney DI, Peichi L, Boycott BB. Matching populations of amacrine cells in the inner nuclear and ganglion cell layers of the rabbit retina. Journal of Comparative Neurology. 1981;199:373–391. doi: 10.1002/cne.901990305. [DOI] [PubMed] [Google Scholar]
- Vaney DI, Young HM, Gynther IC. The rod circuit in the rabbit retina. Visual Neuroscience. 1991;7:141–154. doi: 10.1017/s0952523800011019. [DOI] [PubMed] [Google Scholar]
- Volgyi B, Chheda S, Bloomfield SA. Tracer coupling patterns of the ganglion cell subtypes in the mouse retina. Journal of Comparative Neurology. 2009;512:664–687. doi: 10.1002/cne.21912. [DOI] [PMC free article] [PubMed] [Google Scholar]
- Wang J, Wu SM. Investigative Ophthalmology & Visual Science. Vol. 55. Orlando (FL): 2014. Physiological and morphological characterization of ganglion cells in the salamander retina. [Google Scholar]
- Wassle H, Boycott BB. Functional architecture of the mammalian retina. Physiological Reviews. 1991;71:447–480. doi: 10.1152/physrev.1991.71.2.447. [DOI] [PubMed] [Google Scholar]
- Werblin FS, Dowling JE. Organization of the retina of the mudpuppy, Necturus maculosus. II. Intracellular recording. Journal of Neurophysiology. 1969;32:339–355. doi: 10.1152/jn.1969.32.3.339. [DOI] [PubMed] [Google Scholar]
- Wu SM, Gao F, Maple BR. Functional architecture of synapses in the inner retina: segregation of visual signals by stratification of bipolar cell axon terminals. Journal of Neuroscience. 2000;20:4462–4470. doi: 10.1523/JNEUROSCI.20-12-04462.2000. [DOI] [PMC free article] [PubMed] [Google Scholar]
- Wunk DF, Werblin FS. Synaptic inputs to the ganglion cells in the tiger salamander retina. Journal of General Physiology. 1979;73:265–286. doi: 10.1085/jgp.73.3.265. [DOI] [PMC free article] [PubMed] [Google Scholar]
- Yang XL, Wu SM. Effects of background illumination on the horizontal cell responses in the tiger salamander retina. Journal of Neuroscience. 1989;9:815–827. doi: 10.1523/JNEUROSCI.09-03-00815.1989. [DOI] [PMC free article] [PubMed] [Google Scholar]
- Yang XL, Wu SM. Synaptic inputs from rods and cones to horizontal cells in the tiger salamander retina. Science in China. Series B. 1990;33:946–954. [PubMed] [Google Scholar]
- Yang XL, Wu SM. Response sensitivity and voltage gain of the rod- and cone-horizontal cell synapses in dark- and light-adapted tiger salamander retina. Journal of Neurophysiology. 1996;76:3863–3874. doi: 10.1152/jn.1996.76.6.3863. [DOI] [PubMed] [Google Scholar]
- Zhang AJ, Wu SM. Responses and receptive fields of amacrine cells and ganglion cells in the salamander retina. Vision Research. 2010;50:614–622. doi: 10.1016/j.visres.2010.01.009. [DOI] [PMC free article] [PubMed] [Google Scholar]
- Zhang AJ, Zhang J, Wu SM. Electrical coupling, receptive fields, and relative rod/cone inputs of horizontal cells in the tiger salamander retina. Journal of Comparative Neurology. 2006;499:422–431. doi: 10.1002/cne.21117. [DOI] [PubMed] [Google Scholar]
- Zhang J, Wu SM. Immunocytochemical analysis of photoreceptors in the tiger salamander retina. Vision Research. 2009;49:64–73. doi: 10.1016/j.visres.2008.09.031. [DOI] [PMC free article] [PubMed] [Google Scholar]


