

Abstract
Here we describe an analytical platform for systems-level quantitative analysis of modified ribonucleosides in any RNA species, with a focus on stress-induced reprogramming of tRNA as part of a system of translational control of cell stress response. The chapter emphasizes strategies and caveats for each of the seven steps of the platform workflow: 1) RNA isolation, 2) RNA purification, 3) RNA hydrolysis to individual ribonucleosides, 4) chromatographic resolution of ribonucleosides, 5) identification of the full set of modified ribonucleosides, 6) mass spectrometric quantification of ribonucleosides, 6) interrogation of ribonucleoside datasets, and 7) mapping the location of stress-sensitive modifications in individual tRNA molecules. We have focused on the critical determinants of analytical sensitivity, specificity, precision and accuracy in an effort to ensure the most biologically meaningful data on mechanisms of translational control of cell stress response. The methods described here should find wide use in virtually any analysis involving RNA modifications.
Keywords: tRNA modifications, mass spectrometry, translation, stress response, systems biology
1. Introduction
In addition to the canonical adenosine, guanosine, cytidine and uridine, nearly every form of RNA in prokaryotes and eukaryotes contains post-transcriptionally modified ribonucleosides. There are currently more than 120 different enzymatically-derived chemical derivatives of the canonical ribonucleosides, with about 25 to 40 of these modifications present in any organism (Agris, Vendeix, & Graham, 2007; Bjork et al., 1999; P.F. Crain, Rozenski, & McCloskey, 1999; Czerwoniec et al., 2009; Urbonavicius, Qian, Durand, Hagervall, & Bjork, 2001; Yarian et al., 2002). Among the different RNA species, tRNA is heavily decorated with modified ribonucleosides. Individual modifications have been found to influence tRNA structure, folding and stability, such as stabilization of base stacking by 2′-O-methylation (Agris, 2004; Davis, 1995; Motorin & Helm, 2010), enhancement of flexibility by dihydrouridine (D) (Dalluge, Hashizume, Sopchik, McCloskey, & Davis, 1996). tRNA modifications also affect the recognition and subsequent amino acid charging of tRNA species by tRNA synthases (Nameki, 1995; Nameki, Asahara, Shimizu, Okada, & Himeno, 1995; Putz, Florentz, Benseler, & Giege, 1994; Rudinger, Florentz, & Giege, 1994). Modifications located within the anticodon loop and particularly those at the wobble position have been demonstrated to be important in translational fidelity and efficiency (Agris et al., 2007; Bjork et al., 1999; Urbonavicius et al., 2001; Yarian et al., 2002), preventing frameshift mutations (Bjork et al., 1999; Bregeon, Colot, Radman, & Taddei, 2001), and cell growth (Emilsson, Naslund, & Kurland, 1992). More recently, systems-level analyses have revealed a transcendent property of the dozens of tRNA modifications in cellular stress responses (Begley et al., 2007; C. T. Chan et al., 2010; C. T. Chan et al., 2012; Patil et al., 2012; Rezgui et al., 2013). The involvement of tRNA modifications in the cell stress response was first reported by Begley et al., with alkylation stress leading to up-regulation of mcm5U at the wobble position of tRNA species reading AGA and GAA codons that are enriched in genes critical to the DNA damage response (Begley et al., 2007). This model was expanded at a systems-level in studies of the response of budding yeast to exposure to different stresses, in which each chemical stressor produced highly-predictive, signature changes in the relative quantities of modified ribonucleosides (C. T. Chan et al., 2010; T. Y. C. Chan et al., 2015), with this reprogramming of tRNA modifications leading to selective translation of codon-biased stress response genes (C. T. Chan et al., 2012; T. Y. C. Chan et al., 2015).
These new systems-level models of translational control of cell phenotype and stress response were enabled by the development and application of both chromatographic methods for purifying different types of RNA and chromatography-coupled mass spectrometric methods for quantifying modified ribonucleosides in tRNA and other RNA species. While approaches to ribonucleoside analysis such as thin-layer chromatography (TLC) and HPLC with UV-VIS spectrometric detection provide a cost-effective means to characterize subsets of RNA modifications and modified oligonucleotides (Grosjean, Droogmans, Roovers, & Keith, 2007; Köhrer & Rajbhandary, 2008), the methods are at best semi-quantitative, lack the sensitivity needed for the detection of low abundance modifications, and do not allow quantification of all tRNA modifications at once. The recent emergence of chromatography-coupled mass spectrometric (LC-MS) methods has facilitated significant advancements in discovering, identifying and quantifying modified 2-deoxyribonucleosides and ribonucleosides in all organisms. Based on this foundation, we developed a sensitive and robust LC-MS platform for analyzing the full set of modified ribonucleosides in any RNA species, with first application to purified tRNA from Saccharomyces cerevisiae (Su et al., 2014). This systems-level approach provided the first evidence of stress-induced changes in the relative abundance of tRNA modifications, with the emergence of stress-specific signature patterns, or reprogramming, of the modified ribonucleosides (C. T. Chan et al., 2012; T. Y. C. Chan et al., 2015). Subsequent mining of this dataset in conjunction with genomic and proteomic analyses revealed a new system of stress response involving reprogramming of tRNA wobble modifications coordinated with selective translation of codon-biased mRNAs required for the stress response (CC. T. han et al., 2012).
Here we describe this LC-MS approach for the discovery and quantification of modified ribonucleosides from purified RNA in biological systems, with an emphasis on the strategies and caveats for each of the six steps of the platform: 1) RNA isolation and purification, 2) hydrolysis of RNA into individual ribonucleosides, 3) liquid chromatographic resolution of ribonucleosides, 4) identification of modified ribonucleosides by high-mass accuracy spectrometric methods, 5) quantification of ribonucleosides by tandem quadrupole mass spectrometry (Su et al., 2014), and 6) interrogation of the stress-reprogrammed tRNA modification profiles and mapping the location of altered modifications in individual tRNA molecules.
2. Methods
2.1 RNA isolation
The importance of RNA modifications in biological systems is underscored by recent discoveries of modified ribonucleosides in virtually all forms of RNA, both coding and non-coding (Carlile et al., 2014; He, 2010; Kirino & Mourelatos, 2007; Ohara et al., 2007; Zheng et al., 2013). This importance is underscored by the advent of RNA sequencing and bioinformatics, which has led to the discovery of new non-coding RNA (ncRNA) species and the implication of ncRNA in a variety of host-pathogen interactions, genetic disorders and adaptive responses to stress (Arnvig & Young, 2012; C. T. Chan et al., 2010; Rederstorff & Hüttenhofer, 2010; Zhang et al., 2012). The diversity of ncRNA species containing modified ribonucleosides necessitates an unbiased method for isolating and purifying the individual ncRNAs. In this section, we discuss the steps and caveats involved in RNA isolation and the methods employed for assessing the quality and quantity of isolated RNA.
RNA isolation generally consists of several steps: 1) cell lysis and homogenization, 2) quenching of biochemical processes, 3) nucleic acid partitioning, 4) RNA retrieval and crude purification, and 5) assessing the quality of the extracted RNA (Fig. 1). We consider each of these steps to address specific problems, but some or all steps can be consolidated depending upon need and the use of commercial kits.
Figure 1. Flowchart of the general RNA extraction process.

Step 1: Cell lysis and homogenization
The first step requires effective cell lysis following homogenization for the complete release of nucleic acids. Several methods include chemical treatments such as TRIzol or detergents that disrupt cells to release cellular contents. In addition to chemical methods, enzymatic means may be employed, such as treatment with lysozymes or enzymatic spheroplasting to weaken the cell walls for homogenization (Akhtar, Sarkar, Mishra, & Sarkar, 2011). For cells that are refractory to the these treatments, mechanical disruption such as reciprocal bead-beating (Hia et al., 2014) or mechanical shearing with a French pressure cell (Kinger, Verma, & Tyagi, 1993) may be employed.
Step 2: Quenching of biochemical processes
During cell lysis, previously compartmentalized biomolecules are released and subjected to the milieu of enzymatic activities that may compromise RNA integrity. Therefore, solvents that solubilize cell contents should be denaturing (e.g., phenol ± chloroform) or contain chaotropic agents such as guanidinium thiocyanate or urea. In most instances, cell lysis/homogenization and quenching of biochemical processes are performed in the same step.
Step 3: Nucleic acid partitioning
Many commercial preparations use phenol-chloroform-based extractions to isolate nucleic acids. Phase separation is usually achieved when their constituents are centrifuged to separate aqueous and organic phases. In nucleic acid isolation, the partitioning of DNA from RNA depends on pH (Brawerman, Mendecki, & Lee, 1972; Perry, La Torre, Kelley, & Greenberg, 1972). At an alkaline pH, DNA and RNA are retained in the aqueous phase.
However, as pH decreases, DNA increasingly migrates from the aqueous phase to the organic phase and interphase. Therefore, phenol equilibrated to a pH of ∼8 is used for the extraction of DNA while acid phenol of pH 4.8 is used to isolate RNA. The critical role of pH in the stability of some modified ribonucleosides is discussed shortly.
Step 4: RNA retrieval and crude purification
With RNA partitioned in a solvent, the next step is to retrieve the RNA with high yield and minimal artifacts
RNA contained in the aqueous phase can be extracted using a variety of methods. One of the commonly used methods is through precipitation with isopropanol. However, as the final step involves drying the RNA pellet, caution must be exercised as excessive drying may result in poor resolubilization of RNA, which may affect subsequent purification and downstream analysis. Additionally, it was reported that isopropanol-based precipitation results in a retrieval bias of small RNA (Y. K. Kim, Yeo, Kim, Ha, & Kim, 2012). As an alternative to precipitation, silica-based microcentrifuge spin-columns provide rapid purification of RNA. In general, ethanol is added to the aqueous phase and the resulting mixture is applied to the columns, with the RNA-containing column washed to remove contaminants and the RNA subsequently eluted. In a recent study, a two-column RNA extraction method based on these principles was employed to purify total ncRNA from mycobacteria (Hia et al., 2014). Using a mixture of 35% ethanol, large RNA species are recovered first. The resulting flow-through is adjusted to 70% ethanol and applied to a second column, resulting in the recovery of smaller RNA species (Fig. 2). This approach facilitates an unbiased extraction of the full spectrum of ncRNA species.
Figure 2.
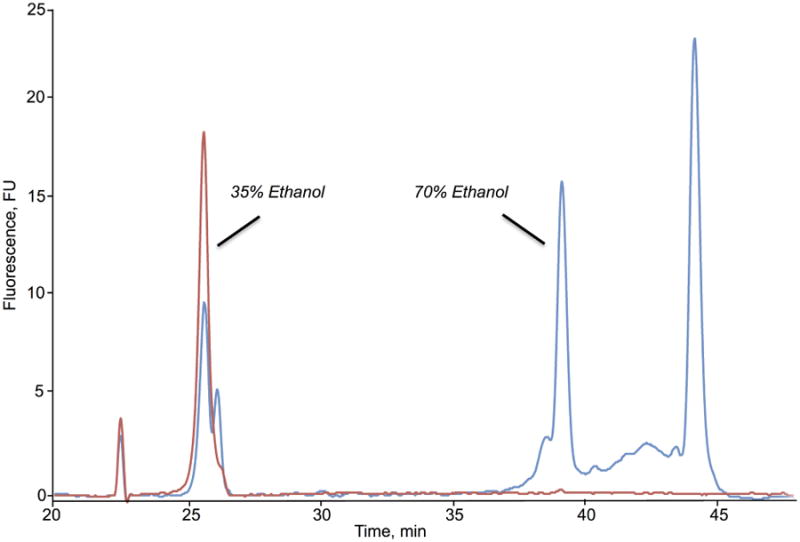
Representative 2100 Bioanalyzer electropherogram for isolated BCG RNA using the two-column approach. Large RNA species are recovered by elution from the column with 35% ethanol while small RNA species are recovered from the flow through using 70% ethanol.
When deciding on an appropriate RNA isolation strategy, consideration should be given to possible artifact generation during extraction or downstream processing, such as hydrolysis of nucleoside modifications be found on RNA in alkaline conditions. For example, cyclic N6-threonylcarbamoyladenosine (ct6A), a nucleotide base modification, is hydrolyzed to N6-threonylcarbamoyladenosine (t6A) under slight alkaline conditions (Miyauchi, Kimura, & Suzuki, 2013). Similarly, under mild alkaline conditions, glutamyl-queuosine, which occurs at the wobble position of tRNAAsp, is hydrolyzed to a queuosine base (Salazar, Ambrogelly, Crain, McCloskey, & Söll, 2004).
Step 5: Assessing the quality of extracted RNA
Several methods are employed to assess the quality of extracted RNA. The easiest but most problematic approach is to estimate RNA concentration and purity by UV absorbance. The main drawbacks of spectroscopic approaches are the inability to evaluate RNA integrity, the strong potential for artifacts caused by contaminating phenol, DNA and protein, and a lack of sensitivity for low concentration RNA samples. The issue of RNA integrity can be addressed by electrophoresis on denaturing gels, which are relatively cost-effective but time consuming in the casting and running the gels. While densitometric analysis of RNA band intensities provides semi-quantitative information, at best, the major disadvantage of gel electrophoresis is the requirement for at least nanogram quantities of DNA for adequate visualization. Perhaps the most sensitive and accurate method for RNA quantification involves the use of fluorescent dyes with simple corrections for RNA secondary structure influences in different RNA species (Chionh et al., 2013).
Of all of the available methods, perhaps the most efficient approach for assessing both RNA quantity and integrity involves the microfluidic chip-based platforms offered by Agilent Technologies (Bioanalyzer) and BioRad (Experion), with options for RNA, DNA and proteins using specific chips. By using fluorescent dye-based electrophoresis, the 2100 Bioanalyzer detects and resolves up to picogram quantities of total RNA or small RNA depending on the chip used (Kuschel & Ausserer; Tissot, 2008). As a measure of RNA integrity, the instrument software assigns a RNA Integrity Number (RIN) from 1 – 10 (with 10 indicating full integrity) based on the electrophoretic trace of the sample (Schroeder et al., 2006). The Bioanalyzer tracings in recent publications show the full range of ncRNA species with excellent resolution (Chionh et al., 2013; Hia et al., 2014). The chips and reagents for RNA analysis are highly cost-effective for analysis of multiple samples, relative to other rigorous techniques, though the specialized instrument for processing and analyzing the chips can be expensive for small research laboratories.
In conclusion, RNA isolation is a flexible process that can be customized according to specific laboratory requirements and costs. However, designing an RNA isolation strategy should incorporate considerations such as the toughness of the cell, pH of the extraction solvent and an unbiased method of RNA retrieval – issues that are fundamentally important to producing reliable and biologically meaningful results.
2.2 RNA purification
RNA modifications occur in nearly all forms of RNA (Wang & He, 2014), so the ability to purify a specific ncRNA species is critical to accurate analysis of species-specific modified ribonucleosides. While liquid chromatography (Easton, Shibata, & Lukavsky, 2010; I. Kim, McKenna, Viani Puglisi, & Puglisi, 2007), affinity purification (Batey & Kieft, 2007) and gel electrophoresis (Cunningham, Kittikamron, & Lu, 1996) techniques have been developed for purifying various RNA species, the systems-level study of RNA modifications requires the ability to fractionate all species of ncRNA from a single sample of total RNA, which poses a challenge to most RNA purification methods. RNA separation techniques had steadily improved over the last half-century, with each breakthrough leading to improved resolution, sensitivity, reproducibility and ease-of-use. Density gradient centrifugation was replaced by polyacrylamide slab gel electrophoresis (Lewicki & Sinskey, 1970; Varricchio & Ernst, 1975), which in turn is currently being replaced by capillary electrophoresis (CE) and liquid chromatography (LC) (Biba et al., 2013; Katsivela & Hofle, 1995; Skeidsvoll & Ueland, 1996; Warren & Vella, 1995). Here we review strengths and weaknesses of the latter two approaches and then focus on the most efficient approach to complete resolution of ncRNA species.
The choice of RNA purification method is largely dependent on the length, and thus molecular weight, of the RNA of interest. Denaturing pulsed-field CE offers unparalleled resolution for large RNA molecules longer than 2000 nucleotides (nt) while anion exchange (AX) and ion-pair reverse phase (IP RP) chromatography are generally used for smaller RNA species (∼10 nt – 600 nt) (Azarani & Hecker, 2001; Easton et al., 2010; Koubek, Lin, Chen, Cheng, & Huang, 2013; Li et al., 2012; Li, Dou, Ni, Sumitomo, & Yamaguchi, 2010; McCarthy, Gilar, & Gebler, 2009; Shanagar, 2005; Waghmare, Pousinis, Hornby, & Dickman, 2009). Size exclusion chromatography (SEC) bridges this gap in separating RNA species ranging from ∼20 to 2500 nt in length (Chionh et al., 2013; I. Kim et al., 2007). Affinity chromatography, on the other hand, is suitable for the targeted isolation of tagged RNA species and sequences, but efficiency falls off for longer RNA species (Aviv & Leder, 1972; Kieft & Batey, 2004; Luo, Eldho, Sintim, & Dayie, 2011; Srisawat & Engelke, 2001; Srisawat, Goldstein, & Engelke, 2001; Walker, Scott, Srisawat, & Engelke, 2008; Ward, Gunaratne, & Garcia-Blanco, 2014). AXC, IP RPC and SEC are suitable for native tRNA isolation from crude cellular total RNA, with IP RPC further fractionating total tRNA into multiple tRNA peaks (Chionh et al., 2013; Waghmare et al., 2009), though this level of resolution is not likely to be useful do to the lack of characterization of the individual fractions. Furthermore, the triethylammonium ions used in IP RPC for the neutralization of the polyanionic RNA molecules should be removed prior to LC-MS to prevent ionization suppression and contamination of the MS. SEC, conversely, is tractable and readily multiplexed to other online LC systems (such as IP RPC) for orthogonal separations and to various MS systems for detection (Fujii et al., 2014), making it ideal for the downstream analysis of modified ribonucleosides.
Building on the utility of SEC, we developed a multi-dimensional SEC-based method for non-denaturing purification of ncRNA by analytical or semi-preparative scale high-performance liquid chromatography (HPLC) (Chionh et al., 2013). The system demonstrates sufficient separation of major species of ncRNA of varying sizes from miRNA to 28S rRNA. The method uses Bio SEC3 300Å or Bio SEC5 1000Å columns (Agilent Technologies) on an Agilent 1200 HPLC system to achieve one-dimensional separation using an isocratic elution with 100mM ammonium acetate (pH 7.0) at a temperature of 60°C to minimize cross-hybridization entanglement of RNA species. The Bio SEC3 300Å column sufficiently resolves small the ncRNA (tRNA; 5S, 5.8S rRNA) but not large ncRNA (16S, 18S, 23S, 26S rRNA), while the Bio SEC5 1000Å column resolves large ncRNA but not small ncRNA. By positioning both SEC3 300Å and SEC5 1000Å columns in tandem, coupled to a valve switching device, a two-dimensional SEC HPLC configuration is achieved that allows good resolution of the entire range of major ncRNA species in a single run (Chionh et al., 2013). Total RNA is first injected onto the SEC5 column to resolve large ncRNA from the small ncRNA. The eluting small ncRNA fraction is then directed to the SEC3 column to resolve each small ncRNA species. The large ncRNA bypasses the SEC3 column and is eluted for collection of individual fractions. It should be noted that, while the 2D-SEC HPLC platform provides an efficient means to purify all ncRNA, individual 1D SEC HPLC systems can be employed separately to achieve the same results albeit with additional steps in processing.
A major problem facing all of these RNA purifications strategies involves contamination of individual ncRNA species with fragments arising from degradation of larger species or from smaller species by cross-hybridization during the chromatography. One can minimize degradation with careful and gentles RNA isolation and one can address contamination using RNA-seq or Northern blots to identify and quantify contaminating species. However, contamination is inevitable and must be considered in any analysis of modified ribonucleosides presumed to arise in a specific ncRNA species. Ultimately, LC-MS-based modification mapping strategies RNAs (Castleberry & Limbach, 2010; C. T. Chan et al., 2012; Hossain & Limbach, 2007) can be used to define the association of RNA modifications with specific RNA species.
2.3 RNA hydrolysis
With purified RNA in hand, the next step is to hydrolyze the RNA into oligonucleotide fragments or individual ribonucleotides, with the latter dephosphorylated to ribonucleoside form for LC-MS analysis. The oligonucleotides are used for localizing and quantifying modified ribonucleosides in specific tRNA species (Castleberry & Limbach, 2010; C. T. Chan et al., 2012; Hossain & Limbach, 2007), while the ribonucleosides can be identified and quantified by LC-MS as discussed later in this chapter. We focus here on the hydrolysis of RNA into ribonucleosides for analysis of stress-induced changes and patterns in translational response mechanisms.
There are several methods for hydrolyzing RNA into ribonucleosides. The classical approach of dephosphorylating ribonucleotides released by alkaline hydrolysis, which exploits the nucleophilicity of the 2′-hydroxyl group, causes degradation of many labile modifications (Taniguchi et al., 2013), while it is inhibited by ribonucleosides with 2′-O-methylation, most abundantly found in eukaryotic rRNA (Birkedal et al., 2015). A more rigorous approach involves enzymatic hydrolysis of RNA under conditions of physiological pH. Traditionally, a two-step method involving three enzymes has been used (C. T. Chan et al., 2010; P. F. Crain, 1990). RNA is incubated with nuclease P1 at acidic pH (5.3) for a few hours to overnight at 37 °C, followed by adjustment of the pH to 8.5 and addition of snake venom phosphodiesterase I (PDE I) to complete the hydrolysis and calf intestine phosphatase (CIP) to dephosphorylate the ribonucleotides. PDE I is used in combination with nuclease P1 because certain modified ribonucleosides are resistant to cleavage by the latter. In some cases, PDE I has been used alone overnight to achieve complete hydrolysis (Klootwijk & Planta, 1973), but the completeness of the hydrolysis has not been established.
This two-step, three-enzyme method is time-consuming and exposes RNA to both acidic and alkaline pH values for extended periods, which increases the risk of degrading sensitive ribonucleosides, as discussed shortly. To address these issues, we developed an enzymatic approach that completely hydrolyzes and dephosphorylates RNA in a single 3-hour step (Su et al., 2014). Instead of nuclease P1, a highly robust and efficient endonuclease, benzonase, is used simultaneously with PDE I and CIP to hydrolyze the RNA and dephosphorylate the ribonucleotides. All three enzymes work at pH 7.8 and the high efficiency of benzonase allows complete hydrolysis within in a few hours. One note of caution is that benzonase requires Mg2+ that can alter the chromatographic behavior of nucleophilic and negatively charged ribonucleosides during reversed-phase HPLC. We have observed this behavior with 5-carboxymethyluridine (cm5U), presumably through the coordination of its carboxylic acid group with Mg+2 (unpublished observation).
At this point, it is important to discuss the risks of adventitious chemical alterations of modified ribonucleosides during RNA isolation, purification and hydrolysis. A widely known example is the claim that most of the N6-theronylcarbamoyladenosine (t6A) observed in E. coli tRNA arises from the adventitious ring-opening of its cyclic form, ct6A, during RNA hydrolysis (Taniguchi et al., 2013). By performing the digestion at neutral pH and shortening reaction time, Miyauchi et al. were able to see a significant increase in the level of ct6A. They also reported that the primary amines of the commonly used buffer Tris (tris(hydroxymethyl)aminomethane) act as nucleophiles to cleave the ring structure of ct6A and form a Tris-t6A adduct (Miyauchi et al., 2013). We have also observed increased detection of ct6A and reduced levels of t6A during benzonase digestion of RNA (Su et al., 2014) when ammonium acetate is used as the buffer in place of Tris during hydrolysis of Mycobacterium smegmatis tRNA (unpublished data). Other adventitious reactions can be avoided with additives during the isolation and hydrolysis. For instance, CIP sold by some commercial vendors possesses significant adenosine deaminase activity, which, if not properly controlled, can lead to biologically irrelevant levels of inosine (I) (Dong, Wang, Deen, & Dedon, 2003). To avoid this reaction, we frequently include coformycin, an adenosine deaminase inhibitor, and tetrahydrouridine, a cytidine deaminase inhibitor, in hydrolysis reactions (Su et al., 2014). Another set of additives that we frequently add during hydrolysis includes antioxidants such as butylated hydroxytoluene, a free radical scavenger, and deferoxamine, a potent iron chelator that inhibits iron-based Fenton chemistry. The presence of these antioxidants could explain our ability to detect 5-hydroxycytidine (oh5C), an extremely redox-sensitive ribonucleoside species, in the 23S E. coli rRNA (unpublished data). There are conflicting reports of this unstable RNA modification using similar LC/MS methods (Havelund et al., 2011).
2.4 HPLC resolution of modified ribonucleosides
Historically, reverse phase (RP) HPLC with or without ion-pairing has used for separation of nucleosides (Buck, Connick, & Ames, 1983; Gehrke & Kuo, 1989; Gehrke, Kuo, McCune, Gerhardt, & Agris, 1982; Gehrke, Kuo, & Zumwalt, 1980; Pomerantz & McCloskey, 1990; Werner, 1993). The use of ion pairing agents is not recommended for in-line MS analysis, so we will not address this method here. When designing or choosing a method for separation of modified ribonucleosides for LC-MS analysis, it is important to consider the major factors affecting retention and separation, including the nature of the stationary and mobile phases, and the pH. Polar nucleosides are poorly retained on standard C18 RP columns, so manufacturers have expanded the choice of columns by polar functionalization of the C18 solid phase allowing for increased retention of polar compounds. Each type of functionalization yields different retention and elution times, thus columns should be tested for particular applications. Unlike traditional C18 columns, the polar functionalized C18 columns are compatible with 100% water, thus 100% water or buffer is used as mobile phase A and 100% methanol or acetonitrile as mobile phase B. Additives such as 0.1% formic acid or 10 mM ammonium acetate (pH 4.5) added to both mobile phases increases the ionization of analytes, particularly those eluting in 100% water. Note that use of ammonium acetate results in ammonium adducts of many ribonucleosides, which should be considered during mass spectrometry acquisition steps. Using 100% mobile phase A for 3-6 min allows sufficient retention and separation of the highly polar ribonucleosides, such as pseudouridine, modified uridines – which are common at the wobble position of tRNA (Agris, 1991; C. T. Chan et al., 2010) -- as well as uridine and cytidine, while multiple gradients to achieve 6% mobile phase B improves separation and decreases run time (Buck et al., 1983; C. T. Chan et al., 2010; Pomerantz & McCloskey, 1990; Su et al., 2014).
There are some predictable chromatographic behaviors of nucleosides that assist in developing LC methods and discovering new nucleosides. As noted earlier, RP columns have poor retention of polar compounds, so pyrimidine ribonucleosides generally elute prior to purine ribonucleosides due to their increased polarity. If 2-deoxyribonucleosides are included in the sample, they elute after their equivalent ribonucleoside with the exception of thymidine that elutes with purines. Modification of the nucleosides on the sugar or base alters the elution behavior. The abundant 2′-O-methylation of ribose decreases polarity, thus causing these ribonucleosides to elute after their unmethylated counterparts (Buck et al., 1983; C. T. Chan et al., 2010; Farand & Gosselin, 2009; Pomerantz & McCloskey, 1990; Su et al., 2014). The low pH of mobile phases used in positive ion mode MS causes protonation of basic groups on nucleosides, which results in increased polarity and reduced retention time (Gehrke et al., 1980). Therefore, additives and mobile phase pH will affect polarity and retention of ribonucleosides according to their acid-base properties.
As uridine and its modified derivatives often elute near the solvent front, alternatives to RP HPLC, such as hydrophilic interaction chromatography (HILIC), are useful to enhance retention and resolution of polar compounds (Alpert, 1990; Zhao et al., 2013). HILIC retains polar compounds through interaction with the hydrophilic solid phase enhanced by a high percentage organic mobile phase. Similar to RP HPLC, the percent organic solvent has a strong influence on retention, with less significant pH effects (Alpert, 1990; Guo & Gaiki, 2005). This is an important consideration when using MRM for quantification as enhanced retention and resolution will decrease the compounds screened and increase the scan time for MS analysis. HILIC is also useful when in-line pre-columns when high organic mobile phase are used, as has been applied to quantification of urinary nucleosides (Tuytten et al., 2008). Ribonucleoside separation for LC-MS analysis does not require baseline separation of modified nucleosides, thus shorter runtimes are feasible with UPLC systems and sub-2 μm particle size columns (Farand & Gosselin, 2009; Zhou et al., 2014). Regardless of separation method, the MS instrument sensitivity and co-elution of modified nucleosides should be evaluated for specific applications as this will be a limiting factor.
2.5 Ribonucleoside identification and structural characterization
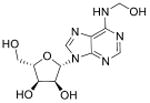
A major challenge in quantitative analysis of tRNA modifications is limited information about the full set of modified ribonucleosides in an organism. Apart from well-studied species such as humans, yeast and E. coli, there are no other organisms for which the complete set is known. This dilemma is resolved to an extent by the high degree of conservation of a core set of modified ribonucleosides, such as singly methylated nucleobases, in every organism. However, systems-level analyses of modification reprogramming in tRNA and other RNA species requires identification of all modifications, both known and novel. Though >120 RNA modifications have now been reported (Machnicka et al., 2013), two-thirds were discovered before 1980 (Cantara et al., 2011), which represent the most abundant modified ribonucleosides. Less abundant and unstable species are only recently being discovered as more sensitive technology is brought to bear on the problem and attention is paid artifact-free RNA extraction and isolation (Fu et al., 2013; Giessing et al., 2009; Miyauchi et al., 2013). High mass-accuracy and tandem quadrupole mass spectrometric methods have emerged in the past decade as the standard tools for identifying and characterizing modified ribonucleosides, which has greatly aided RNA modification discovery. For example, mass spectrometric methods have been used to discover a variety of new tRNA modifications in the past several years, such as 5-cyanomethyl uridine (cnm5U), cyclic N6-threonylcarbamoyladenosine (ct6A), geranylated 2-thiouridine (ges2U), geranylated 5-methylaminomethyl-2-thiouridine (mnm5ges2U), and geranylated 5-carboxymethylaminomethyl-2-thiouridine (cmnm5ges2U) and N6,N6-dimethyladenosine (m6,6A). Two of these (cnm5U and ct6A) were discovered by hypothesis-driven, targeted LC-MS/MS of unknown modified tRNA bases from isolated tRNA isoacceptors (Mandal et al., 2014; Miyauchi et al., 2013), while the other four were identified by data-driven chemical screens for ribonucleoside variants (C. T. Chan et al., 2011; Chen, Kowtoniuk, Agarwal, Shen, & Liu, 2009; Kellner, Neumann, et al., 2014; Su et al., 2014). Subsequently, the chemical structures of these modified ribonucleosides were validated by the comparison of LC retention times, tandem mass spectrometry (MSn) collision induced dissociation (CID) fragments and 1H- and 13C-NMR comparisons with those produced by synthetic standards (Table 1).
Table 1. Methods used in the discovery and characterization of RNA modifications (2009-2014).
| Identity | Symbol | Structure | RNA Species | Discovery | Validation | Quantification |
|---|---|---|---|---|---|---|
| 5-Cyanomethyluridine | cnm5U |
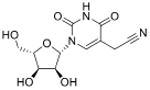
|
tRNA | Targeted analysis of mutant phenotype | Std, pMS3 | MRM |
| N6-Hydroxymethyladenosine | hm6A |
|
mRNA | Targeted analysis of modified synthetic ssRNA | Std, MS2 | MRM |
| N6-Formyladenosine | f6A |
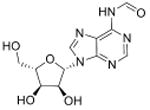
|
mRNA | Targeted analysis of modified synthetic ssRNA | Std, MS2 | MRM |
| Cyclic N6 Threonylcarbamoyl-adenosine | t6A |
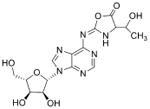
|
tRNA | Targeted analysis of natural product | Std, MSn, 18O-labeling, NMR | UV absorbance |
| 2-Geranylthiouridines* | ge5s2U |
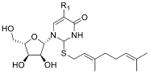
|
tRNA | LC-MS/MS screen of nucleotides | Std, MS2, 13C-labeling | External calibration |
| N6, N6-dimethyladenosine | m6,6A |
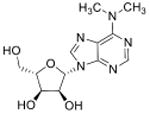
|
tRNA | LC-MS/MS screen of nucleotides | Std, pMS3 | MRM |
| 2,8-Dimethyladenosine | m2,8A |

|
rRNA | Targeted analysis of mutant phenotype | Std, MSn | Not performed |
| N-ribosylnicotinamide | r-NA |
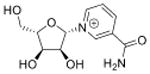
|
5′cap of sRNAs (>200 nt) | LC-MS/MS screen of nucleotides | Std, MS2, 13C-labeling | External calibration, 13C/15N-labeled isotope dilution |
| Co-enzyme A** | coA |

|
5′cap of sRNAs (>200 nt) | LC-MS/MS screen of nucleotides | Std, MS2, 18O-labeling | External calibration |
R1 can be hydrogen, methylaminomethyl- or carboxymethylaminomethyl- groups (Dumelin et al., 2012);
R2 can be hydrogen, succinyl-, acetyl- or methylmalonyl- groups (Kowtoniuk, Shen, Heemstra, Agarwal, & Liu, 2009); Std, synthetic standards; pMS3, pseudo-MS3 by controlled in-source fragmentation; MSn, tandem in-time fragmentation on ion-trap mass spectrometers.
Our laboratory has used a variety of approaches to defining the complete set of modified ribonucleosides in eukaryotes and prokaryotes, including a two-pronged chemical fingerprint-based screening strategy. The first uses neutral loss analysis to scan for molecules containing ribose or a 2′-O-methylribose among molecules with m/z ranging from 200-700. Digested ribonucleosides are resolved on a Hypersil gold aQ HPLC column (3 μm particle size; 150 × 2.1 mm; Thermo) on a Agilent 1290 uHPLC system using a two-component mobile phase (Solvent A: 100% ultrapure water with 0.1% formic acid v/v; Solvent B: 100% LC-MS-grade acetonitrile with 0.1% formic acid v/v) at flow rates of 0.3 mL/min under gradient conditions defined previously (Su et al., 2014). An Agilent 6460 triple quadrupole mass spectrometer with an ESI Jetstream ionization source operated in a positive-ion mode is used to acquire tandem-in-space information of the compounds found in the digestion mixture. In neutral loss mode, quadrupoles 1 and 3 are scanned together, but with constant mass offsets matching those of ribose (-132.0 m/z) and a 2′-O-methylribose (-146.0 m/z). This allows the selective recognition of all molecular ions that, by fragmentation in quadrupole 2, lead to the loss of an uncharged (hence, neutral) ribose or 2′-O-methylribose fragment – the defining molecular signatures of modified ribonucleosides. The presence or absence of known RNA modifications could be determined through targeted data extraction for ribose or 2′-O-methylribose containing precursor ions whose molecular masses corresponds to those cataloged in chemical databases such as Modomics (http://modomics.genesilico.pl/) (Machnicka et al., 2013), The RNA Modification Database (http://mods.rna.albany.edu/) (Cantara et al., 2011) and ChemSpider (http://www.chemspider.com/) (Little, Williams, Pshenichnov, & Tkachenko, 2012). However, without chemical standards to define retention time, this approach would fail to differentiate positional isomers. Both 3- and 5-methylcytidine, for instance, would produce the same precursor ions of 258.1 m/z, albeit at two different times along the total ion chromatogram. Hence, libraries of chemical standards are prepared and analyzed using the same analytical system with the subsequent comparison of retention times and fragmentation patterns allowing for the positive identification of known modified ribonucleosides. Another limitation of neutral loss analysis is the failure to detect pseudouridine and its hypermodified derivatives: 1-methylpseudouridine, m1Ψ; 3-methylpseudouridine, m3 Ψ; 2′-O-methylpseudouridine, Ψm; 3-(3-amino-3-carboxypropyl)pseudouridine, acp3Ψ; and 1-methyl-3-(3-amino-3-carboxypropyl)pseudouridine, m1acp3Ψ. In these modifications, the stable C–C glycosidic bond does not readily fragment to produce neutral loss of a ribose residue (Dudley et al., 2005).
This limitation is directly addressed by use of a complementary automated MS/MS structural assignment screen in which compounds are identified by combining accurate mass, isotopic distribution and fragmentation patterns. A quadrupole time-of-flight mass spectrometer (Agilent 6510 or 6520) was used to perform mass scanning and CID fragmentation and analyzed using both molecular feature extraction (MFE) and molecular structural correlation (MSC) (Agilent MassHunter software suite, B05.00) (Hill & Mortishire-Smith, 2005; Little, Cleven, & Brown, 2011; Little et al., 2012). Elemental compositions of unknown compounds could be determined using the nitrogen rule (McLafferty, 1993; Sparkman, 2007), Bristow's consideration for rings and double bonds based on the number of C, H and N atoms that a molecule contains (Bristow, 2006), and Kind and Fiehn's second isotopic signal intensity approach to structural assignment (Kind & Fiehn, 2006). More information on structural arrangements can be gleamed from the CID fragmentation patterns. Knowing breakages will occur at the weakest points of the ion allows one to determine which molecules contain a N-glycosidic linkage that fragments before other bonds in the nucleobase when sufficient energy is provided. For example, pseudouridine can be identified by the presence of its signature m/z 125 fragment from CID fragmentation, which corresponds to the nucleobase with a ribose C1 methylene group attached (Dudley et al., 2005). Comparison of the mass spectra against mock-digest controls, for example with heat-killed nucleases (Dumelin, Chen, Leconte, Chen, & Liu, 2012), and controls lacking RNA further narrow down the number of chemical entities to be considered. Together, integration of datasets from both neutral loss analysis and MFE-MSC screens provides a list of modified ribonucleoside candidates that can be confirmed by a variety of methods, including analysis of commercially available standard compounds, high mass-accuracy tandem MS (Lim, Chen, Sensenhauser, Cook, & Subrahmanyam, 2007), ion trap MSn mass spectrometry, controlled in-source fragmentation in space (pseudo-MS3) (C. T. Chan et al., 2011; Mandal et al., 2014), homonuclear 1H-2D-NMR (COSY, TOCSY and NOESY) or heteronuclear 1H-13C 2D-NMR (HMQC) (Reynolds & Enriquez, 2002), and by their characteristic chemical derivatization reactions (Kellner, Burhenne, & Helm, 2010).
2.6 Mass spectrometric quantification of modified ribonucleosides
Having identified the full set of modified ribonucleosides in the model cell type or organism, it is now possible to assess changes in the relative quantities of each ribonucleoside as a function of stress or environmental conditions. This systems-level analysis provides the initial insights into the translational control of the cell stress response in terms of mechanistic links between the reprogrammed tRNAs and selective translation of codon-biased mRNAs (Begley et al., 2007; C. T. Chan et al., 2010; C. T. Chan et al., 2012; T. Y. C. Chan et al., 2015). While descriptive analysis of ribonucleosides using MS was established two decades ago (Pomerantz & McCloskey, 1990; Suzuki, Ikeuchi, Noma, & Sakaguchi, 2007), quantitative MS analysis of ribonucleosides presents significantly greater challenges (Russell & Limbach, 2013; Su et al., 2014). Both relative and absolute quantification are best achieved using HPLC-coupled tandem or triple quadrupole (QQQ) mass spectrometry (LC-MS/MS) with electrospray ionization (ESI), given the increased sensitivity over other instrument types. In a mixture of ribonucleosides progressively eluting from the HPLC column in LC-MS/MS, individual ribonucleosides are ionized by ESI and then propelled into the first quadrupole (Q1) for initial detection. With the QQQ programmed to operate in multiple reaction monitoring (MRM) mode, which is used to instruct the system to acquire data for each ribonucleoside and its predictable MS behavior, the ion of interest (parent ion) is pre-selected in Q1 and then fragmented in the collision cell (Q2), followed by the selection of specific fragment ions (product ions) in the third quadrupole (Q3) (Fig. 3). The LC-coupled QQQ system enables the use of a dynamic MRM (DMRM) program, which allows the instrument to acquire MRM data only during the elution time window of each targeted ribonucleoside resolved on the HPLC column. The DMRM setting can minimize the waste of MS duty cycle, reduce concurrent ion transitions, and optimize dwell time and peak symmetry, which leads to further improvement of sensitivity and accuracy. In all types of quantitative analysis, however, it is critical to optimize the MS parameters for each ribonucleoside using either manual approaches or MS-specific software (Su et al., 2014).
Figure 3.
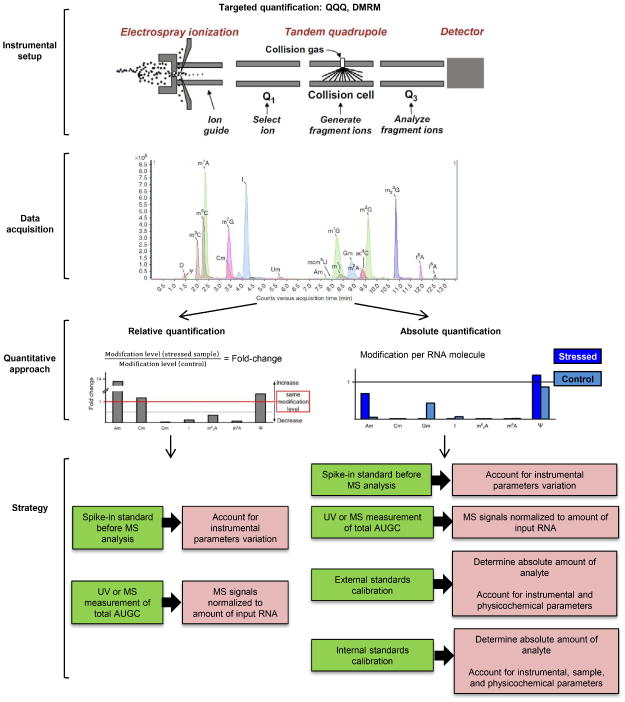
Conceptual workflow for targeted quantification of modified ribonucleosides by LC-MS/MS. Instrument set up: The MS system is programmed with a work list containing estimated retention times and CID transition information for each ribonucleoside, with dynamic MRM (DMRM) mode for data acquisition. Data acquisition: The signal intensity for each ribonucleoside is acquired in DMRM mode as the ribonucleoside elutes from the HPLC, with the peak area calculated from these data. Quantitative approach: Relative quantification provides fold-change information for stress-induced changes in modification levels (left), while absolute quantification indicates the abundance of the ribonucleoside in measurements per nucleotide or per tRNA molecule (right). Strategy: Steps to achieve precision and accuracy in both relative (left) and absolute (right) quantification are illustrated. Refer to main text for detailed description.
While quantification of relative changes (i.e., fold-change) in ribonucleoside levels among samples is significantly easier (and more common) than absolute quantification (mass or moles), both approaches require control over a variety of parameters to achieve high precision (i.e., small variation in repeat or replicate analyses) and, in the case of absolute quantification, accuracy. Absolute quantification of ribonucleosides involves correlating the signal intensity with the analyte amount using a response factor (Fig. 4), though variation in the response factor can lead to poor precision during relative quantification. The response factor in mass spectrometry depends on at least 3 parameters, namely (i) instrumental parameters, (ii) sample parameters and (iii) physicochemical parameters of the analyte/solvent system. A point in case is the recent report by the Limbach group, in which the reproducibility of modified nucleoside quantification by LC-UV/MS in four replicative measurements was analyzed. For MS detection, the average percent relative standard deviation (RSD) in peak areas measured for the ions was 5.9%. RSD variability in MS peak areas in this study ranged from 1.0 to 12.4% (Russell & Limbach, 2013). Instrumental parameters take account of the instrumental settings and performance of the source, the analyzer (Q1, collision cell, Q3) and the detector. To minimize the problem on quantitative precision and accuracy caused by variation in instrument parameters over time, a synthetic standard such as 15N5-2-deoxyadenosine (15N5-dA) with known concentration can be spiked into the processed analyte immediately before LC-MS/MS analysis and then quantified by the DMRM program together with the targeted transitions (Figs. 3, 4). The MS signals of [15N5]-dA from different analyses are eventually used to account for hour-to-hour and day-today variations in instrumental parameters (Su et al., 2014). The sample parameters include salt load and any unknown impurities in the samples that might affect the MS detection due to ion suppression. The physicochemical parameters take account of the buffer pH, as well as the elution and ionization efficiency of the analyte in the solvent system. The inherent complex nature of response factors in MS highlights the importance of developing a robust and reproducible method to determine relative and absolute abundance of modified ribonucleosides in an experiment.
Figure 4.
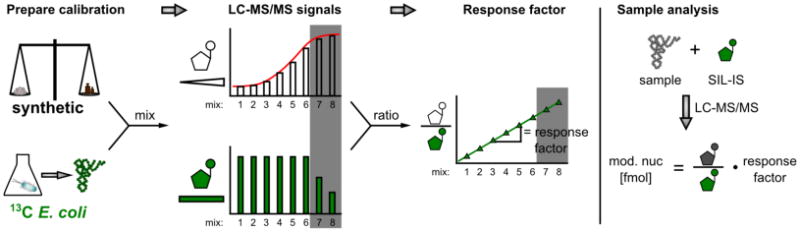
Calibration measurements to determine the mass spectrometric response factor for a ribonucleoside in absolute quantification approaches. The synthetically available and biosynthetically produced SIL-IS are mixed in different ratios (SIL-IS concentration is kept constant). The calibration mixes are then measured and the signals plotted. The increasing amounts of the unlabeled ribonucleoside results in a sigmoid signal plot. The gray area indicates reduced signals due to saturation effects. The signal ratios of unlabeled and labeled analyte are plotted and the slope determined. The slope represents the response factor of the analyte. Note the extended dynamic range in the gray area (saturation range). Adapted and modified from (Gu, Begley, & Dedon, 2014; Kellner, Ochel, et al., 2014; Su et al., 2014)
The relative quantification approach is applied to compare the fold-changes in modification levels between stressed samples and untreated controls (Fig. 3). To ensure accurate quantitative comparison of changes in modified ribonucleosides across different samples, the MS signals of individual modified ribonucleosides should be normalized to the input RNA concentration in each fully processed sample at the time of LC-MS analysis (Fig. 3). This precaution is needed to prevent imprecision and inaccuracy in quantification by accounting for any loss of RNA during sample processing before LC-MS analysis or variations in sample loading. To accurately assess the concentration of input RNA during LC-MS analysis, the canonical ribonucleosides (i.e., cytidine, uridine, guanosine, and adenosine) can be quantified by MS in a second run on the instrument with known dilution of the original sample. Alternatively, an in-line UV absorbance detector can be used with an external calibration curve to quantify the canonical ribonucleosides and normalize the ribonucleoside signal intensities.
To achieve absolute quantification of modified ribonucleosides, external calibration or isotope-dilution techniques can be applied, with the latter providing the greatest possible precision and accuracy (Figs. 3, 4). An external calibration curve with unlabeled standards can be plotted by injecting serial dilutions of synthetic standard solutions of defined concentrations into LC-MS system, with the absolute amount of each modified ribonucleoside determined from the calibration curve at the linear dynamic range. Ideally, the standard should be identical to the analyte for maximal accuracy, but a structurally homologous ribonucleoside can also be used in the calibration curve of an identical standard is not available, with due caution in interpreting the absolute quantification data. External calibration using quantifiable standards accounts for the instrumental parameters and physiochemical parameters, but does not account for the sample parameters, which include salt load and unknown impurities in the sample. Again, caution must be applied in interpreting these estimates of absolute quantities determined by external calibration.
For absolute quantification by isotope-dilution MS (Fig. 4), internal standards labeled with stable isotopes (i.e., isotopomers), such as deuterium (D), carbon (13C) and nitrogen (15N), are added to samples prior to LC-MS/MS analysis and ideally during the RNA hydrolysis step to account for losses at that stage. Since labeled and unlabeled nucleosides have identical physicochemical properties, the influence of instrumental (i), sample (ii) and physicochemical (iii) parameters are accounted for in the signal intensities of both the standard and analyte, including in particular contaminations that may suppress ionization. The use of internal standards thus allows highly accurate and precise comparisons among samples and experiments (Fig. 4).
The major limitation of absolute quantification using isotope-labeled internal standards is the availability of the standards. There are commercial sources for a few isotopically labeled ribonucleosides and several research groups have synthesized specific standards (Brandmayr et al., 2012; Hienzsch, Deiml, Reiter, & Carell, 2013). To overcome this limitation, Helm and coworkers developed a biosynthetic approach that is accessible to any laboratory equipped for LC-MS work. The approach involves growing E. coli (or the organism of interest) in minimal-medium containing [13C]-glucose as the only carbon source; it is also possible to adapt the method to use [15N]-labeled nutrients for additional isotopic labeling. The labeled RNA can then be isolated and hydrolyzed, with individual ribonucleosides purified by HPLC, or the mixture used to spike samples directly (Fig. 4). The initially unknown amounts of the various modifications in the mixture of isotope-labeled ribonucleosides can be determined and validated by a combination of external calibration, internal standard, and spike-in methods (Figs. 3, 4). This accounts for variations of instrumental parameters, physicochemical parameters, and in particular of sample parameters. This was shown by comparing the RSD (relative standard deviation) of the mass signal (RSD∼24%) over 12 weeks with the RSD of the response factors (RSD∼2%). Consequently, the method allows, in addition to comparison of the relative modification content of related samples, an absolute quantification, limited to those nucleosides available in weighable quantities (Buchhaupt et al., 2014; Spenkuch et al., 2014). The method also extends the linear dynamic range for quantification by two orders-of-magnitude by equalizing ion suppression effects due to saturation (gray area in Fig. 4) (Kellner, Ochel, et al., 2014).
2.7 Analysis of stress-induced reprogramming of modified ribonucleosides in total tRNA
The datasets of modified ribonucleosides in treated and control cells must next be subjected to systems-level interrogation to detect stress-specific patterns of change and links to up-and down-stream regulatory mechanisms in translational aspects of the stress response. Emerging evidence points to tRNA modifications as regulatory elements that dynamically reprogram following stressful conditions to control selective translation of critical stress response proteins (Begley et al., 2007; C. T. Chan et al., 2010; C. T. Chan et al., 2012; Patil et al., 2012; Rezgui et al., 2013). In this section, the strategy for exposing cells and then assessing this dynamic repertoire of modified ribonucleosides is discussed as a series of steps, with the approach extended to interpreting stress-specific signature tRNA modification patterns that are mechanistically linked to codon-biased genes (C. T. Chan et al., 2012).
Step 1: Establish a biological endpoint for the exposure
The experimental design for quantitative studies of stress-induced reprograming of tRNA modifications must include a quantifiable end-point or anchor, such as cell death, apoptosis, or some other measurable phenotypic change, for determining the exposure dose and the exposure duration. This phenotypic anchor allows meaningful comparisons among mechanistically different stressors or stress-inducing conditions and among different time points following exposure. In such studies, cell sensitivity is defined in relatively detailed dose-response analyses to identify the doses producing, for example, 20%, 50% and 80% response (e.g., Fig.5). The coverage of low, medium and high killing concentrations can facilitate the identification of any dose-specific tRNA modification changes.
Figure 5.
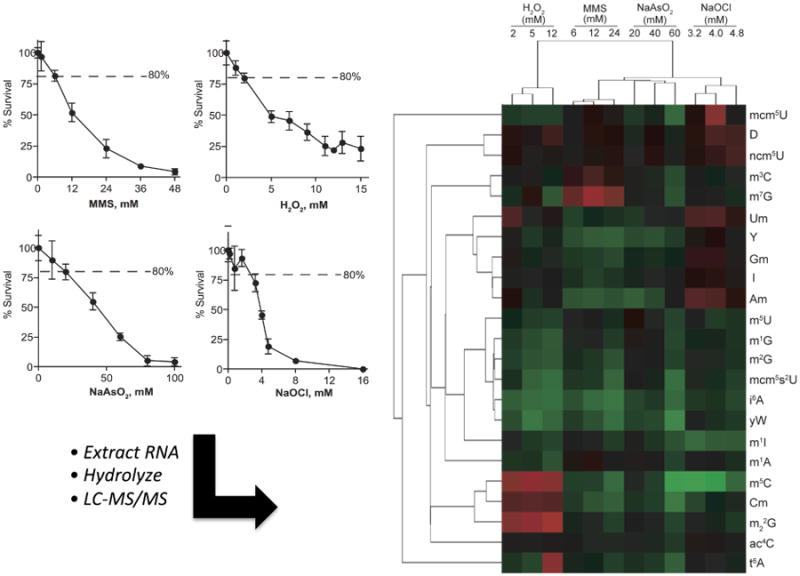
Stress-induced reprogramming of tRNA modifications analyzed by quantitative LC-MS/MS. To assess the reprogramming of tRNA modifications in cells exposed to different toxic stresses, cytotoxicity dose-response curves were determined for S. cerevisiae exposed H2O2, MMS, NaAsO2 and NaOCl (Left panel). Following exposure of cells to equi-toxic doses of each toxicant (LC20, LD50, LD80), tRNA was isolated and hydrolyzed, and each modified ribonucleoside was subjected to LC-MS/MS analysis. The data were used to calculate fold-change values for exposed cells compared to unexposed controls, with the fold-change data analyzed by hierarchical clustering analysis (Right panel) to reveal stress-induced tRNA modification signatures. Cytotoxicity plots and heatmap image were adapted from Chan et al. (C. T. Chan et al., 2010).
Step 2: Post-exposure processing to stop reactions
Using the established stress conditions, the quantitative platform can be applied to analyze changes in the levels of each modified ribonucleoside from cells exposed to a set of diverse toxicants. It is important to immediately process the exposed cells at the defined end point to stop all cellular processes, since the tRNA modification changes are still subject to change if biologically friendly conditions exist during the post-exposure processing steps. To this end, the cells should either be snap-frozen in liquid nitrogen, possibly following a brief 4 °C centrifugation to create a cell pellet, or the cells should be subjected to denaturing conditions such as immediate addition of phenol-containing RNA extraction reagents.
Steps 3-6: RNA isolation, tRNA purification, tRNA hydrolysis and LC-MS/MS analysis as described in Sections 2.1-2.6
Step 7: Data normalization and calculation of fold-change values
Following LC-MS/MS analysis, the normalized signal intensity for each ribonucleoside in the various sample data sets is now used to calculate a fold-change value relative to the unexposed control sample. It is important to point out that, for large numbers of samples, the LC-MS/MS analysis should be performed for complete replicate exposure sets, including a control sample, to minimize day-to-day analytical variance. In addition to the presence of [15N]-dA, the fold-change calculation based on samples analyzed the same day removes any variance introduced by machine response changes.
Step 8: Multivariate statistical analysis to find patterns and mechanistic links
The fold-change values are now analyzed using multivariate statistic tools, such as hierarchical clustering and principal component analysis, either as mean values for each replicate dataset or as individual datasets. The intent of MVS analysis is to find patterns of covariance among the ribonucleoside fold-change data, which suggests biological relatedness of potential mechanistic significance. An example of hierarchical clustering of fold-change datasets is shown in Figure 5 for budding yeast exposed to four mechanistically distinct toxicants. The MVS analysis distinguished both toxicant- and dose-specific patterns, with the patterns amounting to stress-specific tRNA modification signatures. The heat maps from hierarchical clustering and scores and loadings plots from PCA analysis reveal specific tRNA modifications as candidates for mechanistic linkage to subsequent biological response. Such stress-related patterns of tRNA modification reprogramming have been demonstrated to drive selective translation of codon-biased stress response genes (C. T. Chan et al., 2012). For example, m5C is uniquely up-regulated by H2O2 exposure (Fig. 5), with subsequent analysis revealing the presence of m5C specifically increased at the wobble position of tRNALeu(CAA) (C. T. Chan et al., 2012). Wobble modifications are thought to be critical for enhancing wobble decoding and therefore affecting translational efficiency (Agris, 2004, 2008; Agris et al., 2007; Huang, Lu, & Bystrom, 2008; Kruger, Pedersen, Hagervall, & Sorensen, 1998; Murphy, Ramakrishnan, Malkiewicz, & Agris, 2004). Changes in the levels of wobble modifications in response to stress can therefore regulate the expression of certain response genes through enhanced decoding of specific codons. These genes, termed Modification-tunable transcripts (MoTTs), have been demonstrated to contain statistically significant usage of specific degenerate codons (Begley et al., 2007; Dedon & Begley, 2014). In the instance of H2O2-induced increases in wobble m5C in tRNALeu(CAA), there was an associated up-regulation of proteins coded by genes enriched with its cognate codon, TTG, with loss of the enzyme responsible for inserting m5C, Trm4, causing loss of this codon-biased translational response as well as hypersensitivity to the toxicity of H2O2 exposure (C. T. Chan et al., 2012). Similar observations have been made for Trm9-dependent wobble modifications mcm5U and selective translation of UGU-enriched mRNAs (Begley et al., 2007). These observations demonstrate the strong mechanistic link between patterns of stress-altered modifications and selective translation of codon-enriched stress response genes. The major limitation of this approach of analyzing total tRNA populations is that the specific tRNA(s) containing stress-sensitive modified ribonucleosides cannot be identified, a problem resolved in the next section.
2.8 Analysis of stress-induced changes in modified ribonucleosides at specific locations in individual tRNA species
To make the mechanistic link between a stress-sensitive modified ribonucleoside and a specific tRNA and its anticodon, it is critical to know the location of the modification within one or more specific tRNA species. Here we describe two approaches to mapping tRNA modifications in a tRNA isoacceptor or isodecoder: affinity purification of individual tRNAs followed by MS-based sequencing analysis, or MS-based analysis in RNase-digested total tRNA populations.
Affinity purification of tRNAs
In order to study the function of individual modifications on a specific tRNA under stress conditions, it may be necessary to purify a target tRNA species from a complex mixture of RNAs. Here, we describe an affinity purification method using an oligo-based pull-down approach to isolate a single tRNA species from a crude tRNA mixture (C. T. Chan et al., 2012; Mandal et al., 2010; Suzuki & Suzuki, 2007). This approach exploits a solid-phase-bound oligodeoxynucleotide probe to hybridize to a unique sequence on the 3′ acceptor end of a specific.
Step 1: Attached biotinylated oligos to beads
Approximately 18 nmol of a 3′-end biotinylated 20-base oligodeoxynucleotide (IDT, Coralville, IA) that is complementary to the 3′ acceptor stem of a target tRNA (Fig. 6) is first bound to 0.2 mL of NeutrAvidin agarose beads (Thermo Scientific, Waltham, MA) for 10 min at ambient temperature.
Figure 6.
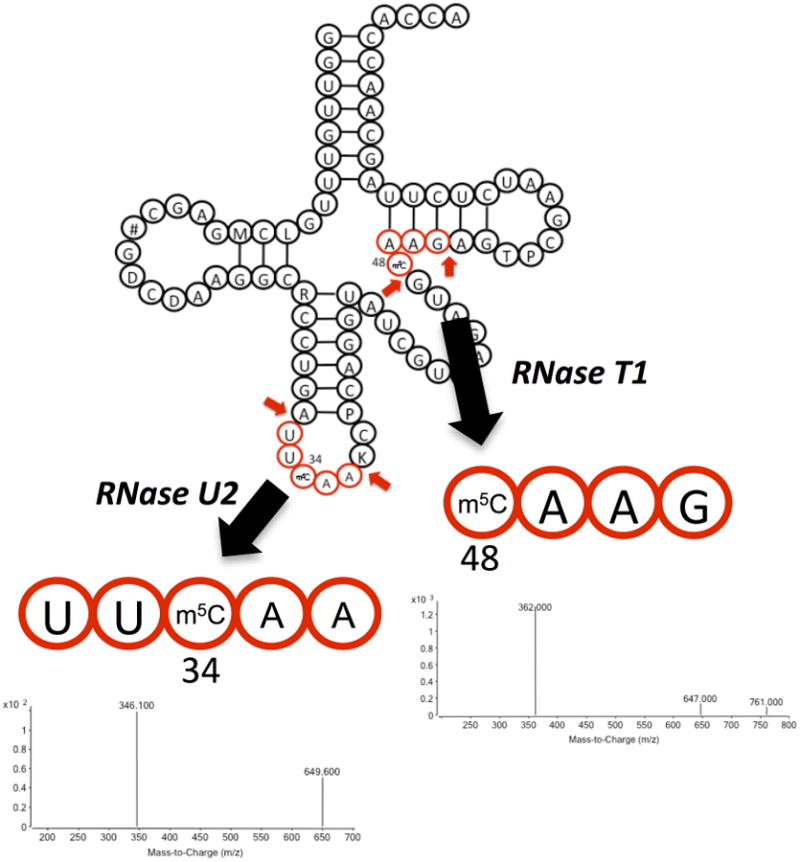
Quantitative mapping of modified ribonucleosides in a specific tRNA. To assess stress-induced changes in m5C levels in tRNALeu(CAA), two RNase-generated oligonucleotides possessing m5C-modified sites in this tRNA were identified using the Mongo Oligo Mass Calculator. RNase T1 yields a 4-mer oligonucleotide harboring either C or m5C at position 48 (CAAG), while RNase U2 produces a 5-mer oligonucleotide with C or m5C at the wobble position 34 of (UUCAA). The UUCAA oligonucleotide was sequenced and quantified by LC-MS/MS analysis with affinity-purified tRNA and the CAAG oligonucleotide was analyzed by LC-MS/MS analysis using total tRNA.
Step 2: Hybridize target RNA to bead-bound oligos
The oligodeoxynucleotide-modified beads are incubated with a crude tRNA sample in 6 × NHE (1.2 M NaCl, 30 mM HEPES-KOH, pH 7.5, and 15 mM EDTA) at 72 °C for 30 min, followed by cooling to ambient temperature over 80 min with occasional agitation.
Step 3: Washing to remove unbound RNA
The bead-bound complexes are then washed three times each with 3 × NHE, 1 × NHE and 0.1 × NHE, respectively, until the UV absorbance (260 nm) of the wash falls below 0.01.
Step 4: Elution of target RNA
Finally, the target tRNA is eluted from the beads in three washings involving incubation in 0.1 × NHE at 65 °C for 5 min at each elution step. The eluent should consist of a relatively pure sample of a single tRNA species that can be used for quantitative analysis of all modified ribonucleosides present in the tRNA (Section 2.6), for relative quantification of stress-induced changes in modifications (Section 2.7), and for mapping modified ribonucleosides and stress-induced changes in the tRNA (see below). This method can also be scaled up or down depending on the quantity of starting material as well as the expected quantity of the final product.
tRNA oligonucleotide fingerprinting by RNase digestion and LC-QTOF analysis
A much simpler approach to quantitative mapping of modified ribonucleosides in specific tRNAs can be achieved by direct MS analysis of total tRNA. The most effective approach here is an oligo fingerprinting method involving RNase digestion and MS analysis of the resulting oligonucleotides, as originally described by Limbach and coworkers (Castleberry & Limbach, 2010; Hossain & Limbach, 2007). This approach begins with defining the RNase digestion products arising in a mixture of tRNAs (Fig. 6), based on genome sequences of the full set of expressed tRNAs. Depending on the purity of the tRNA sample, either a single RNase or a cocktail of multiple RNases is used to generate oligonucleotides that are unique in terms of sequence. The oligo fingerprinting method is applicable to both pure and population tRNA samples and does not require an initial affinity purification step. The only requirements are that the oligonucleotide of interest be efficiently ionized (i.e., not suppressed by other co-eluting oligonucleotides), identifiable by a selectable m/z value in Q1, and amenable to CID fragmentation for both sequence confirmation and localization of the modified ribonucleoside (Fig. 6). It is best to have a synthetic oligonucleotide(s) as standards for the target oligonucleotide to allow HPLC elution and CID fragmentation patterns to be defined to facilitate analysis of the tRNA sample. It is often possible to synthesize the oligonucleotide with appropriately positioned modifications, depending upon the commercial availability of phosphoramidite versions of the modified ribonucleosides.
As shown in Figure 6, this RNase mapping approach is illustrated in our recent study assessing changes in the level of m5C at two positions in S. cerevisiae tRNALeu(CAA) (C. T. Chan et al., 2012).
Step 1: Define RNase digestion products
We first used the Mongo Oligo Mass Calculator (v2.06; http://library.med.utah.edu/masspec/mongo.htm) to determine that RNase T1 would yield a 4-mer oligonucleotide harboring either C or m5C at position 48 (CAAG), while RNase U2 to produce another unique 5-mer oligonucleotide with C or m5C at the wobble position 34 of (UUCAA).
Step 2: RNase digestion
We began with ∼2.5 μg of affinity-purified tRNALeu(CAA) (as described earlier) and digested it with 1 U RNase T1 (Ambion, Austin, TX) in 10 mM Tris buffer (pH 7.4) at 37 °C for 1 h. For RNase U2 digestion, we started with 0.5 mg of total tRNA and digested with 4 U of RNase U2 (Thermo Scientific, Waltham, MA) at 37 °C for 4 h. All oligoribonucleotides were dephosphorylated with alkaline phosphatase (10 U).
Step 3: LC-MS/MS analysis
In both cases, RNase digested tRNA oligos were resolved by LC-MS/MS (Agilent 6410) using RP-HPLC (C18 Hypersil GOLD aQ, 150 × 2.1 mm, 3 μm particle; Thermo Scientific) with an electrospray ionization source operated in negative ion mode. HPLC was performed with a gradient of acetonitrile in 8 mM ammonium acetate (0.2 ml/min, 45 °C): 0–2 min, 1%; 2–30 min, 1–15%; 30–31 min, 15–100%; 31–41 min, 100%. QQQ parameters: drying gas, 325 °C and 8 l min-1; nebulizer, 30 p.s.i.; capillary voltage, 3,800 V; dwell time, 200 ms. The Q1 and Q3 were set to unit resolution and the oligonucleotides containing m5C were identified by comparison with standards and CID fragmentation patterns generated in a QTOF MS. A selected ion chromatogram for a particular charge state of each oligo (unexposed and exposed to H2O2) was obtained, and the summation of the mass spectra over a particular peak was used for relative quantification of changes in m5C levels at positions 34 and 48 of tRNALeu(CAA) (C. T. Chan et al., 2012).
Step 4: Data analysis
These analyses revealed that H2O2 caused a 2-fold increase in m5C at the wobble position and a slight decrease in m5C at position 48, which was consistent with the observation of up-regulation of proteins from genes enriched with the TTG codon recognized by m5C-modified tRNALeu(CAA) (C. T. Chan et al., 2012).
3. Discussion
The recent resurgence of interest in the dozens of cellular RNA modifications reflects in part a new perspective on understanding them as a system in the context of other signaling pathways and networks. This perspective has motivated several groups to explore the potential of tRNA modifications to operate as a system in translational control of the cell stress response (Bauer & Hermand, 2012; Begley et al., 2007; C. T. Chan et al., 2010; C. T. Chan et al., 2012; Patil et al., 2012; Rezgui et al., 2013). Here we present a platform for a highly quantitative and sensitive systems-level analysis of RNA modifications that is applicable to any form of RNA. In the case of tRNA, this approach entails five steps: 1) tRNA isolation and purification, 2) hydrolysis of tRNA into individual ribonucleosides, 3) liquid chromatographic resolution of ribonucleosides, 4) identification of modified ribonucleosides by high-mass accuracy spectrometric methods, 5) quantification of ribonucleosides by tandem quadrupole mass spectrometry, 6) multivariate statistical analysis of RNA modification patterns, and 7) mapping of stress-altered ribonucleosides to specific tRNAs and locations. All of these steps can be customized to accommodate the abundance and stability of the full set of modified ribonucleosides in different biological systems.
The key feature of this RNA modification analysis platform is quantitative rigor. This is essential for exploring the regulatory characteristics exhibited by tRNA modifications in cellular stress response and exploring the mechanistic links to translational control of the response. For example, even small stress-induced changes in a low-abundance modified ribonucleoside in total tRNA could indicate a mechanistically critical stress-specific modification in a single tRNA species. These small changes at the population level must be detectable, which requires sensitivity and precision in the analysis.
To ensure quantitative rigor, there are several features of this method that need to be considered. The first critical step is to stop all cellular processes immediately at the end of the exposure period by snap-freezing or adding denaturants. While the exact kinetics of RNA modification changes have not been thoroughly established, the potential for artifacts is high in light of the striking changes that occur in tRNA modification patterns in relatively brief stresses. A second important consideration is RNA isolation and purification. Since almost all the various RNA species present in an organism contain modified ribonucleosides, it is crucial to start the analysis with RNA of high quality and purity. The RNA isolation method should minimize degradation and maximize the yield of the target RNA species. The two-column RNA isolation method described here has been validated for yeast and bacterial cells in terms of the isolation of all types of RNA with yields consistent with expectation. The SEC and RP HPLC methods described here will resolve all of the canonical ncRNA species in a single sample, though contaminating RNA fragments from larger RNA species is unavoidable. Ultimately, affinity purification of individual tRNA species will provide the highest possible purity. Clearly, the importance of the RNA purity must be balanced by time and cost.
The next key step is the hydrolysis of RNA into individual ribonucleosides for LC-MS analysis. While most RNA modifications are stable during commonly used RNA isolation and hydrolysis conditions, the cases of ct6A (Miyauchi et al., 2013) and oh5C (Havelund et al., 2011) point to the potential for adventitious pH effects and reactions with buffer components. Further, the presence of appropriate additives such as deaminase inhibitors and antioxidants can significantly reduce the chance of forming biologically irrelevant products. These problems suggest that there may be modifications eluding discovery due to their instability during RNA isolation, purification and hydrolysis.
It is also possible to miss even stable ribonucleosides if their physicochemical properties lead to poor resolution during the HPLC separation step prior to MS analysis. The choice of column and mobile phase can be empirically tuned to optimize resolution, detection and quantification of even the most polar and non-polar ribonucleosides, especially the low-abundance modified uridines important as wobble modifications. As with all other steps in this platform, it is important to consider potential confounders such as pH, adventitious reactions and ionization suppression by mobile phase components, and co-elution of isobaric ribonucleosides with similar CID fragmentation (e.g., methylated G). Overall, it is important to resolve individual ribonucleosides to reduce the number of co-eluting analytes and hence increase the sensitivity of MS quantification.
The prerequisite for using this analytical platform for quantification of tRNA modifications is knowledge of as many ribonucleosides as possible in the biological system under study. The current databases do not provide organism-centric lists of modified ribonucleosides and ribonucleosides have not been characterized in most organisms, though nearly complete lists can be assembled for well studied model organisms such as E. coli, S. cerevisiae and humans (Czerwoniec et al., 2009). Experience points to ∼70% conservation of the modification repertoire across different organisms, which reduces the work of defining the complete set. The approaches provided here, along with the growing literature on RNA modifications in different organisms, provide an efficient means to assemble ribonucleoside lists for any organism.
The LC-MS step presents its own challenges to obtaining biologically meaningful quantitative data for changes in the levels of modified ribonucleoside and to avoiding large variation among replicate datasets. For relative quantification, the key is to anchor (i.e., normalize) the MS signals of each ribonucleoside to the input tRNA concentration for every sample before using these normalized signals to compare between treated and control samples. These steps involve monitoring the total MS signal intensities of the canonical ribonucleosides, which reflect the amount of input tRNA. The use of the [15N]-dA internal standard also minimizes variation by providing a constant signal intensity to account for day-to-day variations in MS sensitivity. For absolute quantification, there are several issues presented by external calibration such as sample parameters that are beyond the scope of this method. Although the alternative method SIL-IS can overcome issues presented by external calibration, using SIL-IS for the analysis of the full ribonucleoside repertoire requires the corresponding synthetic isotopomer for every ribonucleoside, which is reasonably practical using biosynthetic standards isolated from cells grown in media with [13C]-glucose. Working in concert with commercially available standards, these approaches overcome issues of different instrumental and sample parameters in absolute and relative quantification while allowing for comparison of relative modification content of related samples.
Ultimately, the population-based analyses of tRNA modification reprogramming lead to the identification of stress-sensitive modifications that need to be further characterized in terms of their location in specific tRNA molecules. The two approaches of affinity-purification and population analysis of RNase digests provide a means to map ribonucleosides to specific tRNAs and to quantify stress-induced changes in the level of the modification at that site. This information is critical to making the mechanistic link between tRNA modification reprogramming and selective translation of codon-biased mRNAs. The proteomic and genomic tools needed to characterize the translational response are beyond the scope of this chapter, but are well described in the literature (Begley et al., 2007; C. T. Chan et al., 2012; T. Y. C. Chan et al., 2015; Tumu, Patil, Towns, Dyavaiah, & Begley, 2012).
In summary, we have presented a detailed description of a platform for quantitatively rigorous analysis of the system of RNA modifications. The emphasis here is not on protocols, which are all detailed in the literature. Instead, we have focused on the critical determinants of analytical sensitivity, specificity, precision and accuracy in an effort to ensure the most biologically meaningful data on mechanisms of translational control of cell stress response. The methods described here should find wide use in virtually any analysis involved RNA modifications.
Acknowledgments
The authors gratefully acknowledge current and former members of the Dedon Laboratory for their published and unpublished contributions to this chapter. Financial support for the work presented in this chapter was provided by the Singapore-MIT Alliance for Research and Technology, the National Institute of Environmental Health Science (ES017010, ES022858, ES002109), the National Science Foundation (CHE-1308839, MCB-1412379), the Howard Hughes Medical Institute for fellowship support for C.G., the Deutsche Forschungsgemeinschaft for fellowship support for S.K., the SMA3 Programme for fellowship support for W.M.C. and Y.H.C., and the NIEHS Toxicology Training Grant (T32-ES007020) for fellowship support for E.G.P. This publication is made possible by the Singapore National Research Foundation under its Singapore-MIT Alliance for Research and Technology research enterprise. The views expressed herein are solely the responsibility of the authors and do not necessarily represent the official views of the Foundation.
References
- Agris PF. Wobble position modified nucleosides evolved to select transfer RNA codon recognition: a modified-wobble hypothesis. Biochimie. 1991;73(11):1345–1349. doi: 10.1016/0300-9084(91)90163-u. [DOI] [PubMed] [Google Scholar]
- Agris PF. Decoding the genome: a modified view. Nucleic Acids Res. 2004;32(1):223–238. doi: 10.1093/nar/gkh185. [DOI] [PMC free article] [PubMed] [Google Scholar]
- Agris PF. Bringing order to translation: the contributions of transfer RNA anticodon-domain modifications. EMBO Rep. 2008;9(7):629–635. doi: 10.1038/embor.2008.104. [DOI] [PMC free article] [PubMed] [Google Scholar]
- Agris PF, Vendeix FA, Graham WD. tRNA's wobble decoding of the genome: 40 years of modification. J Mol Biol. 2007;366(1):1–13. doi: 10.1016/j.jmb.2006.11.046. [DOI] [PubMed] [Google Scholar]
- Akhtar S, Sarkar S, Mishra A, Sarkar D. A method to extract intact and pure RNA from mycobacteria. Anal Biochem. 2011;417(2):286–288. doi: 10.1016/j.ab.2011.06.028. [DOI] [PubMed] [Google Scholar]
- Alpert AJ. Hydrophilic-interaction chromatography for the separation of peptides, nucleic acids and other polar compounds. J Chromatogr. 1990;499:177–196. doi: 10.1016/s0021-9673(00)96972-3. [DOI] [PubMed] [Google Scholar]
- Arnvig K, Young D. Non-coding RNA and its potential role in Mycobacterium tuberculosis pathogenesis. RNA Biol. 2012;9(4):427–436. doi: 10.4161/rna.20105. [DOI] [PMC free article] [PubMed] [Google Scholar]
- Aviv H, Leder P. Purification of biologically active globin messenger RNA by chromatography on oligothymidylic acid-cellulose. Proc Natl Acad Sci U S A. 1972;69(6):1408–1412. doi: 10.1073/pnas.69.6.1408. [DOI] [PMC free article] [PubMed] [Google Scholar]
- Azarani A, Hecker KH. RNA analysis by ion-pair reversed-phase high performance liquid chromatography. Nucleic Acids Res. 2001;29(2):E7. doi: 10.1093/nar/29.2.e7. [DOI] [PMC free article] [PubMed] [Google Scholar]
- Batey RT, Kieft JS. Improved native affinity purification of RNA. RNA. 2007;13(8):1384–1389. doi: 10.1261/rna.528007. [DOI] [PMC free article] [PubMed] [Google Scholar]
- Bauer F, Hermand D. A coordinated codon-dependent regulation of translation by Elongator. Cell Cycle. 2012;11(24):4524–4529. doi: 10.4161/cc.22689. [DOI] [PMC free article] [PubMed] [Google Scholar]
- Begley U, Dyavaiah M, Patil A, Rooney JP, DiRenzo D, Young CM, et al. Begley TJ. Trm9-catalyzed tRNA modifications link translation to the DNA damage response. Mol Cell. 2007;28(5):860–870. doi: 10.1016/j.molcel.2007.09.021. [DOI] [PMC free article] [PubMed] [Google Scholar]
- Biba M, Welch CJ, Foley JP, Mao B, Vazquez E, Arvary RA. Evaluation of core-shell particle columns for ion-pair reversed-phase liquid chromatography analysis of oligonucleotides. J Pharm Biomed Anal. 2013;72:25–32. doi: 10.1016/j.jpba.2012.09.007. [DOI] [PubMed] [Google Scholar]
- Birkedal U, Christensen-Dalsgaard M, Krogh N, Sabarinathan R, Gorodkin J, Nielsen H. Profiling of ribose methylations in RNA by high-throughput sequencing. Angew Chem Int Ed Engl. 2015;54(2):451–455. doi: 10.1002/anie.201408362. [DOI] [PubMed] [Google Scholar]
- Bjork GR, Durand JM, Hagervall TG, Leipuviene R, Lundgren HK, Nilsson K, et al. Urbonavicius J. Transfer RNA modification: influence on translational frameshifting and metabolism. FEBS Lett. 1999;452(1-2):47–51. doi: 10.1016/s0014-5793(99)00528-1. [DOI] [PubMed] [Google Scholar]
- Brandmayr C, Wagner M, Bruckl T, Globisch D, Pearson D, Kneuttinger AC, et al. Carell T. Isotope-based analysis of modified tRNA nucleosides correlates modification density with translational efficiency. Angew Chem Int Ed Engl. 2012;51(44):11162–11165. doi: 10.1002/anie.201203769. [DOI] [PMC free article] [PubMed] [Google Scholar]
- Brawerman G, Mendecki J, Lee SY. A procedure for the isolation of mammalian messenger ribonucleic acid. Biochemistry. 1972;11(4):637–641. doi: 10.1021/bi00754a027. [DOI] [PubMed] [Google Scholar]
- Bregeon D, Colot V, Radman M, Taddei F. Translational misreading: a tRNA modification counteracts a +2 ribosomal frameshift. Genes Dev. 2001;15(17):2295–2306. doi: 10.1101/gad.207701. [DOI] [PMC free article] [PubMed] [Google Scholar]
- Bristow AW. Accurate mass measurement for the determination of elemental formula--a tutorial. Mass Spectrom Rev. 2006;25(1):99–111. doi: 10.1002/mas.20058. [DOI] [PubMed] [Google Scholar]
- Buchhaupt M, Sharma S, Kellner S, Oswald S, Paetzold M, Peifer C, et al. Entian KD. Partial methylation at Am100 in 18S rRNA of baker's yeast reveals ribosome heterogeneity on the level of eukaryotic rRNA modification. PLoS One. 2014;9(2):e89640. doi: 10.1371/journal.pone.0089640. [DOI] [PMC free article] [PubMed] [Google Scholar]
- Buck M, Connick M, Ames BN. Complete analysis of tRNA-modified nucleosides by high-performance liquid chromatography: the 29 modified nucleosides of Salmonella typhimurium and Escherichia coli tRNA. Anal Biochem. 1983;129(1):1–13. doi: 10.1016/0003-2697(83)90044-1. [DOI] [PubMed] [Google Scholar]
- Cantara WA, Crain PF, Rozenski J, McCloskey JA, Harris KA, Zhang X, et al. Agris PF. The RNA Modification Database, RNAMDB: 2011 update. Nucleic Acids Res. 2011;39(Database issue):D195–201. doi: 10.1093/nar/gkq1028. [DOI] [PMC free article] [PubMed] [Google Scholar]
- Carlile TM, Rojas-Duran MF, Zinshteyn B, Shin H, Bartoli KM, Gilbert WV. Pseudouridine profiling reveals regulated mRNA pseudouridylation in yeast and human cells. Nature. 2014;515(7525):143–146. doi: 10.1038/nature13802. [DOI] [PMC free article] [PubMed] [Google Scholar]
- Castleberry CM, Limbach PA. Relative quantitation of transfer RNAs using liquid chromatography mass spectrometry and signature digestion products. Nucleic Acids Res. 2010;38(16):e162. doi: 10.1093/nar/gkq578. [DOI] [PMC free article] [PubMed] [Google Scholar]
- Chan CT, Chionh YH, Ho CH, Lim KS, Babu IR, Ang E, et al. Dedon PC. Identification of N6,N6-dimethyladenosine in transfer RNA from Mycobacterium bovis Bacille Calmette-Guerin. Molecules. 2011;16(6):5168–5181. doi: 10.3390/molecules16065168. [DOI] [PMC free article] [PubMed] [Google Scholar]
- Chan CT, Dyavaiah M, DeMott MS, Taghizadeh K, Dedon PC, Begley TJ. A quantitative systems approach reveals dynamic control of tRNA modifications during cellular stress. PLoS Genet. 2010;6(12):e1001247. doi: 10.1371/journal.pgen.1001247. [DOI] [PMC free article] [PubMed] [Google Scholar]
- Chan CT, Pang YL, Deng W, Babu IR, Dyavaiah M, Begley TJ, Dedon PC. Reprogramming of tRNA modifications controls the oxidative stress response by codon-biased translation of proteins. Nat Commun. 2012;3:937. doi: 10.1038/ncomms1938. [DOI] [PMC free article] [PubMed] [Google Scholar]
- Chan TYC, Deng W, Li F, DeMott MS, Babu IR, Begley TJ, Dedon PC. Highly predictive reprogramming of tRNA modifications is linked to selective expression of codon-biased genes. Chem Res Toxicol. 2015 doi: 10.1021/acs.chemrestox.5b00004. in press. [DOI] [PMC free article] [PubMed] [Google Scholar]
- Chen YG, Kowtoniuk WE, Agarwal I, Shen Y, Liu DR. LC/MS analysis of cellular RNA reveals NAD-linked RNA. Nat Chem Biol. 2009;5(12):879–881. doi: 10.1038/nchembio.235. [DOI] [PMC free article] [PubMed] [Google Scholar]
- Chionh YH, Ho CH, Pruksakorn D, Babu RI, Ng CS, Hia F, et al. Dedon PC. A multidimensional platform for the purification of non-coding RNA species. Nucleic Acids Res. 2013;41(17):e168. doi: 10.1093/nar/gkt668. [DOI] [PMC free article] [PubMed] [Google Scholar]
- Crain PF. Preparation and enzymatic hydrolysis of DNA and RNA for mass spectrometry. Methods Enzymol. 1990;193:782–790. doi: 10.1016/0076-6879(90)93450-y. [DOI] [PubMed] [Google Scholar]
- Crain PF, Rozenski J, McCloskey JA. The RNA modification database. 1999 doi: 10.1093/nar/27.1.196. from http://library.med.utah.edu/RNAmods/ [DOI] [PMC free article] [PubMed]
- Cunningham L, Kittikamron K, Lu Y. Preparative-scale purification of RNA using an efficient method which combines gel electrophoresis and column chromatography. Nucleic Acids Res. 1996;24(18):3647–3648. doi: 10.1093/nar/24.18.3647. [DOI] [PMC free article] [PubMed] [Google Scholar]
- Czerwoniec A, Dunin-Horkawicz S, Purta E, Kaminska KH, Kasprzak JM, Bujnicki JM, et al. Rother K. MODOMICS: a database of RNA modification pathways. 2008 update. Nucleic Acids Res. 2009;37(Database issue):D118–121. doi: 10.1093/nar/gkn710. [DOI] [PMC free article] [PubMed] [Google Scholar]
- Dalluge JJ, Hashizume T, Sopchik AE, McCloskey JA, Davis DR. Conformational flexibility in RNA: the role of dihydrouridine. Nucleic Acids Res. 1996;24(6):1073–1079. doi: 10.1093/nar/24.6.1073. [DOI] [PMC free article] [PubMed] [Google Scholar]
- Davis DR. Stabilization of RNA stacking by pseudouridine. Nucleic Acids Res. 1995;23(24):5020–5026. doi: 10.1093/nar/23.24.5020. [DOI] [PMC free article] [PubMed] [Google Scholar]
- Dedon PC, Begley TJ. A system of RNA modifications and biased codon use controls cellular stress response at the level of translation. Chem Res Toxicol. 2014;27(3):330–337. doi: 10.1021/tx400438d. [DOI] [PMC free article] [PubMed] [Google Scholar]
- Dong M, Wang C, Deen WM, Dedon PC. Absence of 2′-deoxyoxanosine and presence of abasic sites in DNA exposed to nitric oxide at controlled physiological concentrations. Chem Res Toxicol. 2003;16(9):1044–1055. doi: 10.1021/tx034046s. [DOI] [PubMed] [Google Scholar]
- Dudley Edward, Tuytten Robin, Bond Alison, Lemière Filip, Brenton AGareth, Esmans EddyL, Newton RussellP. Study of the mass spectrometric fragmentation of pseudouridine: comparison of fragmentation data obtained by matrix - assistedlaser desorption/ionisation post - source decay, electrospray ion trap multistage mass spectrometry, and by a method utilising electrospray quadrupole time - of - flight tandem mass spectrometry and in - source fragmentation. Rapid communications in mass spectrometry. 2005;19(21):3075–3085. doi: 10.1002/rcm.2151. [DOI] [PubMed] [Google Scholar]
- Dumelin CE, Chen Y, Leconte AM, Chen YG, Liu DR. Discovery and biological characterization of geranylated RNA in bacteria. Nat Chem Biol. 2012;8(11):913–919. doi: 10.1038/nchembio.1070. [DOI] [PMC free article] [PubMed] [Google Scholar]
- Easton LE, Shibata Y, Lukavsky PJ. Rapid, nondenaturing RNA purification using weak anion-exchange fast performance liquid chromatography. RNA. 2010;16(3):647–653. doi: 10.1261/rna.1862210. [DOI] [PMC free article] [PubMed] [Google Scholar]
- Emilsson V, Naslund AK, Kurland CG. Thiolation of transfer RNA in Escherichia coli varies with growth rate. Nucleic Acids Res. 1992;20(17):4499–4505. doi: 10.1093/nar/20.17.4499. [DOI] [PMC free article] [PubMed] [Google Scholar]
- Farand J, Gosselin F. De novo sequence determination of modified oligonucleotides. Anal Chem. 2009;81(10):3723–3730. doi: 10.1021/ac802452p. [DOI] [PubMed] [Google Scholar]
- Fu Y, Jia G, Pang X, Wang RN, Wang X, Li CJ, et al. He C. FTO-mediated formation of N6-hydroxymethyladenosine and N6-formyladenosine in mammalian RNA. Nat Commun. 2013;4:1798. doi: 10.1038/ncomms2822. [DOI] [PMC free article] [PubMed] [Google Scholar]
- Fujii S, Inagaki K, Miyashita S, Groombridge AS, Nagasawa K, Chiba K, Takatsu A. Separation and quantification of RNA molecules using size-exclusion chromatography hyphenated with inductively coupled plasma-mass spectrometry. Electrophoresis. 2014;35(9):1315–1318. doi: 10.1002/elps.201300477. [DOI] [PubMed] [Google Scholar]
- Gehrke CW, Kuo KC. Ribonucleoside analysis by reversed-phase high-performance liquid chromatography. J Chromatogr. 1989;471:3–36. doi: 10.1016/s0021-9673(00)94152-9. [DOI] [PubMed] [Google Scholar]
- Gehrke CW, Kuo KC, McCune RA, Gerhardt KO, Agris PF. Quantitative enzymatic hydrolysis of tRNAs: reversed-phase high-performance liquid chromatography of tRNA nucleosides. J Chromatogr. 1982;230(2):297–308. [PubMed] [Google Scholar]
- Gehrke CW, Kuo KC, Zumwalt RW. Chromatography of nucleosides. J Chromatogr. 1980;188(1):129–147. doi: 10.1016/s0021-9673(00)88424-1. [DOI] [PubMed] [Google Scholar]
- Giessing AM, Jensen SS, Rasmussen A, Hansen LH, Gondela A, Long K, et al. Kirpekar F. Identification of 8-methyladenosine as the modification catalyzed by the radical SAM methyltransferase Cfr that confers antibiotic resistance in bacteria. RNA. 2009;15(2):327–336. doi: 10.1261/rna.1371409. [DOI] [PMC free article] [PubMed] [Google Scholar]
- Grosjean H, Droogmans L, Roovers M, Keith G. Detection of enzymatic activity of transfer RNA modification enzymes using radiolabeled tRNA substrates. Methods Enzymol. 2007;425:55–101. doi: 10.1016/S0076-6879(07)25003-7. [DOI] [PubMed] [Google Scholar]
- Gu C, Begley TJ, Dedon PC. tRNA modifications regulate translation during cellular stress. FEBS Lett. 2014;588(23):4287–4296. doi: 10.1016/j.febslet.2014.09.038. [DOI] [PMC free article] [PubMed] [Google Scholar]
- Guo Y, Gaiki S. Retention behavior of small polar compounds on polar stationary phases in hydrophilic interaction chromatography. J Chromatogr A. 2005;1074(1-2):71–80. doi: 10.1016/j.chroma.2005.03.058. [DOI] [PubMed] [Google Scholar]
- Havelund JF, Giessing AM, Hansen T, Rasmussen A, Scott LG, Kirpekar F. Identification of 5-hydroxycytidine at position 2501 concludes characterization of modified nucleotides in E. coli 23S rRNA. J Mol Biol. 2011;411(3):529–536. doi: 10.1016/j.jmb.2011.06.036. [DOI] [PubMed] [Google Scholar]
- He C. Grand challenge commentary: RNA epigenetics? Nat Chem Biol. 2010;6(12):863–865. doi: 10.1038/nchembio.482. [DOI] [PubMed] [Google Scholar]
- Hia F, Chionh YH, Pang YL, DeMott MS, McBee ME, Dedon PC. Mycobacterial RNA isolation optimized for non-coding RNA: high fidelity isolation of 5S rRNA from Mycobacterium bovis BCG reveals novel post-transcriptional processing and a complete spectrum of modified ribonucleosides. Nucleic Acids Res. 2014 Dec 24; doi: 10.1093/nar/gku1317. pii: gku1317. [DOI] [PMC free article] [PubMed] [Google Scholar]
- Hienzsch A, Deiml C, Reiter V, Carell T. Total synthesis of the hypermodified RNA bases wybutosine and hydroxywybutosine and their quantification together with other modified RNA bases in plant materials. Chemistry. 2013;19(13):4244–4248. doi: 10.1002/chem.201204209. [DOI] [PubMed] [Google Scholar]
- Hill AlastairW, Mortishire-Smith RussellJ. Automated assignment of high-resolution collisionally activated dissociation mass spectra using a systematic bond disconnection approach. Rapid communications in mass spectrometry. 2005;19(21):3111–3118. [Google Scholar]
- Hossain M, Limbach PA. Mass spectrometry-based detection of transfer RNAs by their signature endonuclease digestion products. RNA. 2007;13(2):295–303. doi: 10.1261/rna.272507. [DOI] [PMC free article] [PubMed] [Google Scholar]
- Huang B, Lu J, Bystrom AS. A genome-wide screen identifies genes required for formation of the wobble nucleoside 5-methoxycarbonylmethyl-2-thiouridine in Saccharomyces cerevisiae. RNA. 2008;14(10):2183–2194. doi: 10.1261/rna.1184108. [DOI] [PMC free article] [PubMed] [Google Scholar]
- Katsivela E, Hofle MG. Separation of transfer RNA and 5S ribosomal RNA using capillary electrophoresis. J Chromatogr A. 1995;700(1-2):125–136. doi: 10.1016/0021-9673(94)01091-r. [DOI] [PubMed] [Google Scholar]
- Kellner S, Burhenne J, Helm M. Detection of RNA modifications. RNA Biol. 2010;7(2):237–247. doi: 10.4161/rna.7.2.11468. [DOI] [PubMed] [Google Scholar]
- Kellner S, Neumann J, Rosenkranz D, Lebedeva S, Ketting RF, Zischler H, et al. Helm M. Profiling of RNA modifications by multiplexed stable isotope labelling. Chem Commun (Camb) 2014;50(26):3516–3518. doi: 10.1039/c3cc49114e. [DOI] [PubMed] [Google Scholar]
- Kellner S, Ochel A, Thuring K, Spenkuch F, Neumann J, Sharma S, et al. Helm M. Absolute and relative quantification of RNA modifications via biosynthetic isotopomers. Nucleic Acids Res. 2014;42(18):e142. doi: 10.1093/nar/gku733. [DOI] [PMC free article] [PubMed] [Google Scholar]
- Kieft JS, Batey RT. A general method for rapid and nondenaturing purification of RNAs. RNA. 2004;10(6):988–995. doi: 10.1261/rna.7040604. [DOI] [PMC free article] [PubMed] [Google Scholar]
- Kim I, McKenna SA, Viani Puglisi E, Puglisi JD. Rapid purification of RNAs using fast performance liquid chromatography (FPLC) RNA. 2007;13(2):289–294. doi: 10.1261/rna.342607. [DOI] [PMC free article] [PubMed] [Google Scholar]
- Kim YK, Yeo J, Kim B, Ha M, Kim VN. Short Structured RNAs with Low GC Content Are Selectively Lost during Extraction from a Small Number of Cells. Mol Cell. 2012;46(6):893–895. doi: 10.1016/j.molcel.2012.05.036. [DOI] [PubMed] [Google Scholar]
- Kind T, Fiehn O. Metabolomic database annotations via query of elemental compositions: mass accuracy is insufficient even at less than 1 ppm. BMC Bioinformatics. 2006;7:234. doi: 10.1186/1471-2105-7-234. [DOI] [PMC free article] [PubMed] [Google Scholar]
- Kinger AK, Verma A, Tyagi JS. A method for the isolation of pure intact RNA from mycobacteria. Biotechniques. 1993;14(5):724–725. [PubMed] [Google Scholar]
- Kirino Y, Mourelatos Z. Mouse Piwi-interacting RNAs are 2′-O-methylated at their 3′ termini. Nat Struct Mol Biol. 2007;14(4):347–348. doi: 10.1038/nsmb1218. [DOI] [PubMed] [Google Scholar]
- Klootwijk J, Planta RJ. Analysis of the methylation sites in yeast ribosomal RNA. Eur J Biochem. 1973;39(2):325–333. doi: 10.1111/j.1432-1033.1973.tb03130.x. [DOI] [PubMed] [Google Scholar]
- Köhrer C, Rajbhandary UL. The many applications of acid urea polyacrylamide gel electrophoresis to studies of tRNAs and aminoacyl-tRNA synthetases. Methods. 2008;44(2):129–138. doi: 10.1016/j.ymeth.2007.10.006. [DOI] [PMC free article] [PubMed] [Google Scholar]
- Koubek J, Lin KF, Chen YR, Cheng RP, Huang JJ. Strong anion-exchange fast performance liquid chromatography as a versatile tool for preparation and purification of RNA produced by in vitro transcription. RNA. 2013;19(10):1449–1459. doi: 10.1261/rna.038117.113. rna.038117.113 [pii] [DOI] [PMC free article] [PubMed] [Google Scholar]
- Kowtoniuk WE, Shen Y, Heemstra JM, Agarwal I, Liu DR. A chemical screen for biological small molecule-RNA conjugates reveals CoA-linked RNA. Proc Natl Acad Sci U S A. 2009;106(19):7768–7773. doi: 10.1073/pnas.0900528106. [DOI] [PMC free article] [PubMed] [Google Scholar]
- Kruger MK, Pedersen S, Hagervall TG, Sorensen MA. The modification of the wobble base of tRNAGlu modulates the translation rate of glutamic acid codons in vivo. J Mol Biol. 1998;284(3):621–631. doi: 10.1006/jmbi.1998.2196. [DOI] [PubMed] [Google Scholar]
- Kuschel Meike, Ausserer Walter. Use of lab-on-a-chip technology for protein sizing and quantitation. J Biomol Tech. 2002;13(3):172–8. [PMC free article] [PubMed] [Google Scholar]
- Lewicki PP, Sinskey AJ. Precision of RNA separation by polyacrylamide gel electrophoresis. Anal Biochem. 1970;33(2):273–278. doi: 10.1016/0003-2697(70)90297-6. [DOI] [PubMed] [Google Scholar]
- Li Z, Dou X, Ni Y, Chen Q, Cheng S, Yamaguchi Y. Is pulsed electric field still effective for RNA separation in capillary electrophoresis? J Chromatogr A. 2012;1229:274–279. doi: 10.1016/j.chroma.2012.01.056. [DOI] [PubMed] [Google Scholar]
- Li Z, Dou X, Ni Y, Sumitomo K, Yamaguchi Y. Acetic acid denaturing pulsed field capillary electrophoresis for RNA separation. Electrophoresis. 2010;31(21):3531–3536. doi: 10.1002/elps.201000175. [DOI] [PubMed] [Google Scholar]
- Lim HK, Chen J, Sensenhauser C, Cook K, Subrahmanyam V. Metabolite identification by data-dependent accurate mass spectrometric analysis at resolving power of 60,000 in external calibration mode using an LTQ/Orbitrap. Rapid Commun Mass Spectrom. 2007;21(12):1821–1832. doi: 10.1002/rcm.3024. [DOI] [PubMed] [Google Scholar]
- Little JL, Cleven CD, Brown SD. Identification of “known unknowns” utilizing accurate mass data and chemical abstracts service databases. J Am Soc Mass Spectrom. 2011;22(2):348–359. doi: 10.1007/s13361-010-0034-3. [DOI] [PubMed] [Google Scholar]
- Little JL, Williams AJ, Pshenichnov A, Tkachenko V. Identification of "known unknowns" utilizing accurate mass data and ChemSpider. J Am Soc Mass Spectrom. 2012;23(1):179–185. doi: 10.1007/s13361-011-0265-y. [DOI] [PubMed] [Google Scholar]
- Luo Y, Eldho NV, Sintim HO, Dayie TK. RNAs synthesized using photocleavable biotinylated nucleotides have dramatically improved catalytic efficiency. Nucleic Acids Res. 2011;39(19):8559–8571. doi: 10.1093/nar/gkr464. [DOI] [PMC free article] [PubMed] [Google Scholar]
- Machnicka MA, Milanowska K, Osman Oglou O, Purta E, Kurkowska M, Olchowik A, et al. Grosjean H. MODOMICS: a database of RNA modification pathways--2013 update. Nucleic Acids Res. 2013;41(Database issue):D262–267. doi: 10.1093/nar/gks1007. [DOI] [PMC free article] [PubMed] [Google Scholar]
- Mandal D, Kohrer C, Su D, Babu IR, Chan CT, Liu Y, et al. Rajbhandary UL. Identification and codon reading properties of 5-cyanomethyl uridine, a new modified nucleoside found in the anticodon wobble position of mutant haloarchaeal isoleucine tRNAs. RNA. 2014;20(2):177–188. doi: 10.1261/rna.042358.113. [DOI] [PMC free article] [PubMed] [Google Scholar]
- Mandal D, Kohrer C, Su D, Russell SP, Krivos K, Castleberry CM, et al. RajBhandary UL. Agmatidine, a modified cytidine in the anticodon of archaeal tRNA(Ile), base pairs with adenosine but not with guanosine. Proc Natl Acad Sci U S A. 2010;107(7):2872–2877. doi: 10.1073/pnas.0914869107. [DOI] [PMC free article] [PubMed] [Google Scholar]
- McCarthy SM, Gilar M, Gebler J. Reversed-phase ion-pair liquid chromatography analysis and purification of small interfering RNA. Anal Biochem. 2009;390(2):181–188. doi: 10.1016/j.ab.2009.03.042. [DOI] [PubMed] [Google Scholar]
- McLafferty Fred W. Interpretation of mass spectra. University Science Books; 1993. [Google Scholar]
- Miyauchi K, Kimura S, Suzuki T. A cyclic form of N6-threonylcarbamoyladenosine as a widely distributed tRNA hypermodification. Nat Chem Biol. 2013;9(2):105–111. doi: 10.1038/nchembio.1137. [DOI] [PubMed] [Google Scholar]
- Motorin Y, Helm M. tRNA stabilization by modified nucleotides. Biochemistry. 2010;49(24):4934–4944. doi: 10.1021/bi100408z. [DOI] [PubMed] [Google Scholar]
- Murphy FVth, Ramakrishnan V, Malkiewicz A, Agris PF. The role of modifications in codon discrimination by tRNA(Lys)UUU. Nat Struct Mol Biol. 2004;11(12):1186–1191. doi: 10.1038/nsmb861. [DOI] [PubMed] [Google Scholar]
- Nameki N. Identity elements of tRNA(Thr) towards Saccharomyces cerevisiae threonyl-tRNA synthetase. Nucleic Acids Res. 1995;23(15):2831–2836. doi: 10.1093/nar/23.15.2831. [DOI] [PMC free article] [PubMed] [Google Scholar]
- Nameki N, Asahara H, Shimizu M, Okada N, Himeno H. Identity elements of Saccharomyces cerevisiae tRNA(His) Nucleic Acids Res. 1995;23(3):389–394. doi: 10.1093/nar/23.3.389. [DOI] [PMC free article] [PubMed] [Google Scholar]
- Ohara T, Sakaguchi Y, Suzuki T, Ueda H, Miyauchi K, Suzuki T. The 3′ termini of mouse Piwi-interacting RNAs are 2′-O-methylated. Nat Struct Mol Biol. 2007;14(4):349–350. doi: 10.1038/nsmb1220. [DOI] [PubMed] [Google Scholar]
- Patil A, Chan CT, Dyavaiah M, Rooney JP, Dedon PC, Begley TJ. Translational infidelity-induced protein stress results from a deficiency in Trm9-catalyzed tRNA modifications. RNA Biol. 2012;9(7):990–1001. doi: 10.4161/rna.20531. [DOI] [PMC free article] [PubMed] [Google Scholar]
- Perry RP, La Torre J, Kelley DE, Greenberg JR. On the lability of poly(A) sequences during extraction of messenger RNA from polyribosomes. Biochim Biophys Acta. 1972;262(2):220–226. doi: 10.1016/0005-2787(72)90236-5. [DOI] [PubMed] [Google Scholar]
- Pomerantz SC, McCloskey JA. Analysis of RNA hydrolyzates by liquid chromatography-mass spectrometry. Methods Enzymol. 1990;193:796–824. doi: 10.1016/0076-6879(90)93452-q. [DOI] [PubMed] [Google Scholar]
- Putz J, Florentz C, Benseler F, Giege R. A single methyl group prevents the mischarging of a tRNA. Nat Struct Biol. 1994;1(9):580–582. doi: 10.1038/nsb0994-580. [DOI] [PubMed] [Google Scholar]
- Rederstorff M, Hüttenhofer A. Small non-coding RNAs in disease development and host-pathogen interactions. Curr Opin Mol Ther. 2010;12(6):684–694. [PubMed] [Google Scholar]
- Reynolds WF, Enriquez RG. Choosing the best pulse sequences, acquisition parameters, postacquisition processing strategies, and probes for natural product structure elucidation by NMR spectroscopy. J Nat Prod. 2002;65(2):221–244. doi: 10.1021/np010444o. [DOI] [PubMed] [Google Scholar]
- Rezgui VA, Tyagi K, Ranjan N, Konevega AL, Mittelstaet J, Rodnina MV, et al. Pedrioli PG. tRNA tKUUU, tQUUG, and tEUUC wobble position modifications fine-tune protein translation by promoting ribosome A-site binding. Proc Natl Acad Sci U S A. 2013;110(30):12289–12294. doi: 10.1073/pnas.1300781110. [DOI] [PMC free article] [PubMed] [Google Scholar]
- Rudinger J, Florentz C, Giege R. Histidylation by yeast HisRS of tRNA or tRNA-like structure relies on residues -1 and 73 but is dependent on the RNA context. Nucleic Acids Res. 1994;22(23):5031–5037. doi: 10.1093/nar/22.23.5031. [DOI] [PMC free article] [PubMed] [Google Scholar]
- Russell SP, Limbach PA. Evaluating the reproducibility of quantifying modified nucleosides from ribonucleic acids by LC-UV-MS. J Chromatogr B Analyt Technol Biomed Life Sci. 2013;923-924:74–82. doi: 10.1016/j.jchromb.2013.02.010. [DOI] [PMC free article] [PubMed] [Google Scholar]
- Salazar JC, Ambrogelly A, Crain PF, McCloskey JA, Söll D. A truncated aminoacyl-tRNA synthetase modifies RNA. Proc Natl Acad Sci U S A. 2004;101(20):7536–7541. doi: 10.1073/pnas.0401982101. [DOI] [PMC free article] [PubMed] [Google Scholar]
- Schroeder A, Mueller O, Stocker S, Salowsky R, Leiber M, Gassmann M, et al. Ragg T. The RIN: an RNA integrity number for assigning integrity values to RNA measurements. BMC Mol Biol. 2006;7:3. doi: 10.1186/1471-2199-7-3. [DOI] [PMC free article] [PubMed] [Google Scholar]
- Shanagar J. Purification of a synthetic oligonucleotide by anion exchange chromatography: method optimisation and scale-up. J Biochem Biophys Methods. 2005;64(3):216–225. doi: 10.1016/j.jbbm.2005.08.004. [DOI] [PubMed] [Google Scholar]
- Skeidsvoll J, Ueland PM. Analysis of RNA by capillary electrophoresis. Electrophoresis. 1996;17(9):1512–1517. doi: 10.1002/elps.1150170917. [DOI] [PubMed] [Google Scholar]
- Sparkman DO. Mass Spectrometry Desk Reference. Second Edition. Vol. 18. Pittsburgh, PA 015238: Global View Publishing; 2007. [Google Scholar]
- Spenkuch F, Hinze G, Kellner S, Kreutz C, Micura R, Basche T, Helm M. Dye label interference with RNA modification reveals 5-fluorouridine as non-covalent inhibitor. Nucleic Acids Res. 2014;42(20):12735–12745. doi: 10.1093/nar/gku908. [DOI] [PMC free article] [PubMed] [Google Scholar]
- Srisawat C, Engelke DR. Streptavidin aptamers: affinity tags for the study of RNAs and ribonucleoproteins. RNA. 2001;7(4):632–641. doi: 10.1017/s135583820100245x. [DOI] [PMC free article] [PubMed] [Google Scholar]
- Srisawat C, Goldstein IJ, Engelke DR. Sephadex-binding RNA ligands: rapid affinity purification of RNA from complex RNA mixtures. Nucleic Acids Res. 2001;29(2):E4. doi: 10.1093/nar/29.2.e4. [DOI] [PMC free article] [PubMed] [Google Scholar]
- Su D, Chan CT, Gu C, Lim KS, Chionh YH, McBee ME, et al. Dedon PC. Quantitative analysis of ribonucleoside modifications in tRNA by HPLC-coupled mass spectrometry. Nat Protoc. 2014;9(4):828–841. doi: 10.1038/nprot.2014.047. [DOI] [PMC free article] [PubMed] [Google Scholar]
- Suzuki T, Ikeuchi Y, Noma A, Sakaguchi Y. Mass spectrometric identification and characterization of RNA-modifying enzymes. Methods Enzymol. 2007;425:211–229. doi: 10.1016/S0076-6879(07)25009-8. [DOI] [PubMed] [Google Scholar]
- Suzuki T, Suzuki T. Chaplet column chromatography: isolation of a large set of individual RNAs in a single step. Methods Enzymol. 2007;425:231–239. doi: 10.1016/S0076-6879(07)25010-4. [DOI] [PubMed] [Google Scholar]
- Taniguchi T, Miyauchi K, Nakane D, Miyata M, Muto A, Nishimura S, Suzuki T. Decoding system for the AUA codon by tRNAIle with the UAU anticodon in Mycoplasma mobile. Nucleic Acids Res. 2013;41(4):2621–2631. doi: 10.1093/nar/gks1344. [DOI] [PMC free article] [PubMed] [Google Scholar]
- Tissot Catherine. Agilent Technologies; Palo Alto, Calif, USA: 2008. Analysis of miRNA content in total RNA preparations using the Agilent 2100 bioanalyzer. http://www.chem.agilent.com/Library/applications/5989-7870EN.pdf. [Google Scholar]
- Tumu S, Patil A, Towns W, Dyavaiah M, Begley TJ. The gene-specific codon counting database: a genome-based catalog of one-, two-, three-, four- and five-codon combinations present in Saccharomyces cerevisiae genes. Database (Oxford) 2012;2012:bas002. doi: 10.1093/database/bas002. [DOI] [PMC free article] [PubMed] [Google Scholar]
- Tuytten R, Lemiere F, Van Dongen W, Witters E, Esmans EL, Newton RP, Dudley E. Development of an on-line SPE-LC-ESI-MS method for urinary nucleosides: hyphenation of aprotic boronic acid chromatography with hydrophilic interaction LC-ESI-MS. Anal Chem. 2008;80(4):1263–1271. doi: 10.1021/ac702057u. [DOI] [PubMed] [Google Scholar]
- Urbonavicius J, Qian Q, Durand JM, Hagervall TG, Bjork GR. Improvement of reading frame maintenance is a common function for several tRNA modifications. Embo J. 2001;20(17):4863–4873. doi: 10.1093/emboj/20.17.4863. [DOI] [PMC free article] [PubMed] [Google Scholar]
- Varricchio F, Ernst HJ. Separation of low molecular weight RNA by polyacrylamide gel electrophoresis. Anal Biochem. 1975;68(2):485–492. doi: 10.1016/0003-2697(75)90643-0. [DOI] [PubMed] [Google Scholar]
- Waghmare SP, Pousinis P, Hornby DP, Dickman MJ. Studying the mechanism of RNA separations using RNA chromatography and its application in the analysis of ribosomal RNA and RNA:RNA interactions. J Chromatogr A. 2009;1216(9):1377–1382. doi: 10.1016/j.chroma.2008.12.077. [DOI] [PubMed] [Google Scholar]
- Walker SC, Scott FH, Srisawat C, Engelke DR. RNA affinity tags for the rapid purification and investigation of RNAs and RNA-protein complexes. Methods Mol Biol. 2008;488:23–40. doi: 10.1007/978-1-60327-475-3_3. [DOI] [PMC free article] [PubMed] [Google Scholar]
- Wang X, He C. Dynamic RNA modifications in posttranscriptional regulation. Mol Cell. 2014;56(1):5–12. doi: 10.1016/j.molcel.2014.09.001. [DOI] [PMC free article] [PubMed] [Google Scholar]
- Ward AM, Gunaratne J, Garcia-Blanco MA. Identification of dengue RNA binding proteins using RNA chromatography and quantitative mass spectrometry. Methods Mol Biol. 2014;1138:253–270. doi: 10.1007/978-1-4939-0348-1_16. [DOI] [PubMed] [Google Scholar]
- Warren WJ, Vella G. Principles and methods for the analysis and purification of synthetic deoxyribonucleotides by high-performance liquid chromatography. Mol Biotechnol. 1995;4(2):179–199. doi: 10.1007/BF02921611. [DOI] [PubMed] [Google Scholar]
- Werner A. Reversed-phase and ion-pair separations of nucleotides, nucleosides and nucleobases: analysis of biological samples in health and disease. J Chromatogr. 1993;618(1-2):3–14. doi: 10.1016/0378-4347(93)80024-x. [DOI] [PubMed] [Google Scholar]
- Yarian C, Townsend H, Czestkowski W, Sochacka E, Malkiewicz AJ, Guenther R, et al. Agris PF. Accurate translation of the genetic code depends on tRNA modified nucleosides. J Biol Chem. 2002;277(19):16391–16395. doi: 10.1074/jbc.M200253200. [DOI] [PubMed] [Google Scholar]
- Zhang Q, Pu R, Du Y, Han Y, Su T, Wang H, Cao G. Non-coding RNAs in hepatitis B or C-associated hepatocellular carcinoma: potential diagnostic and prognostic markers and therapeutic targets. Cancer Lett. 2012;321(1):1–12. doi: 10.1016/j.canlet.2012.03.011. [DOI] [PubMed] [Google Scholar]
- Zhao HQ, Wang X, Li HM, Yang B, Yang HJ, Huang L. Characterization of nucleosides and nucleobases in natural Cordyceps by HILIC-ESI/TOF/MS and HILIC-ESI/MS. Molecules. 2013;18(8):9755–9769. doi: 10.3390/molecules18089755. [DOI] [PMC free article] [PubMed] [Google Scholar]
- Zheng G, Dahl JA, Niu Y, Fu Y, Klungland A, Yang YG, He C. Sprouts of RNA epigenetics: the discovery of mammalian RNA demethylases. RNA Biol. 2013;10(6):915–918. doi: 10.4161/rna.24711. [DOI] [PMC free article] [PubMed] [Google Scholar]
- Zhou G, Pang H, Tang Y, Yao X, Ding Y, Zhu S, et al. Duan JA. Hydrophilic interaction ultra-performance liquid chromatography coupled with triple-quadrupole tandem mass spectrometry (HILIC-UPLC-TQ-MS/MS) in multiple-reaction monitoring (MRM) for the determination of nucleobases and nucleosides in ginkgo seeds. Food Chem. 2014;150:260–266. doi: 10.1016/j.foodchem.2013.10.143. [DOI] [PubMed] [Google Scholar]