

Summary
Neuroblastoma is a pediatric malignancy that typically arises in early childhood and is derived from the developing sympathetic nervous system. Clinical phenotypes range from localized tumors with excellent outcomes to widely metastatic disease where long-term survival is approximately 40% despite intensive therapy1. A previous genome-wide association study (GWAS) identified common polymorphisms at the LMO1 gene locus that are highly associated with neuroblastoma susceptibility and oncogenic addiction to LMO1 in the tumor cells2. Here we sought to discover the causal DNA variant at this locus and the mechanism by which it leads to neuroblastoma tumorigenesis. We first imputed all possible genotypes across the LMO1 locus and then mapped highly associated single nucleotide polymorphism (SNPs) to areas of chromatin accessibility, evolutionary conservation, and transcription factor binding sites. SNP rs2168101 G>T was the most highly associated variant (combined P=7.47×10⁻²⁹, Odds Ratio 0.65, 95% CI: 0.60-0.70) and resided in a super-enhancer defined by extensive acetylation of histone H3 lysine 27 within the first intron of LMO1. The ancestral G-allele that is associated with tumor formation resides in a conserved GATA transcription factor binding motif. We show that the newly evolved protective TATA allele is associated with decreased total LMO1 expression (P=0.028) in neuroblastoma primary tumors and ablates GATA3 binding (P<0.0001). We demonstrate allelic imbalance favoring the G-containing strand in tumors heterozygous for this SNP as demonstrated both by RNA sequencing (P<0.0001) and reporter assays (P=0.002). These findings show that a recently evolved polymorphism within a super-enhancer element in the first intron of LMO1 influences neuroblastoma susceptibility through differential GATA transcription factor binding and direct modulation of LMO1 expression in cis, and this leads to an oncogenic dependency in tumor cells.
GWAS efforts frequently identify highly statistically significant genetic associations within non-coding regulatory regions of the genome3, but the underlying causal DNA sequence variations have only been identified in a few instances4-6. A neuroblastoma GWAS has identified multiple disease susceptibility loci2,7-13, with the signal within the LIM domain only 1 (LMO1) locus at 11p152, a transcriptional co-regulator containing two zinc finger LIM domains that nucleate and regulate transcription factor complexes14, being most robust. The main members of the LMO gene family, LMO1-4, are all implicated in cancer including LMO1 and LMO2 translocations in T-cell leukemia15,16, and we previously provided the first evidence that LMO1 was a bona fide neuroblastoma oncogene2. Here, we sought to identify the causal polymorphism(s) driving the LMO1 genetic association with neuroblastoma susceptibility as a basis for understanding neuroblastoma initiation and addiction mechanisms.
We first performed fine mapping of associated germline SNPs and indels at the LMO1 gene locus by imputation to the 1000 Genomes Project for our European-American neuroblastoma GWAS11. This identified 27 SNPs with minor allele frequency (MAF) >0.01 and an association P<1×10⁻⁵ (Figure 1A, Extended Data Table 1). We further prioritized associated variants by evolutionary conservation, and by their regulatory potential inferred through neuroblastoma-specific DNase I hypersensitivity mapping and chromatin immunoprecipitation sequencing (ChIP-Seq) from the ENCODE Consortium (Figure 1B). These data showed that the most significantly associated SNP at the LMO1 locus (rs2168101, OR=0.67, P=4.14×10⁻¹⁶) resides within a highly conserved and active enhancer region inferred by DNase I sensitivity and p300 binding in the SKNSH neuroblastoma cell line (Figure 1B). Importantly, we found no rare or common non-synonymous coding variants in LMO1 in a combined cohort of 482 unique neuroblastoma cases with germline whole-genome (N=136), whole-exome (N=222), and/or targeted DNA sequencing (N=183) (see Extended Data Table 2 and Supplemental Data).
Figure 1. Imputation-based GWAS and epigenomic profiling by ENCODE identifies rs2168101 as a candidate functional SNP at LMO1.
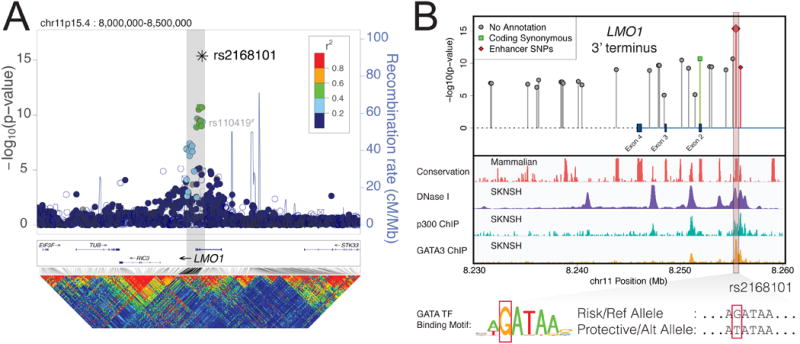
(A) Manhattan plot for neuroblastoma GWAS. The neuroblastoma-associated region falls within a 40kb haplotype block (gray box) in Europeans, encompassing the LMO1 3′-terminus. rs2168101 is the most associated variant and is moderately correlated (maximum r2=0.52) with other variants. The sentinel SNP reported previously, rs110419, is also highlighted#. (B) Associated variants (P<1×10⁻⁵) are plotted with ENCODE tracks for neuroblastoma cell line SKNSH. Two SNPs, rs2168101 and rs7948497, were annotated as “enhancer SNPs” based on overlapping DNase peaks binding p300. The rs2168101 G>T SNP disrupts the G-site of an evolutionarily conserved GATA transcription factor motif (5′-A[G/T]ATAA-3′). SKNSH has a rs2168101=G/G genotype that preserves GATA binding, supported by ENCODE GATA3 ChIP-seq.
Because rs2168101 genotypes were imputed in our analyses (Extended Data Figure 1), we next directly genotyped this SNP in 146 of 2101 European-American cases, and measured an 86% imputation accuracy (Supplemental Table 1). We additionally directly genotyped rs2168101 in two independent cohorts from the United Kingdom and Italy, with both showing robust replication (Table 1). We did not observe replication in an independent African-American cohort17. Notably, the protective T-allele is common in Europeans (CEU HapMap: 28%) and East Asians (CHB+JPT HapMap: 32%), but is rare or absent in Africans, indicating recent expansion of the rs2168101 protective allele in non-African human populations. Meta-analysis demonstrated a combined association P=7.47×10⁻²⁹ across 8553 controls and 3254 cases (Table 1).
Table 1. Replication and meta-analysis of rs2168101 association.
| SNP | Ref/Alt (Major/Minor) Allele | Cohort | MAF Cases | MAF Controls | Additive P-value | Additive Odds Ratio | Het Odds Ratio (GT vs. GG) | Hom Odds Ratio (TT vs. GG) |
|---|---|---|---|---|---|---|---|---|
| rs2168101 | G/T | European American* | 0.242 (n=2101) | 0.313 (n=4202) | 4.14E-16 | 0.67 (0.61-0.74) | 0.69 (0.62-0.77) | 0.52 (0.42-0.64) |
| Italian | 0.164 (n=420) | 0.250 (n=751) | 2.07E-06 | 0.61 (0.50-0.75) | 0.57 (0.44-0.74) | 0.40 (0.21-0.75) | ||
| United Kingdom | 0.190 (n=369) | 0.311 (n=1109) | 5.86E-10 | 0.56 (0.47-0.68) | 0.51 (0.39-0.66) | 0.31 (0.18-0.53) | ||
| African American* | 0.0865 (n=364) | 0.0891 (n=2491) | 0.20 | 0.79 (0.56-1.13) | 0.96 (0.71-1.30) | 1.07 (0.38-3.04) | ||
| Combined | 7.47E-29 | 0.65 (0.60-0.70) | 0.67 (0.61-0.73) | 0.49 (0.41-0.59) |
= imputed genotypes and correction for population stratification
As causal SNPs driving GWAS associations may disrupt transcription factor binding at distal enhancers6,18,19, we sought to identify candidate SNPs disrupting known JASPAR motifs20, which revealed that lead candidate SNP rs2168101 resides in a highly conserved GATA-binding motif (5′-A[G/T]ATAA-3′, mammalian phastCons score=100%) (Figure 1B). ENCODE transcription factor ChIP-Seq confirmed GATA2 and GATA3 binding at the rs2168101 GATA motif in the neuroblastoma cell lines SKNSH and SHSY5Y, which are G/G homozygous, thereby preserving the GATA motif (Figure 1B). No other associated variant showed this unique combination of evolutionary conservation, active enhancer localization, and disruption of a transcription factor binding motif, including the sentinel SNP rs110419 (P=1.17×10⁻¹³) from our original report.2
In order to test for the possibility of multiple statistical signals or enhancers not marked by conservation or p300 at the LMO1 locus, we repeated association testing conditional on imputed rs2168101 genotypes and observed no significant variants after multiple test correction (most significant variant: rs34544683, nominal P=9.0×10⁻⁴, Bonferroni P=1; Extended Data Figure 2A). To test if the rs2168101 signal can be equally captured by other variants, we also performed reciprocal association tests for rs2168101 conditioned upon all 27 other SNPs within 1.5 Mb of LMO1 passing thresholds MAF>0.01 and nominal P<1×10⁻⁵. Notably, rs2168101 remained significant across all conditional tests (worst-case nominal P=2.6×10⁻⁷, Bonferroni P=0.002; Extended Data Figure 2B). These results are consistent with a single underlying signal at the LMO1 locus, and re-affirm that rs2168101 is the single best causal SNP candidate, because its association with neuroblastoma cannot be accounted for by other variants.
We next sought to determine if rs2168101 genotypes were associated with LMO1 expression by mRNA-sequencing of 127 primary high-risk neuroblastoma tumors. Genotyping rs2168101 yielded 102 G/G, 25 G/T, and no T/T tumors (MAF=9.8%). We observed significantly higher LMO1 expression in G/G versus G/T genotype tumors (T-test P=0.028; Figure 2A). Notably, the absence of protective homozygous T/T genotypes in this high-risk neuroblastoma cohort is consistent with our prior observation that the risk alleles predispose to the high-risk phenotypic subset2 (for clinical covariate associations, see Extended Data Table 3). Accordingly, the rs2168101 G/G genotype is highly associated with decreased neuroblastoma patient event-free (P=0.0004) and overall (P=0.0004) survival compared to G/T and T/T genotypes together in our European-American cohort (Extended Data Figure 3). Two cell lines with homozygous T/T or T/- genotypes expressed LMO1 at comparatively lower levels than cell lines containing the G-allele (Extended Data Figure 4A).
Figure 2. RNA expression of LMO1 associates with rs2168101 genotype consistent with regulation in cis.

(A) mRNA-Seq across 127 primary tumors genotyped for rs2168101 (G/G=102, G/T=25, T=0) revealed a significant decrease in LMO1 gene expression between G/T vs. G/G tumors (T-test P=0.028). (B) Using the synonymous exonic SNP, rs3750952, to measure allelic expression by mRNA-seq revealed significantly more allelic imbalance in 12 heterozygous neuroblastoma tumors (rs2168101=G/T) versus 33 homozygous tumors (rs2168101=G/G) (T-test P=5.3×10⁻⁵). (C) Allelic expression for rs2168101 from targeted nascent RNA-seq in four neuroblastoma cell lines. The two heterozygous cell lines (rs2168101=G/T) exhibited significantly reduced T-allele expression compared to the G-allele across 3 duplicate experiments (T-test P=1.6×10⁻⁴ and 1.5×10⁻² for NGP and NLF, respectively; error bars denote 95% CIs).
GATA transcription factors mediate chromatin looping and facilitate long-range enhancer-promoter interactions to regulate target gene expression21. We therefore sought to confirm allelic imbalance of LMO1 transcripts (a hallmark of gene regulation in cis), which could result from differential GATA-binding caused by rs2168101. First, because the rs2168101 intronic SNP is not detectable by mRNA sequencing, we identified the LMO1 exonic synonymous SNP, rs3750952, which can measure allelic expression in the heterozygous state. We identified 45 tumors with the necessary rs3750952=C/G genotype, and then directly genotyped rs2168101 (G/G=33, G/T=12, T/T=0) in this panel. By mRNA-Seq, there was greater allelic imbalance in 12 tumors that were heterozygous for rs2168101 (G/T) compared to 33 homozygous tumors (rs2168101=G/G; T-test P<0.0001; Figure 2B). We next used targeted sequencing of nuclear-enriched nascent RNAs in four neuroblastoma cell lines (G/G=1, G/T=2, T/T=1) to provide direct ascertainment of allele-specific expression at rs2168101. In both heterozygous lines, we observed allelic imbalance that significantly favored the risk G-allele over the protective T-allele (Figure 2C). Collectively, these results indicate that the intact GATA motif at rs2168101 results in significantly higher LMO1 expression levels than the TATA coded by the alternative allele. Allelic imbalance of LMO1 was not driven by somatic DNA alterations (e.g. loss of heterozygosity) that could affect allelic dosage (Extended Data Figure 4B).
Examination of neuroblastoma transcriptome data for 127 primary tumors showed that GATA2 and GATA3 are overexpressed compared to other members of the GATA transcription factor family (Extended Data Figure 5A) and that GATA3 is the most highly expressed. Additionally, protein immunoblotting showed that GATA3 is uniformly highly expressed in neuroblastoma cell lines, while LMO1 is highly expressed in the G/G (SKNSH and SHSY5Y), G/- (KELLY) and G/T (IMR32) cell lines, but only barely detectable in the BE2C cell line that lacks a G-allele at the rs2168101 locus (Extended Data Figure 5B). We therefore performed ChIP-Seq using a GATA3 antibody in neuroblastoma cell lines and observed robust GATA3 binding at rs2168101 in lines containing the G-allele (SHSY5Y, KELLY, BE2, and NGP) but not in a line containing only a T-allele (BE2C) (Figure 3A). We then specifically considered GATA3 ChIP-seq reads overlapping rs2168101, and we observed strong preferential binding to the G-allele in the G/T heterozygous cell lines BE2 (0.97 G-allele fraction from 38 reads, 95% CI: [0.86, 1.00], Binomial test P=2.8×10⁻¹⁰) and NGP (1.00 G-allele fraction from 6 reads, 95% CI: [0.54, 1.00], Binomial test P=0.03) (Figure 3B).
Figure 3. The rs2168101 protective T-allele disrupts GATA3-binding and negatively associates with the LMO1 super-enhancer in neuroblastoma cells.
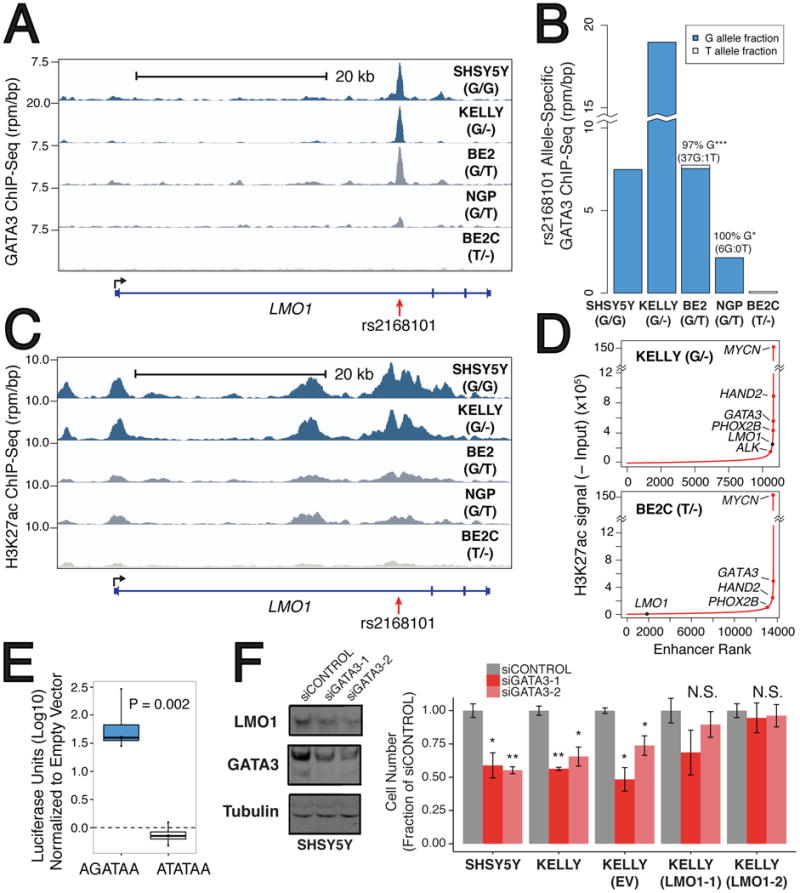
(A) Normalized GATA3 ChIP-seq signal at rs2168101 in five neuroblastoma cell lines (rs2168101 genotypes: SHSY5Y=G/G, KELLY=G/-, BE2=G/T, NGP=G/T, BE2C=T/-). (B) Allele-specific binding of GATA3 at rs2168101. GATA3 binding highly favored the risk G-allele in heterozygous lines (BE2: 0.97 G-allele fraction from 38 reads, 95% CI: [0.86, 1.00], Binomial P=2.8×10⁻¹⁰; NGP: 1.00 G-allele fraction from 6 reads, 95% CI: [0.54, 1.00], Binomial P=0.03). (C) Normalized ChIP-seq signal for H3K27ac at rs2168101. (D) Ranked H3K27ac signal across all enhancers in MYCN-amplified KELLY and BE2C lines. Super-enhancers associate with key neuroblastoma genes, highlighted on the curve. There is an LMO1-associated super-enhancer in G-allele-containing lines SHSY5Y, KELLY, and BE2, but not in BE2C, which lacks the G-allele. (E) Luciferase reporter assay for LMO1 enhancer region. The risk G-allele preserved enhancer activity (T-test P=0.002 across four independent clones), whereas the protective T-allele was indistinguishable from empty vector. (F) Left: Protein blots for GATA3, LMO1, and tubulin in SHSY5Y cells treated with control or siRNAs targeting GATA3, at 72hrs post-treatment. Right: Cell counts for lines SHSY5Y, KELLY, KELLY stably overexpressing control vector (EV) and KELLY with forced LMO1 overexpression (LMO1-1 and LMO1-2) treated with siRNAs at 72h post-transfection (see Extended Data Figure 7 for complete growth curves). Rescue of suppressed cell growth after GATA3 depletion by forced LMO1 expression was observed at 72h. Error bars denote +/- S.E.M. *P<0.05, ** P<0.001 by T-test.
Acetylation of histone H3 at lysine 27 (H3K27ac) is a hallmark of active enhancers22, and ChIP-seq analysis of SHSY5Y (G/G; not MYCN amplified), KELLY (G/-; MYCN amplified), BE2 (G/T; MYCN amplified), and NGP (G/T; MYCN amplified) neuroblastoma cells showed extensive H3K27 acetylation in the first intron of LMO1 across rs2168101, that was not observed in BE2C (T/-; MYCN amplified; Figure 3C). This region is classified as a super-enhancer in G-allele containing lines SHSY5Y, KELLY, and BE2 based on enhancer clustering and especially high H3K27ac signal (NGP was just below the threshold; see Methods), a pattern also observed for other known oncogenes and tumor suppressor genes in this disease (Figure 3D, Extended Data Figure 6A)23. No super-enhancer was observed in BE2C, Jurkat T-ALL cells that also express LMO124, or in other non-neuroblastoma tissues from ENCODE (Figure 3D, Extended Data Figure 6B-C). These results are consistent with recent evidence that disease-associated SNPs frequently affect enhancers that are specific to disease-relevant cell lines and tumor histology, and control developmental stage and tissue-specific gene expression5,23,25-28.
We next performed luciferase reporter assays to measure the effect of rs2168101 alleles on enhancer activity. HEK293T cells transfected with constructs containing the risk G-allele demonstrated 30-300 fold higher normalized luminescence compared to the T-allele (T-test P=0.002, Figure 3E), whereas luciferase activity of the T-allele was not significantly different from empty vector, indicating that the intact GATA motif is required for robust enhancer activity. Finally, knockdown of GATA3 in SHSY5Y and KELLY cells resulted in both decreased LMO1 protein levels and suppression of cell growth that was rescued by LMO1 overexpression (Figure 3F, Extended Data Figure 7), indicating the central role of GATA3 in regulating LMO1 expression levels in neuroblastoma.
Taken together, these data demonstrate the underlying molecular mechanism for a highly robust genetic association to neuroblastoma, mediated by a single common causal SNP rs2168101 that disrupts a GATA transcription factor binding site within a tissue-specific super-enhancer element. The rarity or absence of the protective allele in African populations and its relative depletion in African-Americans may partially explain the more aggressive clinical course in African-American children29. Moreover, this work further confirms the utility of association studies to define clinically relevant oncogenic pathways. Finally, the dependence of neuroblastoma cells on super-enhancer-mediated LMO1 expression provides another potential mechanism for the sensitivity of these tumors to inhibitors of the transcriptional machinery such as CDK7 and BET bromodomain proteins25,27, demonstrating the potential of translating basic mechanistic insights of tumor initiation towards novel therapeutic strategies.
Online methods
Genotype imputation and association testing
A primary European-American cohort of 2101 cases and 4202 matched controls were assayed with Illumina HumanHap550 v1, Illumina HumanHap550 v3, and Illumina Human610 SNP arrays as previously described11. Genotypes were phased using SHAPEIT v2.r790 and data from 1000 Genomes phase 1 version 3. Subsequently, imputation was performed using IMPUTE2 v2.3.1 for all SNPs and indel variants annotated in the 1000 Genomes phase 1 version 3. Testing for association with neuroblastoma under an additive genetic effect model was performed using the frequentist likelihood score method implemented in SNPTEST v2.4.1. Genotypes for a previously described African-American cohort of 365 cases 2491 controls17 were imputed and tested for neuroblastoma association using the same analytic pipeline. Statistical adjustment for gender was performed in both cohorts. For population stratification adjustment, the first 20 multidimensional scaling (MDS) components were included as covariates in the European-American cohort, while a measure of African admixture as estimated by the ADMIXTURE software program was used in the African-American cohort. Manhattan plots of SNP position and statistical significance were generated using LocusZoom software. Linkage plots were generated by Haploview software based on HapMap CEU individuals (Version 3, Release 2) using default settings. All research subjects or their guardians provided informed consent for research, and all institutions involved in this research had regulatory approval for human subjects research.
Prioritization of candidate causal variants
All SNPs and indels reported in the 1000 Genomes phase 1 version 3 data were considered as candidate causal variants and were ranked based on a combination of 1) neuroblastoma association in the primary European-American cohort, 2) evolutionary conservation, 3) DNase I hypersensitivity, and 4) transcription factor binding motif matching. Neuroblastoma association in European-Americans was evaluated as described above. Conservation scores were computed as the average of the phastCons46wayPlacental UCSC conservation track score for all bases from the -10 position to the +10 position surrounding each candidate variant. A DNase I hypersensitivity score was calculated by counting the number of sequencing tags from the -100 position to the +100 position around each candidate variant in ENCODE data for the neuroblastoma cell line, SK-N-SH. Position weight matrices representing transcription factor binding motifs were obtained from the JASPAR database, and candidate binding sites were identified by scanning the hg19 human reference genome using the MATCH-TM algorithm with a matrix similarity score (mSS) threshold of 0.90.
Neuroblastoma association replication and meta-analysis for rs2168101
We replicated the association of rs2168101 with neuroblastoma by direct genotyping of rs2168101 in independent Italian (Cases=420, Controls=751) and United Kingdom cohorts (Cases=369, Controls=1109). Meta-analysis across the European-American, African-American, Italian, and United Kingdom cohorts was performed using the inverse variance method provided in the METAL software program. Beta values (log-odds) and standard errors generated by SNPTEST, as described above, were used as input.
Survival analysis
We compared both overall survival and event-free survival over a 10-year follow-up period between G/G vs. G/T and T/T rs2168101 genotypes in a case-case comparison between neuroblastoma patients from the European-American cohort. Because rs2168101 genotypes were imputed in this cohort, the most-probable genotype predicted by IMPUTE2 was used for each patient. In the event of insufficient follow-up, all data was right censored. Cox proportional hazard modeling was performed using 20 MDS components to account for population stratification, in addition to MYCN amplification status, as covariates. All statistical analysis and generation of Kaplan-Meier plots was performed in R using the CRAN repository package, ‘survival’.
Total and allele-specific expression analysis
Total and allele-specific RNA expression analysis was performed based on poly-A enriched RNA-sequencing data from 127 primary neuroblastoma tumors sequenced through the TARGET project. RNA-seq reads were aligned to the hg19 human reference genome using the STAR aligner (v2.4.0b). Aligned reads were assigned to RefSeq genes using HTSeq (v0.6.1) and normalized to reads per kilobase per million reads (RPKM) for total gene expression measurements. DNA genotypes for rs2168101 were obtained either through matched whole-genome sequencing (N=69) or targeted genotyping assays (N=58 additional tumors). DNA genotypes for rs3750952 were obtained either through matched whole-genome or whole-exome sequencing.
Allele-specific RNA expression analysis was performed from a subset of 45 primary neuroblastoma tumors (out of 127) with the necessary synonymous exonic SNP genotypes (rs3750952=C/G) to enable measurement of allelic expression by mRNA-Seq. As a readout for allelic imbalance of rs3750952, we computed allelic fractions as min(C, G) / (C + G), since phasing between rs3750952 and rs2168101 alleles in each tumor was unknown. Statistical comparison between the two groups was performed by two-sided Welch's T-test, comparing 12 tumors heterozygous for rs2168101 (G/T) to the remaining 33 tumors that were homozygous for rs2168101 (G/G) as controls. DNA genotyping for rs2168101 was performed by whole-genome sequencing or a directed genotyping assay, whereas DNA genotyping for rs3750952 was determined from TARGET whole-exome or whole-genome sequencing. Where possible, integrity of sample matching was verified by measurement of genome-wide genotype concordance. All genotypes are reported with respect to the minus strand of the human reference genome, hg19.
To measure allele-specific expression directly at the intronic SNP we first purified the nuclear RNA fraction using the Cytoplasmic and Nuclear RNA purification Kit, (Norgen Biotek, Cat.#21000, Ontario, Canada) from four neuroblastoma cell lines (SNP rs2168101: SHSY5Y=G/G; NLF=G/T; NGP=G/G; NB1643=T/T). Ion AmpliSeq Designer v3.4.3 (Life Technologies White Glove service, Austin, USA) was used to design amplicons targeting the intronic SNP rs2168101 and three additional exonic SNPs in linkage disequilibrium. Custom AmpliSeq libraries were prepared in triplicate for each cell line, indexed, pooled and sequenced using an Ion 318 Chip on a Personal Genome Machine (Life Technologies). Reads were aligned to the hg19 reference genome and a synthetic genome showing the alternate allele at SNP rs2168101 at hg19 chr11:8255408 to account for any alignment bias. High quality mapped reads containing the reference G-allele or alternate T-allele were counted and tested for significant deviation from 50:50 expression using a two-sided one-sample T-test (null hypothesis that allele fraction = 0.50) across three experimental replicates. Primers pair sequences:
F: GTGTGGGAGACAAAUTCTTCCUGA R: GCCGGGCGUTACTGAACUT
F: CGCAAGAUCAAGGACCGCTAUC R: GATGAGGTUGGCCTTGGTGUA
F: CCUTTCCUGAAGGAGCGCAAA R: CACTTTCCATUAAGGAGATAGCAUCCC
F: CAAUCTAGGTUAAGAGCCGGACAAG R: GTGUCCAGCCGCAGCUA
Reporter Assays
Primers were designed to clone a 553bp genomic region (hg19, chr11:8255155-8255707) surrounding the candidate SNP rs2168101 at the GATA transcription factor binding site from neuroblastoma cell lines SKNSH (G/G) and matching site of BE2C (T/-). The cloned region did not contain other statistically significant SNPs at the LMO1 locus. The primers were designed to introduce sequences for restriction sites 5′-XhoI and 3′-BglII, which are present in the MCS of pGL4.26[luc2/minP/Hygro] (Promega Cat# E8441). XhoI/BglII restriction enzyme digested fragments were sequence verified, gel purified, ligated into pGL4.26[luc2/minP/Hygro], transformed into One Shot TOP 10 chemically competent cells (Life Technologies Cat # C4040-10) and grown on LB plates containing 50ug/ml ampicillin overnight at 37C. Colonies positive for the vector containing the insert were grown in 50 ml LB broth containing 50ug/ml ampicillin and plasmids were purified using a Qiagen Plasmid Midi Prep Kit (Qiagen Cat# 12143). Transfection into HEK293 cells which were approximately 50% confluent was accomplished using Fugene 6 Transfection reagent (Promega E2691) at a 3 ul:1ug fugene:DNA ratio. Cells underwent selection in 150ug/ml Hygromycin B (Mediatech, Inc. Cat#30-240-CR) and individual colonies were picked and grown, and genotypes of constructs were confirmed by fragment size and Sanger sequencing. Subsequently, HEK293 + 553bp insert cells and HEK294 + vector only cells were grown in 96 well optical plates. On day 2, the cells were transiently fugene transfected with the Renilla expression control vector pGL4.74[hRLuc/TK] (Promega Cat# E6921) at a 1:500 dilution with respect to the luciferase vector. Luciferase assays were carried out 48 hours after Renilla transfection using Dual Luciferase Reporter Assay System (Promega E1910) with read-outs performed on a Dual Injector System for GloMax®-Multi Detection System (Promega Cat# E7081). Luciferase expression was normalized to Renilla expression. All reporter assays were performed in quintuplicate (five technical replicates each) across the experimental conditions: 1) HEK293T, 2) HEK293T with empty vector, 3-6) four independent clones of HEK293T with T-allele construct, and 7-10) four independent clones of HEK293T with G-allele construct. Results were averaged across technical replicates, normalized to empty vector, and reporter activities for T-allele vs. G-allele clones (four biological replicates each) were analyzed by two-sided Welch's T-test.
Construct risk allele (G)
GTAGGGGTTGGAGTTCAGCCTGTTTCCCCTCCAATGTTGTTCCCCCCACATCCTGAGACTTAGGGGTGACCCTGGGTTGAGTGGACTGGTTTATTCTGCTGGGCCCAGCGCATGCATCTGAGTGTGTGCCCAGGCGTGCGTGTCGGCGCAAACATCATCCATTGTGAAATATCAGTGTTTTCATGGGTGAGTAGTAATTACTGGGTAATGCTTTAAAACCTTTCCTGAAGGAGCGCAAAGCCATTTTTTTCTAAAGTCAGGAGTACATTAAAAGGATTACCATGTAGATTTGATTTTTAGATAACACTAAAATGGATCCCAAATGGACTTCAGCAAAGGGATGCTATCTCCTTAATGGAAAGTGCATGGCCCGAGGCTCAGGTCCCAGAGCCAGGCTGGGGAAGGAGGGAGGGAAGAGGTGTCTGCAGGGGGGCAGGCTGGCAGATTGGGTGGGGGCTAGGTGGGAATGGGGAAGGCAGAGCAGGAGGGAGGGCCTGGACCCTGTGGGGAGCTTATCCCTCCATCTGGGGAGCAGGAGACTACAGAGCCCCT
Construct protective allele (T)
GTAGGGGTTGGAGTTCAGCCTGTTTCCCCTCCAATGTTGTTCCCCCCACATCCTGAGACTTAGGGGTGACCCTGGGTTGAGTGGACTGGTTTATTCTGCTGGGCCCAGCGCATGCATCTGAGTGTGTGCCCAGGCGTGCGTGTCGGCGCAAACATCATCCATTGTGAAATATCAGTGTTTTCATGGGTGAGTAGTAATTACTGGGTAATGCTTTAAAACCTTTCCTGAAGGAGCGCAAAGCCATTTTTTTCTAAAGTCAGGAGTACATTAAAAGGATTACCATGTAGATTTGATTTTTATATAACACTAAAATGGATCCCAAATGGACTTCAGCAAAGGGATGCTATCTCCTTAATGGAAAGTGCATGGCCCGAGGCTCAGGTCCCAGAGCCAGGCTGGGGAAGGAGGGAGGGAAGAGGTGTCTGCAGGGGGGCAGGCTGGCAGATTGGGTGGGGGGCTAGGTGGGAATGGGGAAGGCAGAGCAGGAGGGAGGGCCTGGACCCTGTGGGGAGCTTATCCCTCCATCTGGGGAGCAGGAGACTACAGAGCCCCT
Cell Culture and Protein Lysates
Jurkat T-ALL and neuroblastoma cell lines were sourced from the American Type Tissue Culture Collection, and kept in growth medium of RPMI+10% heat-inactivated FCS with 1% penicillin-streptomycin, as previously described24. Cells were lysed for protein, with subsequent protein quantified by spectrophotometry, as previously described (Mansour et al, 2014). Protein was resolved on 8-14% Tris-Bis gels, transferred to PVDF membranes, blocked and subjected to primary and secondary antibodies, as previously described (Mansour et al, 2014). Primary antibodies were anti-GATA3 (Pierce Biotechnology, 1:1000), anti-LMO1 (Bethyl Laboratories, 1:1000) and alpha-tubulin (Cell Signaling Technologies, 1:1000). Blots were developed with secondary HRP-conjugated antibodies (Cell Signaling Technologies, 1:5000) and Protein-plus Dura ECL Reagent (Thermo-Fisher Scientific). All cell lines are genotyped semiannually to assure identity and also tested routinely for mycoplasma contamination.
Genome-wide occupancy analysis
ChIP coupled with massively parallel DNA sequencing (ChIP-seq) was performed as previously described31,32. The following antibodies were used for ChIP: anti-H3K27ac (Abam, ab4729) and anti GATA3(Santa Cruz, sc-22206X). For each ChIP, 10 μg of antibody was added to 3 ml of sonicated nuclear extract. Illumina sequencing, library construction and ChIP-seq analysis methods were previously described32. ChIP-seq datasets are available under super series GSE65664, and relevant accession numbers are shown in Supplemental Table 2.
ChIP-Seq processing
Reads were aligned to build hg19 of the human genome using bowtie with parameters –k 2 –m 2 –e 70 –best and –l set to the read length33. For visualization in the UCSC genome browser in Figure 3A, 3C, and Extended Data Figure 634, WIG files were created from aligned ChIP-Seq read positions using MACS 1.4.2 with parameters –w –S –space=50 –nomodel –shiftsize=200 to artificially extend reads to be 200bp and to calculate their density in 50bp bins35. Read counts in 50bp bins were then normalized to the millions of mapped reads, giving reads per million (rpm) values.
ChIP-Seq allele specificity analysis
To determine preferential ChIP-Seq coverage of one allele, which implies preferential binding of protein to one allele vs. another, we counted the reads at rs2168101 using samtools mpileup36. By using the aligned reads described above, this gave us a count of reads with a given base at this position. The fraction of reads with the risk allele vs. the protective allele is reported in Figure 3B. Statistical tests for preferential allelic binding were performed by two-sided binomial test.
Enriched regions
Regions enriched in ChIP-Seq signal were identified twice using MACS with corresponding control and parameters –keep-dup=all and –p 1e-9 or –keep-dup=1 and –p 1e-9. Super-enhancers in SHSY5Y and KELLY were identified using ROSE (https://bitbucket.org/young_computation/rose)28,37 with modifications inspired by Chipumoro et al.25. Briefly, peaks of H3K27ac were identified using MACS as described above and their union was used as constituent enhancers. These peaks were stitched computationally if they were within 12500bp of each other, though peaks fully contained within +/-2000bp from a RefSeq promoter were excluded from stitching. These stitched enhancers were ranked by their H3K27ac signal (length * density) with input signal in the corresponding region subtracted. Super-enhancers were separated from typical enhancers by geometrically determining the point at which the line y=x is tangent to the curve of stitched enhancer rank vs. stitched enhancer signal. Those stitched enhancers above this point are considered super-enhancers.
To account for the known focal amplification of the MYCN locus in KELLY, BE2, BE2C, and NGP neuroblastoma cells, which contain enhancers, we modified our pipeline slightly. Because MACS is insensitive for the identification of peaks in focally amplified DNA, we identified peaks of H3K27ac vs. input using MACS2 callpeak (https://pypi.python.org/pypi/MACS2) with parameters –broad –keep-dup=1 –p 1e-9 and –broad –keep-dup=all –p 1e-9. The union of these MACS2 calls was used as constituent enhancers for ROSE with the remaining parameters as described above. For Figure 3D, the majority of the curve represents the analysis performed using MACS-identified constituents; the rank and signal of the MYCN-associated enhancer comes from this MACS2-identified set of constituents to remain consistent with the conclusions and methods as previously described25. The curve output from the MACS-identified enhancers was vertically compressed and a point representing the signal of the MYCN-associated super-enhancer from the MACS2-identified enhancers was added in Illustrator. Super-enhancers were assigned to the single expressed RefSeq transcript whose TSS was nearest the center of the stitched region. Expressed genes were in the top 2/3 of RefSeq transcripts ranked by their promoter (TSS +/- 500bp) H3K27ac signal determined by bamToGFF (https://github.com/BradnerLab/pipeline) with parameters –e 200 –m 1 –r –d.
Clone Cell Generation
LMO1 cDNA was amplified from pcDNA3-LMO1 and subcloned into the XhoI and NotI site of the lentiviral vector pOZ-FHN. Lentivirus expressing FH-LMO1 was propagated in HEK293T cells by cotransfection with psPAX2 and pMD2.G plasmids (adgene) using FUGENE 6 (Roche) by standard methodologies38. Viral supernatant was recovered and KELLY cells were infected with lentivirus expressing FH-LMO1 or empty vector alone, as previously described24. Cells were sorted for expression of the IL2R, and positive expression was used to establish single cell clones. Expression of FH-LMO1 was assessed by western blotting as above to confirm overexpression.
siRNA and growth assays
SHSY5Y, KELLY, and KELLY clone cells were reverse transfected with 100 nM concentrations of either non-targeted (Control siRNA #1) or GATA3-targetted siRNA #1 or #2 (Ambion) for 6h with lipofectamine 2000 (1:1000) in Optimem I prior to being replated into growth assays in normal RPMI growth media. 2×10⁵ cells were replated in triplicate for counting at 24, 48 and 72h post-transfection by manual hemocytometry. 5×10⁵ cells were replated for protein lysates at the same time points. All experiments were repeated in triplicate, with a technical replicate number of 9 for all cell growth assays as described39. Statistical tests were performed by two-sided Welch's T-test.
Data Access
GWAS and sequencing data used for this analysis are available in dbGaP under accession phs000124 and phs000467. The tumor genomics data are also available through the Therapeutically Applicable Research to Generate Effective Treatments (TARGET) data matrix portal (http://target.nci.nih.gov/dataMatrix/TARGET_DataMatrix.html). Data generated through the ENCODE project including DNase I hypersensitivity sequencing and ChIP-sequencing data were obtained from ftp://hgdownload.cse.ucsc.edu/goldenPath/hg19/encodeDCC/. Aligned sequencing read (bam) files were utilized as provided from the FTP site. The mammalian evolutionary conservation track representing 46 mammalian species (phastCons46wayPlacental) was obtained from the UCSC Table Browser http://genome.ucsc.edu/cgi-bin/hgTables?command=start. JASPAR-annotated transcription factor binding site position frequency matrices were obtained from http://jaspar.genereg.net/html/DOWNLOAD/JASPAR_CORE/pfms/pfms_all.txt. New ChIP-seq datasets generated in this study are available under super series GSE65664.
Extended Data
Extended Data Figure 1.

Extended Data Figure 2.

Extended Data Figure 3.

Extended Data Figure 4.

Extended Data Figure 5.

Extended Data Figure 6.

Extended Data Figure 7.

Extended Data Table 1.
| Variant ID (rsID) | Chromosome | Position (hg19) | Alleles (Ref/Alt)* | Alt Allele Frequency Cases | Alt Allele Frequency Controls | P-Value† | Odds Ratio† |
|---|---|---|---|---|---|---|---|
| rs191871553 | 11 | 8222464 | C/T | 0.035 (n=2101) | 0.054 (n=4202) | 7.49E-06 | 0.64 (0.53-0.78) |
| rs11041809 | 11 | 8231605 | A/G | 0.498 (n=2101) | 0.440 (n=4202) | 1.13E-07 | 0.80 (0.74-0.87) |
| rs11041811 | 11 | 8231665 | C/T | 0.492 (n=2101) | 0.434 (n=4202) | 1.28E-07 | 0.80 (0.74-0.87) |
| rs11041812 | 11 | 8231684 | C/T | 0.492 (n=2101) | 0.433 (n=4202) | 1.22E-07 | 0.80 (0.74-0.87) |
| rs11041813 | 11 | 8235207 | T/C | 0.478 (n=2101) | 0.420 (n=4202) | 1.67E-07 | 0.81 (0.75-0.87) |
| rs10839999 | 11 | 8236083 | G/A | 0.480 (n=2101) | 0.423 (n=4202) | 5.06E-07 | 0.81 (0.75-0.88) |
| rs10769885 | 11 | 8236262 | C/A | 0.513 (n=2101) | 0.453 (n=4202) | 3.77E-08 | 0.80 (0.74-0.87) |
| rs4758049 | 11 | 8238428 | A/C | 0.511 (n=2101) | 0.452 (n=4202) | 7.48E-08 | 0.81 (0.74-0.87) |
| rs4758050 | 11 | 8238545 | G/C | 0.511 (n=2101) | 0.452 (n=4202) | 7.34E-08 | 0.81 (0.74-0.87) |
| rs4758051 | 11 | 8238639 | G/A | 0.510 (n=2101) | 0.452 (n=4202) | 1.22E-07 | 0.81 (0.75-0.87) |
| rs10840000 | 11 | 8240113 | G/C | 0.509 (n=2101) | 0.450 (n=4202) | 6.22E-08 | 0.80 (0.74-0.87) |
| rs7933766 | 11 | 8240464 | G/A | 0.511 (n=2101) | 0.453 (n=4202) | 2.09E-07 | 0.81 (0.75-0.88) |
| rs11041816 | 11 | 8243798 | A/G | 0.397 (n=2101) | 0.456 (n=4202) | 8.99E-10 | 0.77(0.71-0.84) |
| rs4315061 | 11 | 8247020 | T/C | 0.425 (n=2101) | 0.490 (n=4202) | 1.25E-09 | 0.78 (0.72-0.84) |
| rs72474792 | 11 | 8247885 | TATAAAA/T | 0.524 (n=2101) | 0.456 (n=4202) | 2.04E-10 | 0.77(0.71-0.84) |
| rs12797723 | 11 | 8247984 | C/T | 0.443 (n=2101) | 0.514 (n=4202) | 2.05E-10 | 0.77(0.71-0.84) |
| rs2290451 | 11 | 8248440 | C/G | 0.295 (n=2101) | 0.255 (n=4202) | 8.20E-06 | 1.23(1.12-1.34) |
| rs7952320 | 11 | 8250143 | G/C | 0.408 (n=2101) | 0.480 (n=4202) | 3.03E-11 | 1.31 (1.21-1.42) |
| rs4758317 | 11 | 8250811 | C/A | 0.514 (n=2101) | 0.447 (n=4202) | 5.76E-10 | 0.78 (0.72-0.84) |
| rs11041820 | 11 | 8251438 | G/A | 0.294 (n=2101) | 0.253 (n=4202) | 6.77E-06 | 1.23 (1.12-1.34) |
| rs3750952 | 11 | 8251921 | G/C | 0.408 (n=2101) | 0.481 (n=4202) | 1.89E-11 | 0.76 (0.70-0.83) |
| rs110419 | 11 | 8252853 | A/G | 0.441 (n=2101) | 0.511 (n=4202) | 3.16E-10 | 0.78 (0.72-0.84) |
| rs 110420 | 11 | 8253049 | T/C | 0.441 (n=2101) | 0.511 (n=4202) | 3.36E-10 | 0.78 (0.72-0.84) |
| rs204928 | 11 | 8254433 | A/G | 0.444 (n=2101) | 0.512 (n=4202) | 9.85E-10 | 0.78 (0.72-0.85) |
| rs204926 | 11 | 8255106 | G/A | 0.440 (n=2101) | 0.510 (n=4202) | 1.97E-11 | 0.76 (0.70-0.82) |
| rs2168101 | 11 | 8255408 | C/A | 0.242 (n=2101) | 0.313 (n=4202) | 4.14E-16 | 0.67(0.61-0.74) |
| rs7948497 | 11 | 8255855 | C/G | 0.479 (n=2101) | 0.419 (n=4202) | 4.05E-10 | 1.30(1.20-1.41) |
Extended Data Table 2.
| Characteristic | Whole Exome Sequencing (Blood and Tumor) N=222* | Whole Genome Sequencing (Blood and Tumor) N = 136* | LMO1 Targeted Sequencing (Blood) N = 183* | Whole Transcriptome mRNA Sequencing (Tumor) N = 127 |
|---|---|---|---|---|
| Age | ||||
| < 18 mos | 0 (0%) | 32 (24%) | 82 (45%) | 8 (6%) |
| >= 18 mos | 219 (100%) | 103 (76%) | 101 (55%) | 119 (94%) |
| Not Available | 3 | 1 | 0 | 0 |
| INSS Stage† | ||||
| Stage 1 | 0 (0%) | 0 (0%) | 39 (21%) | 0 (0%) |
| Stage 2A | 0 (0%) | 0 (0%) | 13 (7%) | 0 (0%) |
| Stage 2B | 0 (0%) | 1 (1%) | 18 (10%) | 0 (0%) |
| Stage 3 | 0 (0%) | 6 (4%) | 27 (15%) | 6 (5%) |
| Stage 4 | 219 (100%) | 105 (78%) | 78 (43%) | 121 (95%) |
| Stage 4S | 0 (0%) | 23 (17%) | 8 (4%) | 0 (0%) |
| Not Available | 3 | 1 | 0 | 0 |
| MYCN | ||||
| Not Amplified | 143 (67%) | 102 (76%) | 151 (83%) | 95 (75%) |
| Amplified | 71 (33%) | 32 (24%) | 30 (17%) | 31 (25%) |
| Not Available | 8 | 2 | 2 | 1 |
| Histology | ||||
| Favorable | 4 (2%) | 29 (23%) | 95 (54%) | 9 (8%) |
| Unfavorable | 187 (98%) | 96 (77%) | 82 (46%) | 107 (92%) |
| Not Available | 31 | 11 | 6 | 11 |
| DNA Index | ||||
| Hyperdiploid | 117 (54%) | 81 (61%) | 121 (67%) | 67 (53%) |
| Diploid | 98 (46%) | 52 (39%) | 59 (33%) | 59 (47%) |
| Not Available | 7 | 3 | 3 | 1 |
| Risk | ||||
| Low | 0 (0%) | 15 (11%) | 64 (35%) | 0 (0%) |
| Intermediate | 0 (0%) | 14 (10%) | 49 (27%) | 6 (5%) |
| High | 219 (100%) | 106 (79%) | 69 (38%) | 121 (95%) |
| Not Available | 3 | 1 | 1 | 0 |
Extended Data Table 3.
| Clinical/Biological Co-variate | rs2168101 genotypes* | Association result | |||
|---|---|---|---|---|---|
|
| |||||
| GG | GT | TT | P-Value† | Odds Ratio† | |
| Stage‡ 4 | 530 (62%) | 280 (33%) | 49 (6%) | 0.01198 | 0.81 (0.69-0.95) |
| Not Stage 4 | 611 (56%) | 400 (37%) | 74 (7%) | ||
| MYCN Amplified | 183 (55%) | 115 (34%) | 36 (11%) | 0.00297 | 1.39 (1.12-1.73) |
| MYCN Non-Amplified | 881 (59%) | 525 (35%) | 83 (6%) | ||
| High-Risk | 523 (63%) | 263 (32%) | 47 (6%) | 0.00174 | 0.76 (0.65-0.90) |
| Not High-Risk | 594 (56%) | 398 (37%) | 73 (7%) | ||
| Unfavorable Histology | 454(61%) | 237 (32%) | 48 (6%) | 0.14479 | 0.88 (0.73-1.05) |
| Favorable Histology | 527 (57%) | 336 (36%) | 62 (7%) | ||
| DNA Index Hyperdiploid | 685 (59%) | 412(35%) | 71 (6%) | 0.32009 | 0.91 (0.76-1.09) |
| DNA Index Diploid | 324 (57%) | 198(35%) | 43 (8%) | ||
| Age >= 18 mos | 621 (61%) | 346 (34%) | 55 (5%) | 0.01448 | 0.82 (0.69-0.96) |
| Age < 18 mos | 529 (57%) | 338 (36%) | 68 (7%) | ||
Supplementary Material
Acknowledgments
This work was supported in part by NIH Grants R01-CA124709 (JMM), R01-CA180692 (JMM and ATL), R00-CA151869 (SJD), RC1MD004418 to the TARGET consortium, 1K99CA178189 (S.Z.), T32-HG000046 (DAO), R01-CA109901 (RAY), the Giulio D'Angio Endowed Chair (JMM), the PressOn Foundation (JMM), Andrew's Army Foundation (JMM), the Abramson Family Cancer Research Institute (JMM), the Brooke Mulford Foundation (JMM), the University of Pennsylvania Genome Frontiers Institute, an Alex's Lemonade Stand Foundation Innovation Award (ATL), young investigator awards from Alex's Lemonade Stand Foundation (SZ, AW) and the CureSearch for Children's Cancer Foundation (SZ), grant from the German Cancer Aid 110801 (NW), St Baldricks Foundation Fellow award (AW), George L. Ohrstrom Jr. foundation (AW), Wellcome Trust Senior Investigator Award Ref:100210/Z/12/Z (NR) and NHS funding to the NIHR Biomedical Research Centre at The Royal Marsden and the ICR (NR), Fondazione Italiana per la Lotta al Neuroblastoma and Associazione Italiana per la Ricerca sul Cancro (10537) (MC),
We gratefully acknowledge the Children's Oncology Group for providing the majority of blood and tumors specimens and clinical and outcome data (U10-CA98543 and U10-CA98413) from neuroblastoma patients and thank patients and families participating in the Factors Associated with Childhood Tumors (FACT) study. We thank A. Renwick who undertook the Taqman analyses and A. Zachariou for recruiting participants to the FACT study. We thank Dr. G. Blobel for scientific advice and discussion, and generously providing equipment and reagents for ChIP experiments, Drs. N. Saeki and H. Sasaki for providing the LMO1 cDNA clone, and Dr. Y. Nakatan for providing the lentiviral vector pOZ-FHN.
Footnotes
Author Contributions: J.M.M. and A.T.L. conceived the study, guided interpretation of results and guided preparation of the manuscript. D.A.O. and A.C.W. and performed and/or oversaw the majority of the experiments, computational analyses and data interpretation. I.C., R.S., C.W., L.S. H, S.Z., N.W., A.D.D., B.J.A., L.A., L.T., K.T., K.B., and R.A.Y. performed the genomic and epigenetic experiments and data analysis including DNA sequencing and ChIP sequencing. L.D.M., S.J.D. and H.H. performed the fine mapping and association testing. J.S.W. and J.K. performed the tumor RNA sequencing. N.R. and M.C. performed the validation genotyping and association testing. M.C. and A.I. replicated the SNP association in the Italian cohort. A.C.W. and D.O. drafted the manuscript, while A.T.L. and J.M.M. and other authors edited the manuscript.
Financial Disclosures: None.
References
- 1.Maris JM. Recent advances in neuroblastoma. N Engl J Med. 2010;362:2202–2211. doi: 10.1056/NEJMra0804577. [DOI] [PMC free article] [PubMed] [Google Scholar]
- 2.Wang K, et al. Integrative genomics identifies LMO1 as a neuroblastoma oncogene. Nature. 2011;469:216–220. doi: 10.1038/nature09609. [DOI] [PMC free article] [PubMed] [Google Scholar]
- 3.Maurano MT, et al. Systematic localization of common disease-associated variation in regulatory DNA. Science. 2012;337:1190–1195. doi: 10.1126/science.1222794. [DOI] [PMC free article] [PubMed] [Google Scholar]
- 4.Edwards SL, Beesley J, French JD, Dunning AM. Beyond GWASs: illuminating the dark road from association to function. American Journal of Human Genetics. 2013;93:779–797. doi: 10.1016/j.ajhg.2013.10.012. [DOI] [PMC free article] [PubMed] [Google Scholar]
- 5.Sur I, Tuupanen S, Whitington T, Aaltonen LA, Taipale J. Lessons from functional analysis of genome-wide association studies. Cancer Res. 2013;73:4180–4184. doi: 10.1158/0008-5472.CAN-13-0789. [DOI] [PubMed] [Google Scholar]
- 6.Farh KK, et al. Genetic and epigenetic fine mapping of causal autoimmune disease variants. Nature. 2014 doi: 10.1038/nature13835. [DOI] [PMC free article] [PubMed] [Google Scholar]
- 7.Maris JM, et al. Chromosome 6p22 locus associated with clinically aggressive neuroblastoma. N Engl J Med. 2008;358:2585–2593. doi: 10.1056/NEJMoa0708698. [DOI] [PMC free article] [PubMed] [Google Scholar]
- 8.Diskin SJ, et al. Copy number variation at 1q21.1 associated with neuroblastoma. Nature. 2009;459:987–991. doi: 10.1038/nature08035. [DOI] [PMC free article] [PubMed] [Google Scholar]
- 9.Capasso M, et al. Common variations in BARD1 influence susceptibility to high-risk neuroblastoma. Nat Genet. 2009;41:718–723. doi: 10.1038/ng.374. doi:ng.374 [pii] 10.1038/ng.374. [DOI] [PMC free article] [PubMed] [Google Scholar]
- 10.Nguyen le B, et al. Phenotype restricted genome-wide association study using a gene-centric approach identifies three low-risk neuroblastoma susceptibility Loci. PLoS Genet. 2011;7:e1002026. doi: 10.1371/journal.pgen.1002026. [DOI] [PMC free article] [PubMed] [Google Scholar]
- 11.Diskin SJ, et al. Common variation at 6q16 within HACE1 and LIN28B influences susceptibility to neuroblastoma. Nature Genetics. 2012;44:1126–1130. doi: 10.1038/ng.2387. [DOI] [PMC free article] [PubMed] [Google Scholar]
- 12.Capasso M, et al. Replication of GWAS-identified neuroblastoma risk loci strengthens the role of BARD1 and affirms the cumulative effect of genetic variations on disease susceptibility. Carcinogenesis. 2013;34:605–611. doi: 10.1093/carcin/bgs380. [DOI] [PMC free article] [PubMed] [Google Scholar]
- 13.Diskin SJ, et al. Rare variants in TP53 and susceptibility to neuroblastoma. J Natl Cancer Inst. 2014;106:dju047. doi: 10.1093/jnci/dju047. [DOI] [PMC free article] [PubMed] [Google Scholar]
- 14.Matthews JM, Lester K, Joseph S, Curtis DJ. LIM-domain-only proteins in cancer. Nature reviews Cancer. 2013 doi: 10.1038/nrc3418. [DOI] [PubMed] [Google Scholar]
- 15.McCormack MP, et al. The Lmo2 oncogene initiates leukemia in mice by inducing thymocyte self-renewal. Science. 2010;327:879–883. doi: 10.1126/science.1182378. [DOI] [PubMed] [Google Scholar]
- 16.Simonis M, et al. High-resolution identification of balanced and complex chromosomal rearrangements by 4C technology. Nature methods. 2009;6:837–842. doi: 10.1038/nmeth.1391. [DOI] [PubMed] [Google Scholar]
- 17.Latorre V, et al. Replication of Neuroblastoma SNP Association at the BARD1 Locus in African-Americans. Cancer epidemiology, biomarkers & prevention. 2012;21:658–663. doi: 10.1158/1055-9965.EPI-11-0830. [DOI] [PMC free article] [PubMed] [Google Scholar]
- 18.Zhang X, Cowper-Sal lari R, Bailey SD, Moore JH, Lupien M. Integrative functional genomics identifies an enhancer looping to the SOX9 gene disrupted by the 17q24.3 prostate cancer risk locus. Genome Res. 2012;22:1437–1446. doi: 10.1101/gr.135665.111. [DOI] [PMC free article] [PubMed] [Google Scholar]
- 19.Cowper-Sal lari R, et al. Breast cancer risk-associated SNPs modulate the affinity of chromatin for FOXA1 and alter gene expression. Nat Genet. 2012;44:1191–1198. doi: 10.1038/ng.2416. [DOI] [PMC free article] [PubMed] [Google Scholar]
- 20.Mathelier A, et al. JASPAR 2014: an extensively expanded and updated open-access database of transcription factor binding profiles. Nucleic Acids Res. 2014;42:D142–147. doi: 10.1093/nar/gkt997. [DOI] [PMC free article] [PubMed] [Google Scholar]
- 21.Deng W, et al. Controlling long-range genomic interactions at a native locus by targeted tethering of a looping factor. Cell. 2012;149:1233–1244. doi: 10.1016/j.cell.2012.03.051. [DOI] [PMC free article] [PubMed] [Google Scholar]
- 22.Creyghton MP, et al. Histone H3K27ac separates active from poised enhancers and predicts developmental state. Proc Natl Acad Sci U S A. 2010;107:21931–21936. doi: 10.1073/pnas.1016071107. [DOI] [PMC free article] [PubMed] [Google Scholar]
- 23.Hnisz D, et al. Super-enhancers in the control of cell identity and disease. Cell. 2013;155:934–947. doi: 10.1016/j.cell.2013.09.053. [DOI] [PMC free article] [PubMed] [Google Scholar]
- 24.Sanda T, et al. Core transcriptional regulatory circuit controlled by the TAL1 complex in human T cell acute lymphoblastic leukemia. Cancer Cell. 2012;22:209–221. doi: 10.1016/j.ccr.2012.06.007. [DOI] [PMC free article] [PubMed] [Google Scholar]
- 25.Chipumuro E, et al. CDK7 Inhibition Suppresses Super-Enhancer-Linked Oncogenic Transcription in MYCN-Driven Cancer. Cell. 2014;159:1126–1139. doi: 10.1016/j.cell.2014.10.024. [DOI] [PMC free article] [PubMed] [Google Scholar]
- 26.Parker SC, et al. Chromatin stretch enhancer states drive cell-specific gene regulation and harbor human disease risk variants. Proc Natl Acad Sci U S A. 2013;110:17921–17926. doi: 10.1073/pnas.1317023110. [DOI] [PMC free article] [PubMed] [Google Scholar]
- 27.Puissant A, et al. Targeting MYCN in neuroblastoma by BET bromodomain inhibition. Cancer Discov. 2013;3:308–323. doi: 10.1158/2159-8290.CD-12-0418. [DOI] [PMC free article] [PubMed] [Google Scholar]
- 28.Whyte WA, et al. Master transcription factors and mediator establish super-enhancers at key cell identity genes. Cell. 2013;153:307–319. doi: 10.1016/j.cell.2013.03.035. [DOI] [PMC free article] [PubMed] [Google Scholar]
- 29.Henderson TO, et al. Racial and ethnic disparities in risk and survival in children with neuroblastoma: a Children's Oncology Group study. Journal of clinical oncology : official journal of the American Society of Clinical Oncology. 2011;29:76–82. doi: 10.1200/JCO.2010.29.6103. [DOI] [PMC free article] [PubMed] [Google Scholar]
- 30.Sussman RT, et al. The epigenetic modifier ubiquitin-specific protease 22 (USP22) regulates embryonic stem cell differentiation via transcriptional repression of sex-determining region Y-box 2 (SOX2) J Biol Chem. 2013;288:24234–24246. doi: 10.1074/jbc.M113.469783. [DOI] [PMC free article] [PubMed] [Google Scholar]
- 31.Lee TI, Johnstone SE, Young RA. Chromatin immunoprecipitation and microarray-based analysis of protein location. Nat Protoc. 2006;1:729–748. doi: 10.1038/nprot.2006.98. [DOI] [PMC free article] [PubMed] [Google Scholar]
- 32.Marson A, et al. Connecting microRNA genes to the core transcriptional regulatory circuitry of embryonic stem cells. Cell. 2008;134:521–533. doi: 10.1016/j.cell.2008.07.020. [DOI] [PMC free article] [PubMed] [Google Scholar]
- 33.Langmead B, Trapnell C, Pop M, Salzberg SL. Ultrafast and memory-efficient alignment of short DNA sequences to the human genome. Genome Biol. 2009;10:R25. doi: 10.1186/gb-2009-10-3-r25. [DOI] [PMC free article] [PubMed] [Google Scholar]
- 34.Kent WJ, et al. The human genome browser at UCSC. Genome Res. 2002;12:996–1006. doi: 10.1101/gr.229102. Article published online before print in May 2002. [DOI] [PMC free article] [PubMed] [Google Scholar]
- 35.Zhang Y, et al. Model-based analysis of ChIP-Seq (MACS) Genome Biol. 2008;9:R137. doi: 10.1186/gb-2008-9-9-r137. [DOI] [PMC free article] [PubMed] [Google Scholar]
- 36.Li H, et al. The Sequence Alignment/Map format and SAMtools. Bioinformatics. 2009;25:2078–2079. doi: 10.1093/bioinformatics/btp352. [DOI] [PMC free article] [PubMed] [Google Scholar]
- 37.Loven J, et al. Selective inhibition of tumor oncogenes by disruption of super-enhancers. Cell. 2013;153:320–334. doi: 10.1016/j.cell.2013.03.036. [DOI] [PMC free article] [PubMed] [Google Scholar]
- 38.Nakatani Y, Ogryzko V. Immunoaffinity purification of mammalian protein complexes. Methods Enzymol. 2003;370:430–444. doi: 10.1016/S0076-6879(03)70037-8. [DOI] [PubMed] [Google Scholar]
- 39.Durbin AD, et al. JNK1 determines the oncogenic or tumor-suppressive activity of the integrin-linked kinase in human rhabdomyosarcoma. J Clin Invest. 2009;119:1558–1570. doi: 10.1172/JCI37958. [DOI] [PMC free article] [PubMed] [Google Scholar]
Associated Data
This section collects any data citations, data availability statements, or supplementary materials included in this article.