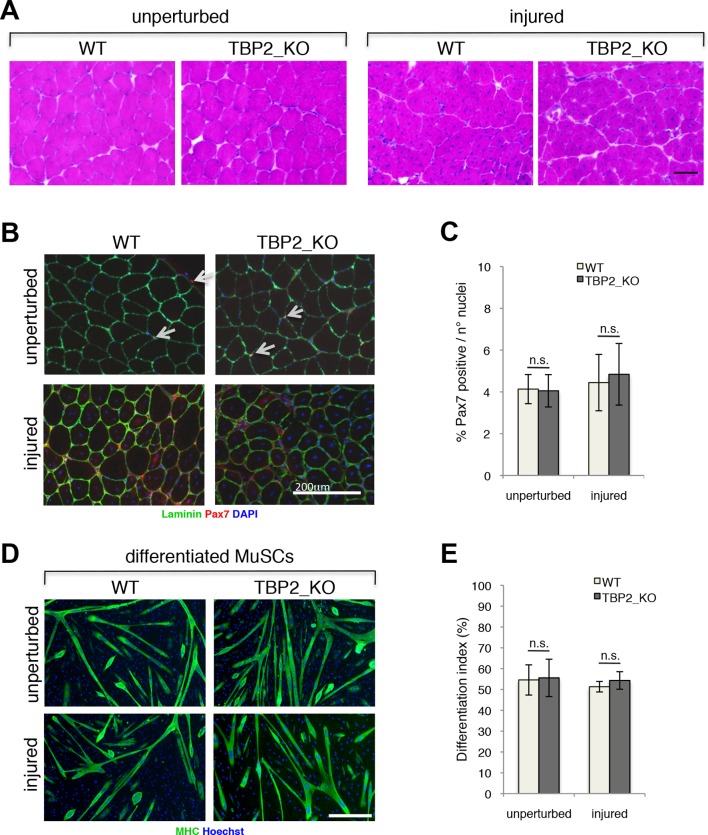
Figure 1. Regenerative potential and differentiation of MuSCs are intact in the absence of TBP2.
(A) Cross-sections of unperturbed (left panel) and notexin injured (right panel) muscles were histologicaly assessed by Hematoxilin/Eosin (H&E) staining to evaluate the muscle architecture 12 days post notexin-mediated injury of the muscle. Size bar 100 µm. Representative image of muscles analyzed from two WT and two TBP2_KO mice are presented. (B) Representative images of cross-sections of unperturbed and of notexin injured muscles were immunolabeled with anti-laminin B2 (green) and anti-Pax7 (red) antibodies. Nuclei were counterstained with DAPI (blue). Pax7-positive MuSCs (Muscle Stem cells - Satellite cells) in sub-laminar position are indicated by an arrow. Size bar 200 µm. (C) Quantification of Pax7-positive MuSCs residing in sub-laminar position in B. Muscles from two mice have been analyzed and for each point, three different areas of the muscle were taken into account. Error bars represent a standard deviation among biological replicates. Student’s t test was used for statistical analyses in C and E, n.s. - not significant. (D) MuSCs were isolated by FACS-assisted analysis as CD45-/CD31-/Ter119-/Sca1-/CD34+/alpha7intergrin+ from unperturbed and from notexin injured (12 days post injury) muscles. Isolated MuSCs were in vitro differentiated into myotubes, and immuno-labeled with anti-Myosin Heavy Chain (MHC) antibody (green) to monitor myotubes formation. The nuclei were counterstained with Hoechst 33,258 (blue). Images were taken by Olympus IX71 microscope with 10x objective. Representative images of differentiated MuSCs are presented. Size bar 50 µm. (E) Quantification of nuclei residing within MHC-positive differentiated MuSCs myotubes in D. Differentiation index is presented as% on nuclei within MHC-positive myotubes. Error bars represent a standard deviation between two independent MuSC isolations, each cultured and quantified in triplicate. Student’s t test was used for statistical analyses in C and E, n.s. - not significant.

