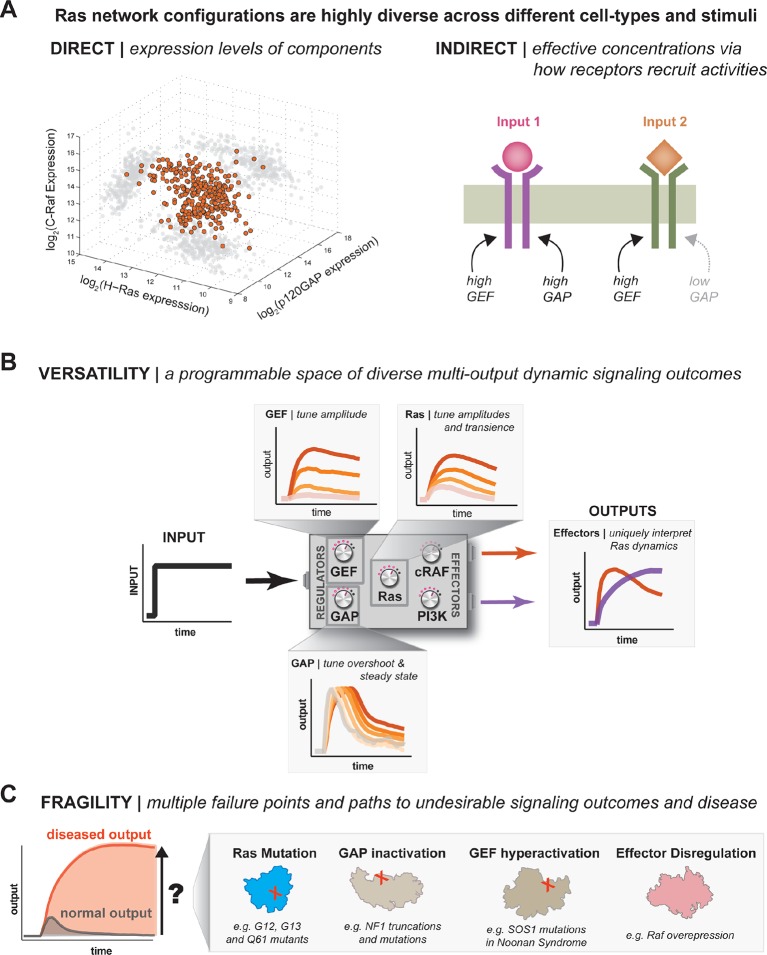
Figure 9. One system, many behaviors: versatility and fragility in the space of Ras GTPase signal processing behaviors.
(A) Illustration of direct and indirect diversity that exists in Ras network configurations. In the direct case, the distribution of p120GAP, H-Ras, and Raf gene expression levels across a variety of human cell types are shown, synthesized from Genevestigator data (see associated Figure 9–source data 1). Each orange point corresponds to a cell type and its position in the space indicates its associated expression level in each coordinate. A 'shadow' of each point is projected onto each two-dimensional sub-plane to further clarify the distribution. In the indirect case, a schematic of two receptors that both activate Ras are indicated. One receptor results in strong recruitment of both GEF and GAP, while another only strongly recruits GEF. (B) Illustration depicting the versatility of Ras GTPase signaling systems. A simple step-input can be processed into a variety of different dynamic outputs depending on 1416 the network configuration. The way in which each network component shapes signaling is illustrated. (C) Illustration depicting the fragility of Ras GTPase signaling systems. Given a particular signaling output and a higher level disease output, there exist many paths by which the network configuration can change to produce the diseased output. GAP, GTPase-activating protein; GEF, guanine exchange factor.
DOI: http://dx.doi.org/10.7554/eLife.12435.023

