

Abstract
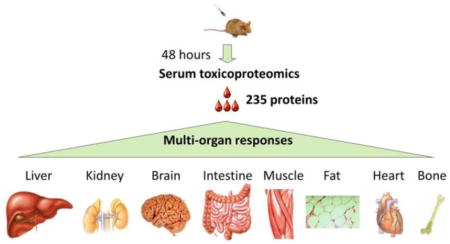
Blood is an ideal window for viewing our health and disease status. Because blood circulates throughout the entire body and carries secreted, shed, and excreted signature proteins from every organ and tissue type, it is thus possible to use the blood proteome to achieve a comprehensive assessment of multiple-organ physiology and pathology. To date, the blood proteome has been frequently examined for diseases of individual organs; studies on compound insults impacting multiple organs are, however, elusive. We believe that a characterization of peripheral blood for organ-specific proteins affords a powerful strategy to allow early detection, staging, and monitoring of diseases and their treatments at a whole-body level. In this paper we test this hypothesis by examining a mouse model of acetaminophen (APAP)-induced hepatic and extra-hepatic toxicity. We used a glycocapture-assisted global quantitative proteomics (gagQP) approach to study serum proteins and validated our results using Western blot. We discovered in mouse sera both hepatic and extra-hepatic organ-specific proteins. From our validation, it was determined that selected organ-specific proteins had changed their blood concentration during the course of toxicity development and recovery. Interestingly, the peak responding time of proteins specific to different organs varied in a time-course study. The collected molecular information shed light on a complex, dynamic, yet interweaving, multiorgan-enrolled APAP toxicity. The developed technique as well as the identified protein markers is translational to human studies. We hope our work can broaden the utility of blood proteomics in diagnosis and research of the whole-body response to pathogenic cues.
Keywords: toxicoproteomics, blood proteomics, glycopeptide capture, glycoprotein enrichment, N-glycosylation, biomarker, organ-specific proteins, xenobiotic toxicity, acetaminophen, drug toxicity, multiorgan responses
INTRODUCTION
The homeostasis of the human body is maintained through a coordinated network of discrete body parts.1 This coordination is manifested upon systems defined from functionally related organs and tissues, including the nervous, digestive, and endocrine systems. Pathology arising from one organ is likely to perturb the homeostasis of other organs and systems,2 contributing to secondary effects and resulting in disease complications as seen in the cases of obesity,3 diabetes,4 cancers,4 and drug toxicities.2,5 The majority of laboratory research and clinical practice has been focusing on assessing the functions of individual organs, and little attention has been focused on holistic organ-network responses.6
Our circulatory system collects cellular proteins secreted or released from all cells in our bodies including the intruded pathogens and resident parasites. Many of these molecules become paracrine signals delivered through the circulatory system to distant targets.1 Diseased organs likely secrete and/or excrete cellular proteins abnormally into the circulatory system, which can perturb the homeostasis of other organs. Because of the non-invasiveness, blood is an ideal window for us to reveal coordinated organ responses comprehensively. Using organ/tissue signature proteins found in blood as markers, we should be able to delineate the tissue/organ origin of the pathology and to diagnose, monitor the progression, and assess the treatment outcome of complex diseases at a multiorgan level.7,8
Given the fact that blood has been frequently examined for biomarkers of a particular malfunctioning organ, using blood as a source for multiorgan responses is still, however, elusive. Recently, interests in pharmacogenomics have emerged to use nucleic acids from blood cells as surrogate markers in identifying changes in targeted organ(s) including concomitant changes from multiple organs during pharmacoresponses.6,9–14 Nevertheless, little is known of using blood proteins to address multiorgan responses.15 We feel that organ-specific blood-protein fingerprints afford an addressable, sensitive, and standardizable platform for studying whole-body pathologic responses. To prove the concept, we decided to examine the mouse serum proteome for multiorgan responses to a toxic dose of acetaminophen (APAP).
Identification and quantification of blood organ-specific proteins are analytically challenging. In our opinion, three main reasons exist for identifying blood organ-specific proteins: (1) low concentration, as the relatively large volume of blood will dilute the leaked or secreted organ proteins instantly; (2) low number of candidates, because a limited number of organ-specific proteins are available; and (3) low occurrence, as pathologically meaningful organ-specific proteins will appear in blood temporally. There are another two well-known technical reasons rendering the detecting and tracing these proteins in blood more challenging: (1) proteins are not amplifiable as nucleic acids; and (2) blood proteins embrace a large dynamic range: the typical concentration of known blood organ-specific proteins are in ng/mL to pg/mL (e.g., PSA,16 troponin,17 and ALT18) as opposed to that of abundant blood proteins such as albumin (mg/mL).19,20 Dominant blood proteins will mask the detection of low-abundance ones. To date in clinics, targeted analyses are performed to minimize masking effect and to quantify organ signature proteins selectively by using immunological or enzymatic assays.8 Nevertheless, not all organ-specific proteins have high quality antibodies or enzymatic assays to be detected in blood, and few of these assays, if they exist, can be multiplexed and examined simultaneously8 for a multiorgan assessment. Therefore, there is a strong demand to develop high-throughput and sensitive assays to identify organ-specific proteins in blood for a whole-body evaluation of disease and health status.
Blood shotgun proteomics, employing biochemistry as well as liquid chromatography and mass spectrometry (LC–MS) to study blood proteins, offers several advantages over immunological and enzymatic assays.19 First, it is a high-throughput approach that is able to analyze many proteins at once. Second, no expensive and difficult procurement of high quality antibody reagents is required.8 Third, once suitable biomarker candidates are identified, follow-up tests that are targeted and high-throughput (such as the multiple-reaction-monitoring strategy, MRM) are possible to verify up to hundreds of proteins’ quantities in blood in hours.7,21,22
Because of the complexity and large dynamic range of serum proteins, enrichment or depletion strategies have been developed to facilitate LC–MS analyses.23,24 The commonly practiced removal of abundant blood proteins often includes a depletion of albumin and/or other blood proteins such as immunoglobulins.24 Because most tissue-secreted and shed proteins in blood contain N-linked glycans (carbohydrates attached to the asparginyl residues of proteins) but not albumin, enriching N-glycoproteins will also decrease blood-protein dynamics.23,25–27 A further segregation of the N-glycosylated peptides from the rest of glycoproteins (e.g., glycopeptide capture28) will further reduce the sample complexity, which can ease the identification and quantification of interesting blood proteins by MS. As proof, we examine here the use of an integrated albumin depletion and glycopeptide-capture approach to profile serum proteins in search of organ-specific molecular signatures for diagnoses of insults led by overdosing APAP.
Toxicity arising from unknown off-target effects is the leading cause for drugs to to be withdrawn from the discovery phase or the market.29 Every year in the U.S., more than 100,000 deaths are linked to drug toxicity.30 APAP, as the most widely used over the counter drug, is responsible for the majority of pharmaceutical liver poisoning in the United States.31 Over-dosing APAP is known to exert hepatotoxicity, but extra-hepatic effects have also been reported from both human cases as well as animal models.32 Based on clinical records, fulminant APAP toxicity can lead to multiorgan failure and mortality.33
In rodents, APAP extra-hepatic damage was observed in the kidney, brain, muscle, heart, and pancreas according to the intake of radio-labeled drugs34,35 and the whole-body histopathological examination.5,36,37 These approaches obviously cannot be applied to human studies. In clinics, noninvasive assays used to assess organ damage caused by overdosing APAP include the transaminases ALT and AST (also known as SGPT and SGOT) tests for the liver and the BUN (blood urea nitrogen) and creatinine tests for the kidney. None of these assays, however, possess the necessary organ specificity38 and the necessary compatibility to be measured simultaneously. For instance, both ALT and AST tests use blood; however, two separate enzymatic assays are needed to obtain their blood concentration. Whole-body imaging, e.g., CT scan, is technically applicable in a hospital setting for diagnoses of multiorgan drug toxicity yet has seldom been applied to humans due to the inevitable radiation hazard39,40 and the lack of necessary sensitivity for presymptomatic detection.
The blood proteome has been examined in the context of APAP liver intoxication;41–43 however, few blood proteomic studies have addressed extra-hepatic drug responses. Here we revisit the APAP serum toxicoproteome and applied gagQP approach on a mouse model with an intention to assess the multiorgan involvement during a xenobiotic attack. All of our data will be available in PeptideAtlas,44 a publically accessible database for proteomics research. On the basis of the transcriptome-defined organ specificity of gene products, we discover from our results a number of organ-specific proteins with aberrant quantities in blood, whose primary residency is in the liver, brain, heart, muscle, kidney, small intestine, or bone marrow. Together with other tissue proteins detected in blood, we reveal complex multiorgan responses to APAP poisoning. A follow-up Western validation of selected proteins in serum from a time-course study uncovered varied peak-time responses of different organs. The capability to profile blood proteins and to quantify their changes during the progression of drug toxicity should help illuminate the underlying pathophysiology and guide the development of more effective toxicity assessments and therapies. Even though not directly related, the discovered molecular changes herein may also contribute to our under-standing of idiosyncratic toxicity that has been observed from APAP poisoning but lacking the necessary comprehension.15,45
MATERIALS AND METHODS
The Bradford assay reagent, sodium periodate, and hydrazide resin were obtained from Bio-Rad. Endoglycosidase PNGase F was purchased from New England Biolabs. Cell culture reagents came from Invitrogen. Tris(2-carboxyethyl)phosphine (TCEP) was from Pierce and sequence-grade trypsin was from Promega. Rapigest and Sep-Pak C18 columns were from Waters and C18 Zip tips were from Millipore. Heavy and light isotope-doped N-Isotags were purchased from Cambridge Isotope and Sigma, respectively. All other chemicals were purchased from Fisher Scientific.
Animal Treatment
Nine-week-old male C57BL/6 mice (Jackson Lab, ME) were fasted 24 h prior to the treatment. For each batch, 12–24 mice were administered with either 300 mg/kg of APAP in a phosphate-buffered saline (PBS) or with the vehicle control by an intraperitoneal (IP) injection based on a previous protocol.46 Blood and liver tissues were collected post the injection over a period of 196 h. Alanine transaminase (Alt) levels in sera were determined by an enzymatic assay (TECO Diagnostics, Anaheim, CA), and liver histopathology analyses were also conducted to assess APAP liver toxicity. For proteomics analyses, each of five mice from control (“C”) and 48-h drugged (“A48”) groups were used to prepare the pooled sera samples. A 9-week C57BL/6 mouse was also euthanized and dissected to obtain organs for the verification of the organ-specific protein expression.
Proteomic Sample Processing
For global proteomic analysis, we used two batches of pooled sera (each of 50 μL) from both control and treated mice. A flowchart of sample processing is in Figure 1. First, albumin was removed from samples by murine albumin depletion columns (Qiagen, cat. no. 37591). The remaining proteins were quantified by Bradford. Prior to denaturation and digestion, proteins were precipitated by acetone to remove small metabolites. The proteolysis was conducted based on a previous method.28 Briefly, the protein pellet was reconstituted in a denaturing buffer (5-mM EDTA, 40-mM tris, 10-mM TCEP, and 0.5% rapigest at pH 8.3) and heated to 100 °C for 10 min. Solid urea was added into the solution to 8 M final concentration. Denatured proteins were alkylated by sodium iodoacetamide and digested by trypsin at 37 °C overnight. Rapigest in the denaturing buffer was then degraded at pH ~ 1 and 37 °C for 1 h. The rest of the sample was desalted on a Sep-Pak C18 column and dried in a SpeedVac (Thermo Savant, Holbrook, NY, USA) concentrator.
Figure 1.
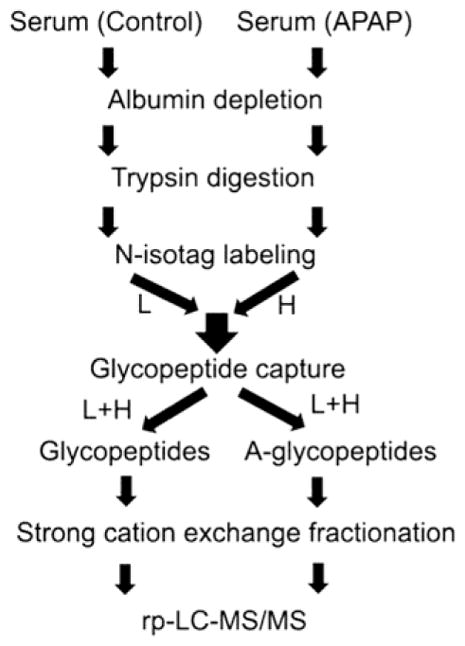
Illustration of the gagQP proteomic strategy.
The cleaned peptides were labeled by an N-isotag, i.e., t-Boc-leucine N-hydroxysuccinimide (NHS) ester (t-Boc-Leu-NHS), reacting with the primary amines on lysines and the N-termini of the peptides. The procedure was modified from a previous report.47 In a typical experiment, peptides in 0.5 M HEPES buffer at pH 8.0 reacted with 0.15 M N-isotag in dimethylformamide (DMF) introduced dropwise with constant stirring. The reaction was terminated after 40 min by 0.5 mL of concentrated HCl and 0.4 mL of 1 M tris (pH 8.0). The control and treated serum samples were labeled with light- and heavy-isotags, respectively. The two samples were then combined prior to desalting by a Sep-Pak C18 column. This labeling procedure was tested on a pure chicken avidin protein before being applied to serum samples.
After digestion and labeling, the peptide mixture was partitioned by the glycopeptide-capture method28 into N-glycopeptides (glycofraction) and non-glycopeptides (non-glycofraction). The non-glycofraction included peptides from both non-glycoproteins as well as glycoproteins. The glycocapture procedure was carried out by oxidizing the cis-diol groups on glycans with 10 mM sodium periodate at room temperature for 30 min. The additional periodate ions were quenched by 20 mM sodium sulphite at pH 5.5 for 10 min, and the oxidized glycopeptides were then reacted with hydrazide-functionalized resin at 37 °C overnight with an end-over-end rotation. The supernatant containing non-glycopeptides was isolated from the resin with glycopeptides attached by centrifugation. The resin was further washed by deionized water, 1.5 M NaCl, methanol, and 80% acetonitrile sequentially before the liberation of the covalently bound N-glycopeptides by PNGase F. The supernatant containing excised glycan-free N-glycopeptides was collected by centrifugation.
Both the non-glycopeptides and liberated glycopeptides were further fractionated by strong cation exchange (SCX) chromatography. A step salt gradient of 30, 60, 90, 120, 350, and 1000 mM KCl in 10-mM KH2PO4 and 5% acetonitrile (ACN), pH 3.0, was applied to both samples. All eluents including the flowthrough and washes of the SCX column were collected, desalted, and analyzed by LC–MS/MS. The detailed instrumentation and methodologies used in LC–MS/MS analyses are described in Supporting Information. Protein identification and quantification were achieved by employing the SEQUEST version 27 (revision 0, copyright 2003) search engine and the Trans-Proteomic Pipeline (TPP) bioinformatic software suit48 that are also detailed in Supporting Information.
Western Blot Validation
Western blot was used to confirm and validate proteomic results as well as proteins’ organ specificity. Sample loading was normalized by protein quantities, and the membrane carrying the separated and transferred proteins was stained by a GelCode blue safe protein staining solution (Thermo Scientific, Pierce Protein Biology product) prior to blocking. The antibodies that provided signals at the expected molecular weight are summarized in Supporting Information. We had removed blood albumin with Qiagen murine albumin depletion columns to expose Western signals for certain proteins.
RESULTS AND DISCUSSION
Mouse Model of APAP Toxicity
The liver response of the APAP-induced toxicity in a mouse model was examined by liver histopathology and blood alanine transaminase (Alt) test over a 196-h post-drug period (Figure 2). The onset of liver lesions and elevated blood Alt levels were observed after 3 h. The fulminant toxicity was reached between 24 and 48 h and was followed by a recovery period of another 24–48 h.
Figure 2.

Histopathological images of a mouse liver and the corresponding enzymatic activity of alanine transaminase (Alt) in the mouse serum as a function of time after an exposure to half-lethal dose of APAP.
Proteomics Strategy
We identified and quantified serum proteins from control and treated mice at 48 h post-APAP dosing. The analyses were carried out using the immunoaffinity depletion of albumin together with the glycopeptide capture-assisted global quantitative proteomics (gagQP) as outlined in Figure 1. In essence, the hydrazide chemistry28 was used to separate N-glycopeptides from the rest of the sample, and the N-glycans were further removed from peptides to ease their MS identification.49–51 What is different in gagQP compared to previous methods28 is that the non-glycopeptides in the supernatant of the capture mixture were saved and were subjected to a SCX separation prior to reverse-phase LC–MS analyses. This change allowed a full coverage of serum proteins. A new N-isotag (Figure 3) was employed here to label all of the peptides at both N-termini and lysines for quantitation.
Figure 3.
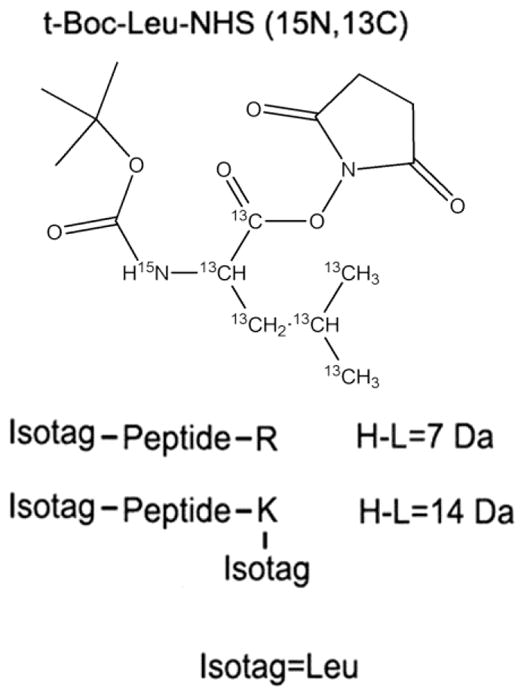
Chemical structure of the heavy formed (13C and 15N) N-isotag and its modification to double-tryptic-end peptides. R is arginine, and K is lysine.
Protein Identification
We detected 488 Entrez genes mapped to International Protein Index (IPI) entries (Supplementary Table S1) with a minimum protein probability of 0.9. In the table, proteins identified by the same set of peptides are listed as a single degenerated IPI entry, and only the first IPI of every entry is translated to Entrez gene symbols and IDs using PIPE (Protein Information and Property Explore),52 a web-based program for functional analyses of proteomic data. The N-glycopeptide selectivity is above 90%, which is the same as previously reported.28
Figure 4 is a Venn diagram showing the comparison between proteins identified from both the glyco- and non-glycofractions. In theory, the non-glycofraction should comprise all proteins including glycoproteins; thus, the glycofraction should be a subset of the non-glycofraction. However, observed in Figure 4 is an overlap relationship, with 67 proteins uniquely identified in the glycofraction. Most of these unique IDs are cell-surface proteins, such as surface receptors and adhesion molecules, with low abundance in sera (based on spectra counts as listed in Supplementary Table S1). This result indicates that the sensitivity of the glycocapture is better than regular blood proteomics in identifying glycoproteins. In the non-glycofraction, we discovered many cytosolic proteins in blood as shown in Figure 5.
Figure 4.
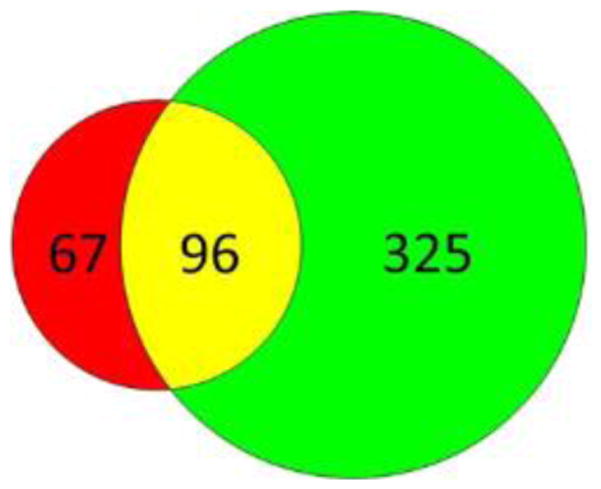
Venn diagram of proteins identified in the glyco- (red) and non-glycofraction (green) alone and in both fractions (yellow).
Figure 5.

Protein–protein interaction network (A) and the GO cellular localization (B and C) of the mouse serum proteome in response to APAP. The quantity changes in panel C were defined on the basis of a 2-fold cutoff.
In Figure 5A, we examined the protein interaction network of all of the identified blood proteins using Cytoscape,53 an open access platform for network analysis. In Figure 5B and C are displayed all of the identified proteins based on their cellular location and concentration changes in blood. The protein–protein interaction was obtained by super imposing the mouse proteins onto a human protein interaction network provided by Human Protein Reference Database (HPRD)54 through orthologous gene mapping. The size of nodes in Figure 5A and B represents the absolute quantity of the identified proteins that was obtained from spectra counting;52,53 whereas the color of the node indicates the relative quantity changes before and after APAP treatment. Of note, in general cytosolic proteins (triangle nodes) exhibited lower quantities in sera than normal blood proteins (circular nodes). Many orphan cellular proteins were also observed in Figure 5A without interacting partners, and the GO cellular localization analyses revealed that most of these proteins were cytosolic enzymes. Reorganizing the network by cellular location as shown in Figure 5B makes the quantity difference between intracellular proteins and secreted proteins more visible. A pie-chart display of GO localization analyses (Figure 5C) further details the protein distribution among increased, decreased, and no-change categories.
Comparing our results with other blood toxicoproteomes derived from APAP rodent models,41,42 we detected most of the previously reported proteins with many new additions. For example, 31 of the 38 proteins in the Merrick’s rodent sera data set42 are included in ours (Supplementary Table S1), but we also detected another 216 proteins with quantitative changes. The sensitivity alluded above likely arose from a better segregation of glycopeptides from the rest offered by the gagQP. The negative charge carried by most glycans interferes the ionization efficiency of the MS instrument; complex glycan structures and labile glycosidic bonds also create massive signals in MS that hamper the identification of peptides49–51 including both glyco- and non-glyco-peptides. Because glycosylation is the most prevalent and complex protein post-translational modification,55,56 the difficulty glycans pose to proteomics is ubiquitous to MS-centric analyses. Chemical and enzymatic reactions have been developed to remove saccharide moieties from peptides prior to MS identification,23,26 and our gagQP method offers another alternative, in which chemical segregation ensures a robust and complete separation of glycopepitdes from non-glycopeptides.
Quantitation
To obtain quantitative changes of blood proteins during the APAP attack, we employed an isotope-containing NHS-tag (N-isotag) specifically modifying the primary amines on lysine residues and peptide N-termini (Figure 3). The XPRESS57 software was used to compute peptide quantity ratios between the treated and control samples. A large mass shift of 7 Da between the heavy and light isotags permits facile isolation of signals from the labeled peptides generated from almost any MS instruments on the market at all possible charge states.
In addition, we preserved the original positive charge installed on lysines and N-termini of peptides by introducing a t-Boc-protected primary amine in the N-isotag (Figure 3). N-Isotags carry a NHS group that selectively reacts with primary amines on tryptic peptides.47 During this reaction, the positive charge on the primary amines under the acidic condition gets lost. Previously, the N-isotag itself was designed to be neutral, and thus after labeling, the net charge of tryptic peptides was decreased, which can impaire the ionization efficiency of labeled peptides and in turn decrease these peptides’ chances to be identified by MS. We re-installed the lost charge by introducing a primary amine in the tag. In order to prevent the tags’ reacting to each other through the amines they carry, we chose a tag with a t-Boc-protected amine, and the protecting group can be selectively removed after labeling. Therefore, the peptides labeled by our method will carry the same number of positive charges as those before labeling. The charge ensures better ionization efficiency and easier identification of our labeled peptides by MS than those labeled by previously reported ones.47 Before applying our N-isotag to mouse serum samples, we have tested the labeling efficiency of our tags by a pure protein, chicken avidin. The details of the testing and the results are included in the Supporting Information and Supplementary Figure S1. We further verified the completion of the labeling by searching the nonlabeled peptides in our MS data. Only random hits were obtained with no valid identification. Therefore, our labeling was complete.
Among the 488 identified Entrez genes, more than 200 of them showed at least 2-fold changes in APAP-treated animals versus controls as shown in Supplementary Table S1. Using Western blot, we tested 18 proteins and validated all three types of quantity variations (i.e., up, down, and no change) in sera as shown in Figure 6, and the loading control was a staining of the total protein on the membrane (Figure 6A). The shielding effect of albumin to other proteins in the Western blot was observed, and an affinity removal of albumin was able to recover the Western blot signal of the targeted protein as shown in Figure 6C. The depletion of serum albumin was demonstrated to be reproducible as shown in Figure 8A. Not all antibodies were able to provide detectable signal in blood; the antibodies approved in our experiments are summarized in Supplementary Table S2.
Figure 6.
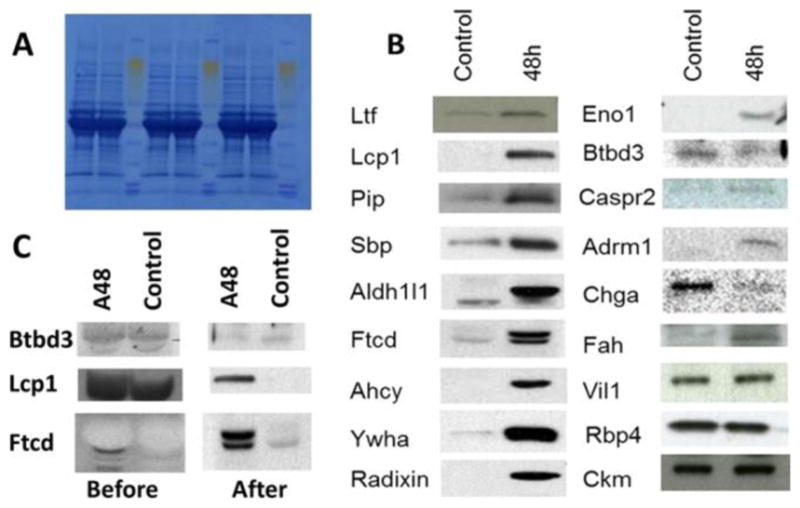
Western blot confirmation of protein concentration changes in sera of control and 48 h post-APAP-treated mice. (A) Staining of the total proteins on the PVDF membrane. (B) Signal bands of target proteins. (C) Western results before and after the removal of serum albumin.
Figure 8.
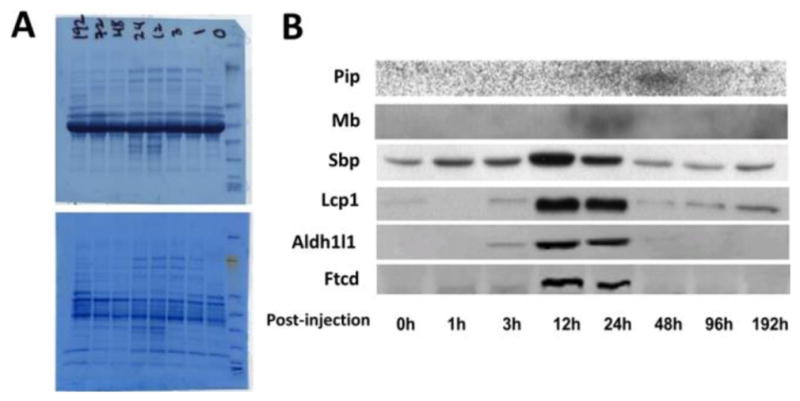
Western validation of the selected protein markers in a time course study after administration of half lethal dose of APAP. (A) Staining of the total proteins on PVDF membrane before (top) and after (bottom) removal of the serum albumin. (B) Signal bands obtained from target proteins.
To assess the global accuracy and precision of the MS quantitation, we further initiated two whole-data set comparisons. One approach was to compare, when possible, protein quantities separately obtained from the glyco- and non-glycofractions. This evaluates the precision of the analyses. The other approach compared the XPRESS ratios with those obtained from the spectra counting, which evaluates the accuracy of the analyses. The details and results of these two comparisons are described in the Supporting Information. In summary, we observed good agreements from both evaluations (Supplementary Figures S2 and S3).
Organ-Specific Proteins for Hepatic and Extra-hepatic Responses
Drugs in blood are exposed to the entire body, which can exert adverse effects to more than one organ and tissue type. Assessing the onset and progression of the corresponding organ toxicity is the priority for appropriate treatments and further toxicology studies. Overdosing APAP can affect the liver as well as other organs, as previously studied.5,34–36 We hypothesize that the capability to monitor changes of blood organ-specific proteins will facilitate the delineation of the multiorgan enrollment during APAP toxicity. Using transcriptomic data in conjunction with Western blot, we examined the tissue origin of proteins with aberrant blood quantities in APAP toxicity. The results suggested that 17 proteins were mainly produced by the liver, whereas another 7 were dominantly expressed in extra-hepatic organs: the brain, heart, muscle, kidney, small intestine, and bone marrow (Table 1). We selectively confirmed 10 proteins’ (including all 7 extra-hepatic proteins) blood concentration and their organ specificity by Western blot as shown in Figure 7.
Table 1.
Organ Enriched Proteins Identified with Perturbed Concentration in Mouse Sera by gagQP 48 h Post-exposure to Half Lethal Dose of APAP
| tissue | gene symbol | XPRESS protein ratio |
|---|---|---|
| liver | Cps1a | 2.4 |
| Asla | 4.3 | |
| Cata | 4.4 | |
| Gpt (Alt, SGPT)a | 3.2 | |
| Got1 (Ast, SGOT)a | 4.8 | |
| Glud1a | 2.4 | |
| Gnmta | 4.7 | |
| Faha,b | 5.6 | |
| Mat1aa | 4.1 | |
| Ahcya,b | 3.8 | |
| Aldh1l1a,b | 3.1 | |
| Ass1a | 3.0 | |
| Ftcda,b | 4.0 | |
| Aldob | 7.4 | |
| Hpd | 2.9 | |
| Bhmt | 6.4 | |
| Hgd | 2.8 | |
| bone marrow | Lcp1a,b | 3.1 |
| Pipa,b | 15.7 | |
| fat | Me1 | 2.5 |
| Adipoq | 3.6 | |
| kidney | Selenbp (Sbp)a,b | 3.5 |
| Mdh1 | 3.2 | |
| Sardh | 1.6 | |
| Umod | 7.1 | |
| intestine | Fabp1 | 8.5 |
| Lcp 1a,b | 3.1 | |
| heart | Ltfa,b | 2.0 |
| muscle | Mba,b | 0.1 |
| Pkn1 | 8.0 | |
| brain | Cntnap2 (Caspr2)a,b | 3.0 |
| Chgaa,b | 12.3 | |
| Hspa2 | 0.2 |
Figure 7.
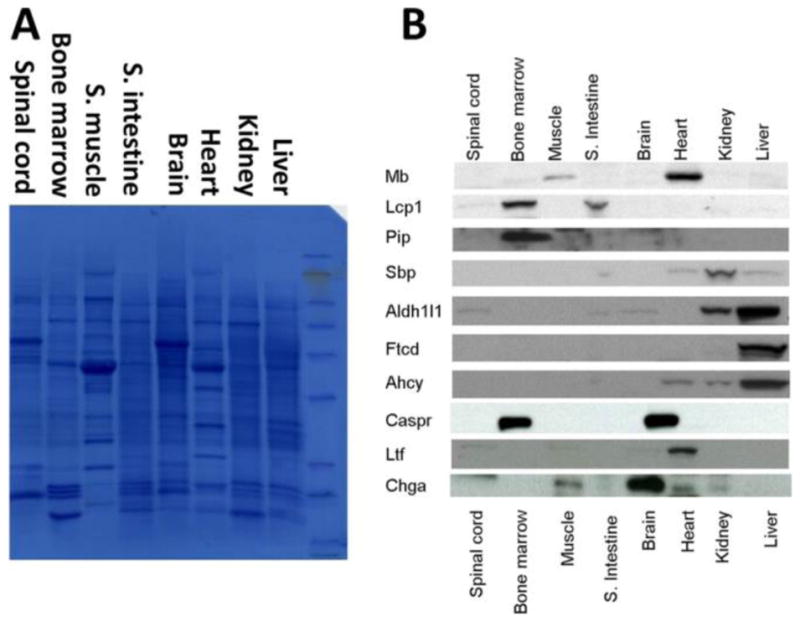
Western blot organ specificity validation of the selected protein markers in mouse. (A) Staining of the total proteins on the PVDF membrane. (B) Signal bands of target proteins.
Time-Course Validation of Observed Hepatic and Extra-hepatic Blood Markers
Besides confirming blood protein changes at fulminant toxicity, we further measured the possibility of using the selected proteins to monitor the toxicity progression in sera. We designed a time-course study, in which sera were collected from animals after 0–192 h of APAP dosing. Western blot examination of the selected organ-specific proteins in blood was performed, and the results are shown in Figure 8. In the figure, all of the proteins changed in similar trends, which matched the result of serum Alt assay and the liver histological analyses as shown in Figure 2. This consistency verified that the observed changes of selected proteins were indeed raised from APAP overdosing.
APAP multiorgan toxicity has been well studied in animal models;34–37 however, our time course experiment is the first dynamic study of toxicity progression on multiple organs simultaneously. From Figure 8, we revealed a sequential multiorgan response, in which three liver proteins (i.e., Ftcd, Aldh1l1, and Ahcy) exhibited tightly synchronized quantity changes started at the 3 h time point, whereas the kidney protein responded within the first hour, and the bone marrow protein responded much later at 48 h. A delayed kidney response to APAP liver toxicity had been reported in hospitalized patients with APAP overdosing.58 In that study, however, all of the patients had received medical interventions for liver toxicity prior to the monitoring of their renal damage. Those observed dynamics of organ responses, therefore, were more complex than our animal model and cannot truly represent the natural course of toxicity development. On the contrary, our dynamic studies of multiorgan responses are based on an in-bred mouse model, which provides a much better control of studying subjects and ensures flexible and versatile bioanalyses.
Our findings from both MS proteomics and Western blot validation of the compound multiorgan responses have been consistent with the current understanding of APAP toxicity.5,36,37 Besides hepatotoxicity, prior studies have indicated the renal damage in APAP affected humans59 as well as animals.60,61 What was also reported was the degenerative and necrotic changes of lymphoid nodes in APAP treated mice.62 More prevalent effects have been observed by monitoring APAP-protein adducts34,37 and the uptake of radioactive iodine-131-labeled APAP35 in mouse tissues and organs, such as the kidney, lung, pancreas, heart, skeletal muscle, stomach, and certain regions of the brain. Our proteomic observation matches well with these reports. Interestingly, in our animal model, except for the liver, other organs did not show noticeable damage in histopathological analyses, which suggests that the sensitivity of our serum proteomics holds the potential for presymptomatic diagnoses in addition to its noninvasiveness and multiplexibility.
To verify in part the translational potential, we selectively examined the human organ specificity of identified proteins, because organ specificity has been lacking in toxicity markers currently available in clinics.8 For example, ALT, the best widely used liver function marker, is also elevated during skeletal muscle injury.38 Supplementary Figure S5 summarizes the Western results of the identified proteins in 15 human organs. Three proteins (i.e., FTCD, ALDH1L1, and CPS1) showed liver specificities that are better than that of ALT. Therefore, the organ-specific protein studies conducted in mouse can possibly facilitate human studies.
We envisage that in the near future blood-based organ-specific toxicity diagnoses can be expanded by developing more than 10 sensitive and targeted proteomic assays for each of the 6–10 human organs such as the liver, kidney, heart, muscle, brain, lung, and intestine that are experiencing the most frequent drug damage. These assays can be used on new (and even old) drugs. We are also optimistic that the sensitivity of these assays can reach ca. mid-attomole with a dynamic range of ~105.
APAP Toxicology
Besides biomarker discovery, we are interested in whether the serum toxicoproteome can provide insights to APAP toxicology. Using DAVID, a web-based functional protein annotation tool,63 we catalogued the GO cellular component of 235 proteins identified with more than 2-fold quantity changes. Among the proteins analyzed, 103 (43.8%) of them were resolved as intracellular proteins spanning the entire cellular space as listed in Table 2. Of these tissue proteins, mitochondria proteins (34 proteins) were dominant and occupied about one-third of the total identified cytosolic proteins. Mitochondria permeability transition is a hallmark of tissue necrosis, which is known to cause APAP hepatotoxicity and nephrotoxicity.64–66 Inside a cell, mitochondrial permeability transition causes the release of their proteins into the cytosol. Our observation of increased mitochondrial proteins in blood indicated that cytosolic proteins can be further released into the body fluids under necrotic conditions.
Table 2.
Selected Gene Ontology Cellular Component Annotation of Differentially Identified Proteins in Mouse Serum
| Gene Ontology cellular component | gene number | Entrez gene symbol |
|---|---|---|
| mitochondria | 34 | Acly Acat3 Acaa2 Adh1 Aldh1l2 Ass1 Cps1 Car5b Cat Dhodh Dci Fth1 Fh1 Glud1 Got2 Gpx1 Hspa2 Hsp90ab1 Slc25a38 Idh1 Lap3Mthfd1 Ldha Aldh1l1 Adh5 Ywhaz Nme2Mdh1 Cycs Me1 Acsbg2 Cyb5 N me1 Ctsa |
| cytosol | 31 | Sec14l2 Dpyd Hsp90aa1 Selenbp1 Selenbp2 Ahcy Got1 Ephx2 Idh1 Ldha Psmd12 Psma1 Psma3 Psma4 Psmb1 Psmb2 Psmb6 Psmb7 Lcp1 Eno1 Eea1 Sra1 Aldob Mdh1Me1 Cycs Acsbg2 Vcp Hspa8 Xdh Apom |
| cytoskeleton | 15 | Fgd6 Actbl2 Actg2 Avil Eml1 Krt18 Actg1 Scin Vcl Rdx Lcp1 Tubgcp5 Lmna Nme1 Pcm1 |
| endoplasmic reticulum | 13 | Otof Hpd Ces3 Hspa5 Ptgds Mbl2 Adipoq P4hb Vcp Cyp1b1 Piga Cyb5 Vwf |
| proteasome | 12 | Psmd12 Psma1 Psma3 Psma4 Psmb1 Psmb2 Psmb6 Psmb7 Adrm1 Psmb5 Psma6 Psmb4 |
| nucleus | 8 | Sra1 Ints3 Nup188 Nup93 Hist1h2bf Raly Ptgds Lmna |
| golgi apparatus | 5 | Ftcd 6330417G02Rik Hpd Mbl2 Ptgds |
| lysosome | 5 | Aldob Gaa Ggh Lamp2 Ctsa |
| peroxisome complex | 3 | Ephx2 Cat Xdh |
In the meantime, we also discovered many cellular enzymes in blood, which should be functioning in various cellular metabolic, catabolic, and oxidation–reduction processes under physiological conditions. These enzymes include cytosolic enzymes (e.g., Ast), lysosomal peptidase (e.g., cathepsin A (Ctsa)), Golgi enzymes (e.g., formiminotransferase cyclodeaminase (Ftcd), and 4-hydroxyphenylpyruvate dioxygenase (Hpd)), and peroxisome enzymes (catalase (Cat) and xanthine dehydrogenase (Xdh)). Many of these proteins such as Ast and Cat have been known to be released into blood and are used as liver function markers. In addition, these enzymes once released from their cellular compartments can create stresses inside cells, such as Xdh functioning in the production of reactive oxygen species67 and Cat and Hpd catalyzing oxidative processes. The observation of a large amount of these active proteins in blood indicates the potential attack these proteins mounted through blood circulation to other organs. Besides enzymes, based on previous report other cellular proteins that are found in our blood toxicoproteome such as actins, the highly polymerizable cytoskeleton proteins, can also trigger toxic effects to other cells.68 Thus, our serum toxicoproteome provides molecular information that not only indicates the responding organs but also can hint on the potential causality of the observed toxicity.
Current knowledge on the cause of extra-hepatic tissue damage is debatable. The dominant opinion believes the toxic APAP metabolites can be raised locally by the resident cytochrome P450 in different organs and tissues to cause damage.36 However, an alternative explanation suggested that hepatoxicity-triggered distant injury can be raised through transportation,69 in which the spreading of toxic APAP metabolites through blood was accused as the cause of damage because extra-hepatic damage had been observed from tissues with genetically abolished residential cytochrome P450 activity. Besides toxic metabolites, other potential toxins that fit the transportation mechanism are the circulating cellular enzymes in blood released during toxic injury, which had been proposed in a study of circulating lysosomal enzymes in the acute hepatic necrosis.70 Our results emphasize that many circulating cellular proteins exist in blood in the course of toxicity, which are not limited to lysosomal enzymes but also enzymes in many other organelles as well as polymerizable cytoskeleton proteins. It is important therefore to consider the damage raised by these proteins to organs after the initial toxic insult.
Early Recovery
Another interesting discovery of our blood toxicoproteome is a large number of elevated proteasome proteins as listed in Table 2. Circulating proteasomes originated differently from blood cells are known to present in active form during immune response in patients with chronic inflammatory diseases.71 We hypothesize that our discovery of elevated proteasomes in blood during massive tissue necrosis may indicate an immunologically related self-recovery process in which the existence of proteasomes may function as a scavenging machinery to remove excessive tissue proteins in blood.
Early recovery was also observed from the enriched tissue-remodeling and wound-repairing pathways in our data analyzed by Genego, a commercial software for genomic analysis (Supplementary Figure S4). In the result, the increased extracellular matrix protein 1 (Ecm1) can stimulate the proliferation of endothelial cells and promote angiogenesis. The elevated hevin protein, also called proliferation inducing protein 33, regulates collagen fibrillogenesis to assist tissue development.72,73 Also up-regulated proteins include polymeric immunoglobulin receptor (Pigr) and alpha fetoprotein. Pigr is known to locate on the basolateral surface of grandular epithelial cells in helping the secretion of polymeric immunoglobulin A for defense,74 and alpha fetoprotein is a well-known marker of liver regeneration after a necrotic injury.75,76 Fibrinogen, a blood coagulation protein, was also present in our results with increased concentration, a response that may be from the hemorrhage observed in APAP toxicity.
In contrast to increased concentration, many normal blood proteins showed a drastic drop of quantity in APAP toxicity. Proteins with a more than 2-fold decrease in blood quantity include but are not limited to those of the complement system, immunoglobulins family, and acute reactive proteins (Supplementary Table S1). The observed decrease of acute reactive proteins, such as serum amyloid protein A1 and A2 (Saa1 and Saa2) and orosomucoid 2 (Orm2), was opposed to the reported increase of their functions during APAP toxicity.41,42 We reason that such discrepancy may likely be a consequence of severe liver damage in our mouse model, because impaired liver tissue will lose its function of protein synthesis temporarily, and most abundant blood proteins as well as acute reactive proteins are expressed in the liver. Our observation of the drop of acute reactive proteins is not alone. A temporary drop of similar proteins had been reported previously in rat blood due to a severe APAP intoxication.77 In our case, the presence of proteasome proteins in blood as discussed above may also facilitate the degradation of all blood proteins including the acute reactive proteins. Thus, the drop of these proteins in our data maybe a temporary outcome of the overall results from the severe liver damage, the emerging liver recovery, and the elevated proteasome scavenging.
Collectively, we observed a wide spectrum of intriguing protein changes in the mouse serum toxicoproteome. These changes dictated drug-perturbed molecular networks at tissue and organ levels, which provide mechanistic insights with spatial and temporal resolution of the toxicity development at a scale of entire body. This holistic image indicates a complex, dynamic, yet interweaving relationship among different organs and tissues at different toxicity developmental stages. The emerged hypotheses can shed light in part to the under-standing, diagnosis, and treatment of multiorgan collateral effects exerted by drug toxicity.
CONCLUSIONS
We used a gagQP proteomics strategy, in which a previously developed glycocapture method was integrated with an N-isotag quantitation method to characterize global protein changes in mouse sera after the administration of a toxic dose of APAP. The obtained data set provides us a list of biomarkers that have been validated in mouse to be able to diagnose and stage multiorgan APAP toxicity in a sensitive and comprehensive fashion. In the meantime, our data set also provides molecular insights for studies of etiology, pathophysiology, prediction, and prevention of drug intoxication to name a few.
We believe that each disease is a consequence of a “network of networks”. Biology and disease have been reflected in a hierarchical and integrated series of networks: genetic networks, molecular networks, cellular networks, organ networks, and the networks of organisms (social networks). All of these networks ultimately must be analyzed to assess environmental as well as genetic contributions to a disease process. In this paper we describe for the first time a global technique that permits disease-perturbed organ networks to be studied holistically. This is an important contribution to the strategies of a systems approach to diseases.
Supplementary Material
Acknowledgments
We are sincerely grateful for computational support from the TPP group (Zhi Sun, David Shteynberg, Luis Mendoza, David S. Campbell) and instrumentation support from the staff (Min Yuan and Patrick Flores) working in the Proteomics facility at the Institute for Systems Biology, Seattle, WA. The study is sponsored by DOD grants of W911SR-06-C-0057 and W911SR-07-C-0101 and NIH P50 GM076547 (Proteomic Core) and RC2 HG005805.
Footnotes
The authors declare no competing financial interest.
References
- 1.Tortora GJ, Derrickson BH. Principles of Anatomy and Physiology. 12. John Wiley & Sons, Inc; New York: 2008. [Google Scholar]
- 2.Cohen GM. Target Organ Toxicity. CRC Press; Boca Raton, FL: 1986. [Google Scholar]
- 3.Dobrin R, Zhu J, Molony C, Argman C, Parrish ML, Carlson S, Allan MF, Pomp D, Schadt EE. Multi-tissue coexpression networks reveal unexpected subnetworks associated with disease. Genome Biol. 2009;10(5):R55. doi: 10.1186/gb-2009-10-5-r55. [DOI] [PMC free article] [PubMed] [Google Scholar]
- 4.Fawcett T, Watson R. Pathophysiology, Homeostasis and Nursing. Routledge; London: 2003. [Google Scholar]
- 5.Placke ME, Wyand DS, Cohen SD. Extrahepatic lesions induced by acetaminophen in the mouse. Toxicol Pathol. 1987;15(4):381–387. doi: 10.1177/019262338701500401. [DOI] [PubMed] [Google Scholar]
- 6.Dadarkar SS, Fonseca LC, Mishra PB, Lobo AS, Doshi LS, Dagia NM, Rangasamy AK, Padigaru M. Phenotypic and genotypic assessment of concomitant drug-induced toxic effects in liver, kidney and blood. J Appl Toxicol. 2011;31(2):117–130. doi: 10.1002/jat.1562. [DOI] [PubMed] [Google Scholar]
- 7.Qin S, Zhou Y, Lok AS, Tsodikov A, Yan X, Gray L, Yuan M, Galas D, Omenn G, Hood L. SRM targeted proteomics in search for biomarkers of HCV-induced progression of fibrosis to cirrhosis in HALT-C patients. Proteomics. 2012;12(8):1244–1252. doi: 10.1002/pmic.201100601. [DOI] [PMC free article] [PubMed] [Google Scholar]
- 8.Ozer J, Ratner M, Shaw M, Bailey W, Schomaker S. The current state of serum biomarkers of hepatotoxicity. Toxicology. 2008;245(3):194–205. doi: 10.1016/j.tox.2007.11.021. [DOI] [PubMed] [Google Scholar]
- 9.Burczynski ME, Dorner AJ. Trascriptional profiling of peripheral blood cells in clinical pharmacogenomic studies. Pharmacogenomics. 2006;7:187–202. doi: 10.2217/14622416.7.2.187. [DOI] [PubMed] [Google Scholar]
- 10.Lavallie ER, Dorner AJ, Burczynski ME. Use of ex vivo systems for biomarker discovery. Curr Opin Pharmacol. 2008;8:647–653. doi: 10.1016/j.coph.2008.08.003. [DOI] [PubMed] [Google Scholar]
- 11.Lobenhofer EK, Auman JT, Blackshear PE, Boorman GA, Bushel PR, Cunningham ML, Fostel JM, Gerrish K, Heinloth AN, Irwin RD, Malarkey ER, Merrick BA, Sieber SO, Tucker CJ, Ward SM, Wilson RE, Hurban P, Tennant RW, Paules RS. Gene expression response in target organ and whole blood varies as a function of target organ injury phenotype. Genome Biol. 2008;9:R100. doi: 10.1186/gb-2008-9-6-r100. [DOI] [PMC free article] [PubMed] [Google Scholar]
- 12.Mendrick DL. Genomic and genetic biomarkers of toxicity. Toxicology. 2008;245:175–181. doi: 10.1016/j.tox.2007.11.013. [DOI] [PubMed] [Google Scholar]
- 13.Mohr S, Liew CC. The peripheral-blood transcriptome: new insights into disease and risk assessment. Trends Mol Med. 2007;13:422–432. doi: 10.1016/j.molmed.2007.08.003. [DOI] [PubMed] [Google Scholar]
- 14.Umbright C, Sellamuthu R, Li S, Kashon M, Luster M, Joseph P. Blood gene expression markers to detect and distinguish target organ toxicity. Mol Cell Biochem. 2010;335:223–234. doi: 10.1007/s11010-009-0272-5. [DOI] [PubMed] [Google Scholar]
- 15.Merrick BA. The plasma proteome, adductome and idiosyncratic toxicity in toxicoproteomics research. Briefings Funct Genomics Proteomics. 2008;7(1):35–49. doi: 10.1093/bfgp/eln004. [DOI] [PMC free article] [PubMed] [Google Scholar]
- 16.Kuriyama M, Wang MC, Papsidero LD, Killian CS, Shimano T, Valenzuela L, Nishiura T, Murphy GP, Chu TM. Quantitation of prostate-specific antigen in serum by a sensitive enzyme immunoassay. Cancer Res. 1980;40:4568–4662. [PubMed] [Google Scholar]
- 17.Hallen J. Troponin for the estimation of infarct size: what have we learned? Cardiology. 2012;121(3):204–212. doi: 10.1159/000337113. [DOI] [PubMed] [Google Scholar]
- 18.Burke MD. Hepatic function tests. Geriatrics. 1974;29:75–80. [PubMed] [Google Scholar]
- 19.Anderson NL, Anderson NG, Pearson TW, Borchers CH, Paulovich AG, Patterson SD, Gillette M, Aebersold R, Carr SA. A human proteome detection and quantitation project. Mol Cell Proteomics. 2009;8:883–886. doi: 10.1074/mcp.R800015-MCP200. [DOI] [PMC free article] [PubMed] [Google Scholar]
- 20.Anderson NL. The human plasma proteome: History, character, and diagnostic prospects. Mol Cell Proteomics. 2002;1(11):845–867. doi: 10.1074/mcp.r200007-mcp200. [DOI] [PubMed] [Google Scholar]
- 21.Anderson L, Hunter CL. Quantitative mass spectrometric multiple reaction monitoring assays for major plasma proteins. Mol Cell Proteomics. 2006;5:573–588. doi: 10.1074/mcp.M500331-MCP200. [DOI] [PubMed] [Google Scholar]
- 22.Meng Z, Veenstra TD. Targeted mass spectrometry approaches for protein biomarker verification. J Proteomics. 2011;74(12):2650–2659. doi: 10.1016/j.jprot.2011.04.011. [DOI] [PubMed] [Google Scholar]
- 23.Pan S, Chen R, Aebersold R, Brentnall TA. Mass spectrometry based glycoproteomics–from a proteomics perspective. Mol Cell Proteomics. 2011;10(1):R110 003251. doi: 10.1074/mcp.R110.003251. [DOI] [PMC free article] [PubMed] [Google Scholar]
- 24.Hanash SM, Pitteri SJ, Faca VM. Mining the plasma proteome for cancer biomarkers. Nature. 2008;452(7187):571–579. doi: 10.1038/nature06916. [DOI] [PubMed] [Google Scholar]
- 25.Anderson NL, Anderson NG, Haines LR, Hardie DB, Olafson RW, Pearson TW. Mass spectrometric quantification of peptides and proteins using stable isotope standards and capture by anti-peptide antibodies (SISCAPA) J Proteome Res. 2004;3:235–244. doi: 10.1021/pr034086h. [DOI] [PubMed] [Google Scholar]
- 26.Bond MR, Kohler JJ. Chemical methods for glycoprotein discovery. Curr Opin Chem Biol. 2007;11(1):52–58. doi: 10.1016/j.cbpa.2006.11.032. [DOI] [PubMed] [Google Scholar]
- 27.Whiteaker JR, Zhao L, Anderson L, Paulovich AG. An automated and multiplexed method for high throughput peptide immunoaffinity enrichment and multiple reaction monitoring mass spectrometry-based quantification of protein biomarkers. Mol Cell Proteomics. 2010;9:184–196. doi: 10.1074/mcp.M900254-MCP200. [DOI] [PMC free article] [PubMed] [Google Scholar]
- 28.Sun B, Ranish JA, Utleg AG, White JT, Yan X, Lin B, Hood L. shotgun glycopeptide capture approach coupled with mass spectrometry for comprehensive glycoproteomics. Mol Cel Proteomics. 2007;6:141–149. doi: 10.1074/mcp.T600046-MCP200. [DOI] [PubMed] [Google Scholar]
- 29.Lasser KE, Allen PD, Woolhandler SJ, Himmelstein DU, Wolfe SM, Bor DH. Timing of new black box warnings and withdrawals for prescription medications. J Am Med Assoc. 2002;287:2215–2220. doi: 10.1001/jama.287.17.2215. [DOI] [PubMed] [Google Scholar]
- 30.Xu JJ, Hendriks BS, Zhao J, de Graaf D. Multiple effects of acetaminophen and p38 inhibitors: towards pathway toxicology. FEBS Lett. 2008;582(8):1276–1282. doi: 10.1016/j.febslet.2008.01.063. [DOI] [PubMed] [Google Scholar]
- 31.Litovitz TL, Klein-Schwartz W, Rodgers GC, Cobaugh DJ, Youniss J, Omslaer JC, May ME, Woolf AD, Benson BE. 2001 annual report of the American Association of Poison Control Centers toxic exposure surveillance system. Am J Emerg Med. 2002;20(5):391–452. doi: 10.1053/ajem.2002.34955. [DOI] [PubMed] [Google Scholar]
- 32.Mazer M, Perrone J. Acetaminophen-induced nephrotoxicity: pathophysiology, clinical manifestations, and management. J Med Toxicol. 2008;4:2–6. doi: 10.1007/BF03160941. [DOI] [PMC free article] [PubMed] [Google Scholar]
- 33.Csete M, Sullivan JB. Vicodin-induced fulminant hepatic failure. Anesthesiology. 1993;79:854–860. doi: 10.1097/00000542-199310000-00029. [DOI] [PubMed] [Google Scholar]
- 34.Cohen SD, Khairallah EA. Selective protein arylation and acetaminophen-induced hepatotoxicity. Drug Metab Rev. 1997;29(1–2):59–77. doi: 10.3109/03602539709037573. [DOI] [PubMed] [Google Scholar]
- 35.Lambrecht FY, Durkan K, Yildirim Y, Acar C. Labeling of acetaminophen with I-131 and biodistribution in rats. Chem Pharm Bull (Tokyo) 2006;54(2):245–247. doi: 10.1248/cpb.54.245. [DOI] [PubMed] [Google Scholar]
- 36.Hart SG, Cartun RW, Wyand DS, Khairallah EA, Cohen SD. Immunohistochemical localization of acetaminophen in target tissues of the CD-1 mouse: correspondence of covalent binding with toxicity. Fundam Appl Toxicol. 1995;24(2):260–274. doi: 10.1006/faat.1995.1029. [DOI] [PubMed] [Google Scholar]
- 37.Bulera SJ, Cohen SD, Khairallah EA. Acetaminophen-arylated proteins are detected in hepatic subcellular fractions and numerous extra-hepatic tissues in CD-1 and C57B1/6J mice. Toxicology. 1996;109(2–3):85–99. doi: 10.1016/0300-483x(96)03309-4. [DOI] [PubMed] [Google Scholar]
- 38.Nathwani RA, Pais S, Reynolds TB, Kaplowitz N. Serum alanine aminotransferase in skeletal muscle diseases. Hepatology. 2005;41(2):380–382. doi: 10.1002/hep.20548. [DOI] [PubMed] [Google Scholar]
- 39.Fayngersh V, Passero M. Estimating radiation risk from computed tomography scanning. Lung. 2009;187(3):143–148. doi: 10.1007/s00408-009-9143-9. [DOI] [PubMed] [Google Scholar]
- 40.Mothersill C, Moriarty MJ, Seymour CB. Bystander and other delayed effects and multi-organ involvement and failure following high dose exposure to ionising radiation. BJR Suppl. 2005;27:128–131. [Google Scholar]
- 41.Amacher DE, Adler R, Herath A, Townsend RR. Use of proteomic methods to identify serum biomarkers associated with rat liver toxicity or hypertrophy. Clin Chem. 2005;51(10):1796–1803. doi: 10.1373/clinchem.2005.049908. [DOI] [PubMed] [Google Scholar]
- 42.Merrick BA, Bruno ME, Madenspacher JH, Wetmore BA, Foley J, Pieper R, Zhao M, Makusky AJ, McGrath AM, Zhou JX, Taylor J, Tomer KB. Alterations in the rat serum proteome during liver injury from acetaminophen exposure. J Pharmacol Exp Ther. 2006;318(2):792–802. doi: 10.1124/jpet.106.102681. [DOI] [PMC free article] [PubMed] [Google Scholar]
- 43.Yamamoto T, Tomizawa K, Fujikawa M, Sato Y, Yamada H, Horii I. Evaluation of human hepatocyte chimeric mice as a model for toxicological investigation using panomic approaches-effect of acetaminophen on the expression profiles of proteins and endogenous metabolites in liver plasma and urine. J Toxicol Sci. 2007;32(3):205–215. doi: 10.2131/jts.32.205. [DOI] [PubMed] [Google Scholar]
- 44.Desiere F, Deutsch EW, King NL, Nesvizhskii AI, Mallick P, Eng J, Chen S, Eddes J, Loevenich SN, Aebersold R. The PeptideAtlas project. Nucleic Acids Res. 2006;34(Database issue):D655–D658. doi: 10.1093/nar/gkj040. [DOI] [PMC free article] [PubMed] [Google Scholar]
- 45.Uetrecht J. Idiosyncratic drug reactions: current understanding. Annu Rev Pharmacol Toxicol. 2007;47:513–539. doi: 10.1146/annurev.pharmtox.47.120505.105150. [DOI] [PubMed] [Google Scholar]
- 46.Muldrew KL, James LP, Mccullough SS, Hendrickson HP, Hinson JA, Mayeux PR. Determination of acetaminophen-protein adducts in mouse liver and serum and human serum after hepatotoxic doses of acetaminophen using high-performance liquid chromatography with electrochemical detection. Drug Metab Dispos. 2002;30:446–451. doi: 10.1124/dmd.30.4.446. [DOI] [PubMed] [Google Scholar]
- 47.Smolka MB, Albuquerque CP, Chen SH, Schmidt KH, Wei XX, Kolodner RD, Zhou H. Dynamic changes in protein-protein interaction and protein phosphorylation probed with amine-reactive isotope tag. Mol Cell Proteomics. 2005;4(9):1358–1369. doi: 10.1074/mcp.M500115-MCP200. [DOI] [PMC free article] [PubMed] [Google Scholar]
- 48.Keller A, Eng J, Zhang N, Li XJ, Aebersold R. A uniform proteomics MS/MS analysis platform utilizing open XML file formats. Mol Syst Biol. 2005;1(2005):0017. doi: 10.1038/msb4100024. [DOI] [PMC free article] [PubMed] [Google Scholar]
- 49.Dodds ED. Gas-phase dissociation of glycosylated peptide ions. Mass Spectrom Rev. 2012;31:666682. doi: 10.1002/mas.21344. [DOI] [PubMed] [Google Scholar]
- 50.Dell A, Morris HR. Glycoprotein structure determination by mass spectrometry. Science. 2001;291(5512):2351–2356. doi: 10.1126/science.1058890. [DOI] [PubMed] [Google Scholar]
- 51.Bielik AM, Zaia J. Historical overview of glycoanalysis. Methods Mol Biol. 2010;600:9–30. doi: 10.1007/978-1-60761-454-8_2. [DOI] [PubMed] [Google Scholar]
- 52.Ramos H, Shannon P, Aebersold R. The protein information and property explorer: an easy-to-use, rich-client web application for the management and functional analysis of proteomic data. Bioinformatics. 2008;24(18):2110–2111. doi: 10.1093/bioinformatics/btn363. [DOI] [PMC free article] [PubMed] [Google Scholar]
- 53.Shannon P, Markiel A, Ozier O, Baliga NS, Wang JT, Ramage D, Amin N, Schwikowski B, Ideker T. Cytoscape: a software environment for integrated models of biomolecular interaction networks. Genome Res. 2003;13(11):2498–2504. doi: 10.1101/gr.1239303. [DOI] [PMC free article] [PubMed] [Google Scholar]
- 54.Keshava Prasad TS, Goel R, Kandasamy K, Keerthikumar S, Kumar S, Mathivanan S, Telikicherla D, Raju R, Shafreen B, Venugopal A, Balakrishnan L, Marimuthu A, Banerjee S, Somanathan DS, Sebastian A, Rani S, Ray S, Harrys Kishore CJ, Kanth S, Ahmed M, Kashyap MK, Mohmood R, Ramachandra YL, Krishna V, Rahiman BA, Mohan S, Ranganathan P, Ramabadran S, Chaerkady R, Pandey A. Human Protein Reference Database 2009 update. Nucleic Acids Res. 2009;37(Database issue):D767–D772. doi: 10.1093/nar/gkn892. [DOI] [PMC free article] [PubMed] [Google Scholar]
- 55.Varki A. Biological roles of oligosaccharides: All of the theories are correct. Glycobiology. 1993;3(2):97–130. doi: 10.1093/glycob/3.2.97. [DOI] [PMC free article] [PubMed] [Google Scholar]
- 56.Essentials of Glycobiology. 2. Cold Spring Harbor Laboratory Press; New York: 2009. [PubMed] [Google Scholar]
- 57.Han DK, Eng J, Zhou H, Aebersold R. Quantitative profiling of differentiation-induced microsomal proteins using isotope-coded affinity tags and mass spectrometry. Nature. 2001;19:946–951. doi: 10.1038/nbt1001-946. [DOI] [PMC free article] [PubMed] [Google Scholar]
- 58.Waring WS, Jamie H, Leggett GE. Delayed onset of acute renal failure after significant paracetamol overdose: A case series. Hum Exp Toxicol. 2010;29(1):63–68. doi: 10.1177/0960327109350799. [DOI] [PubMed] [Google Scholar]
- 59.Boyer TD, Rouff SL. Acetaminophen-induced hepatic necrosis and renal failure. J Am Med Assoc. 1971;218:440–441. [PubMed] [Google Scholar]
- 60.Boyd EM, Bereczky GM. Liver necrosis from paracetamol. Br J Pharmacol. 1966;26:606–614. doi: 10.1111/j.1476-5381.1966.tb01841.x. [DOI] [PMC free article] [PubMed] [Google Scholar]
- 61.Mitchell JR, Jollow DJ, Potter WZ, Davis DC, Gillette JR, Brodie BB. Acetaminophen-induced hepatic necrosis. I. Role of drug metabolism. J Pharmacol Exp Ther. 1973;187:185–194. [PubMed] [Google Scholar]
- 62.Placke ME, Wyand DS, Cohen SD. Extrahepatic lesions induced by acetaminophen in the mouse. Toxicol Pathol. 1987;15(4):381–387. doi: 10.1177/019262338701500401. [DOI] [PubMed] [Google Scholar]
- 63.Jiao X, Sherman BT, Huang W, da R, Stephens MW, Baseler HC, Lane, Lempicki RA. DAVID-WS: a stateful web service to facilitate gene/protein list analysis. Bioinformatics. 2012;28(13):1805–1806. doi: 10.1093/bioinformatics/bts251. [DOI] [PMC free article] [PubMed] [Google Scholar]
- 64.Anderson BJ. Paracetamol (acetaminophen): mechanisms of action. Paediatr Anaesth. 2008;18(10):915–921. doi: 10.1111/j.1460-9592.2008.02764.x. [DOI] [PubMed] [Google Scholar]
- 65.Jaeschke H, Gores GJ, Cederbaum AI, Hinson JA, Pessayre D, Lemasters JJ. Mechanisms of hepatotoxicity. Toxicol Sci. 2002;65:166–176. doi: 10.1093/toxsci/65.2.166. [DOI] [PubMed] [Google Scholar]
- 66.James LP, Mayeux PR, Hinson JA. Acetaminophen-induced hepatotoxicity. Drug Metab Dispos. 2003;31:1499–1506. doi: 10.1124/dmd.31.12.1499. [DOI] [PubMed] [Google Scholar]
- 67.McNally JS, Saxena A, Cai H, Dikalov S, Harrison DG. Regulation of xanthine oxidoreductase protein expression by hydrogen peroxide and calcium. Arterioscler, Thromb, Vasc Biol. 2005;25(8):1623–1628. doi: 10.1161/01.ATV.0000170827.16296.6e. [DOI] [PubMed] [Google Scholar]
- 68.Erukhimov JA, Tang ZL, Johnson BA, Donahoe MP, Razzack JA, Gibson KF, Lee WM, Wasserloos KJ, Watkins SA, Pitt BR. Actin-containing sera from patients with adult respiratory distress syndrome are toxic to sheep pulmonary endothelial cells. Am J Respir Crit Care Med. 2000;162(1):288–294. doi: 10.1164/ajrccm.162.1.9806088. [DOI] [PubMed] [Google Scholar]
- 69.Gu J, Cui J, Behr M, Zhang L, Zhang QY, Yang W, Hinson JA, Ding X. In vivo mechanisms of tissue-selective drug toxicity: effects of liver-specific knockout of hte NADPH-cytochrome P450 reductase gene on acetaminophen toxicity in kidney, lung, and nasal mucosa. Mol Pharmacol. 2005;67(3):623–630. doi: 10.1124/mol.104.007898. [DOI] [PubMed] [Google Scholar]
- 70.Gove CD, Wardle EN, Williams R. circulating lysosomal enzymes and acute hepatic necrosis. J Clin Pathol. 1981;34:13–16. doi: 10.1136/jcp.34.1.13. [DOI] [PMC free article] [PubMed] [Google Scholar]
- 71.Zoeger A, Blau M, Egerer K, Feist E, Dahlmann B. Circulating proteasomes are functional and have a subtype pattern distinct from 20S proteasomes in major blood cells. Clin Chem. 2006;52(11):2079–2086. doi: 10.1373/clinchem.2006.072496. [DOI] [PubMed] [Google Scholar]
- 72.Sullivan MM, Barker TH, Funk SE, Karchin A, Seo NS, Hook M, Sanders J, Starcher B, Wight TN, Puolakkainen P, Sage EH. Matricellular hevin regulates decorin production and collagen assembly. J Biol Chem. 2006;281(37):27621–27632. doi: 10.1074/jbc.M510507200. [DOI] [PubMed] [Google Scholar]
- 73.Hambrock HO, Nitsche DP, Hansen U, Bruckner P, Paulsson M, Maurer P, Hartmann U. SC1/hevin. An extracellular calcium-modulated protein that binds collagen I. J Biol Chem. 2003;278(13):11351–11358. doi: 10.1074/jbc.M212291200. [DOI] [PubMed] [Google Scholar]
- 74.Takenouchi-Ohkubo N, Takahashi T, Tsuchiya M, Mestecky J, Moldoveanu Z, Moro I. Role of nuclear factor-kB in the expression by tumor necrosis factor-alpha of the human polymeric immunoglobulin receptor (pIgR) gene. Immunogenetics. 2000;51:289–295. doi: 10.1007/s002510050622. [DOI] [PubMed] [Google Scholar]
- 75.Taketa K. alpha-fetoprotein: reevaluation in hepatology. Hepatology. 1990;12:1420–1432. doi: 10.1002/hep.1840120625. [DOI] [PubMed] [Google Scholar]
- 76.Schmidt LE, Dalhoff K. Alpha-fetoprotein is a predictor of outcome in acetaminophen-induced liver injury. Hepatology. 2005;41(1):26–31. doi: 10.1002/hep.20511. [DOI] [PubMed] [Google Scholar]
- 77.Tygstrup N, Jensen SA, Krog B, Dalhoff K. Expression of liver-specific functions in rat hypatocytes following sublethal and lethal acetaminophen poisoning. J Hepatology. 1996;25:183–190. doi: 10.1016/s0168-8278(96)80072-9. [DOI] [PubMed] [Google Scholar]
Associated Data
This section collects any data citations, data availability statements, or supplementary materials included in this article.