

Abstract
Glucagon-like peptide-1 (GLP-1) is a neuroendocrine hormone produced by gastrointestinal tract in response to food ingestion. GLP-1 plays a very important role in the glucose homeostasis by stimulating glucose-dependent insulin secretion, inhibiting glucagon secretion, inhibiting gastric emptying, reducing appetite and food intake. Because of these actions, the GLP-1 peptide-mimetic exenatide is one of the most promising new medicine for the treatment of type 2 diabetes. In vivo treatments with GLP-1 or exenatide prevent neo-intima layer formation in response to endothelial damage and atherosclerotic lesion formation in aortic tissue. Whether GLP-1 modulates vascular smooth muscle cell (VSMC) migration and proliferation by controlling mitochondrial dynamics is unknown. In this report, we showed that GLP-1 increased mitochondrial fusion and activity in a PKA-dependent manner in the VSMC cell line A7r5. GLP-1 induced a Ser-637 phosphorylation in the mitochondrial fission protein Drp1, and decreased Drp1 mitochondrial localization. GLP-1 inhibited PDGF-BB-induced VSMC migration and proliferation, actions inhibited by overexpressing wild type Drp1 and mimicked by the Drp1 inhibitor Mdivi-1 and by overexpressing dominant negative Drp1. These results show that GLP-1 stimulates mitochondrial fusion, increases mitochondrial activity and decreases PDGF-BB-induced VSMC dedifferentiation by a PKA/Drp1 signaling pathway. Our data suggest that GLP-1 inhibits vascular remodeling through a mitochondrial dynamics-dependent mechanism.
Keywords: GLP-1, VSMC, mitochondrial dynamics, Drp1, VSMC dedifferentiation
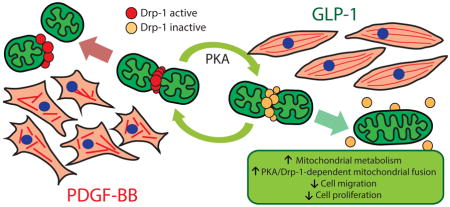
Graphical Abstract
1. Introduction
The incretin glucagon-like peptide-1 (GLP-1) is a hormone released from the gut in response to food intake and was initially described as an agent favoring post-prandial insulin release [1, 2]. Due to its insulinotropic action, GLP-1 mimetics were developed and approved as a therapy for controlling hyperglycemia in type 2 diabetes [3].The main physiological effects of GLP-1 or GLP-1 mimetics are related to its incretin property [4]. However, extrapancreatic effects of incretin has been also described, particularly in the central nervous system, heart, adipose tissue, skeletal muscle, endothelial cells and vascular smooth muscle cells (VSMC) [5, 6].
We hypothesized that mitochondrial dynamics and metabolism is important for VSMC differentiation-dedifferentiation [7]. In fact, changes in mitochondrial dynamics have been implicated in VSMC proliferation and contractile protein expression [7], suggesting that mitochondrial morphology is relevant for VSMC phenotypic modulation. Modulation of VSMC phenotype is involved in the development and progression of atherosclerosis, hypertension and neointimal formation [8, 9].
Mitochondria dynamics involves the transition between elongated interconnected mitochondrial networks and a fragmented disconnected arrangement by events of mitochondrial fusion and fission, respectively [10]. Mitochondrial fission is regulated by the fission protein 1 (Fis1) and the dynamin-related protein 1 (Drp1). Fis1 is localized in the mitochondrial outer membrane and recruits cytoplasmic Drp1 under fission-promoting stimuli, triggering the constriction of mitochondrial membranes [10, 11]. In contrast, fusion is controlled by the large GTPases mitofusins 1/2 (Mfn1/2) and optic atrophy 1 protein (Opa1), promoting fusion of the outer and inner membranes, respectively [10, 11]. Recently, we showed that GLP-1 enhances the functional coupling between endoplasmic reticulum (ER) and mitochondria in VSMC [12]. However, whether GLP-1 controls mitochondrial dynamics and activity and therefore regulates VSMC phenotypic modulation remains unknown.
To address this, we assessed the effects of GLP-1 on mitochondrial dynamics and activity, and its effects on VSMC phenotype. Our data showed that GLP-1 stimulates mitochondrial fusion and activity through a protein kinase A (PKA)-dependent Drp1 inactivation and through the increase of Mfn2 protein levels. PKA inhibition complete blocked GLP-1-induced mitochondrial fusion and activity. Importantly, GLP-1 abolished platelet-derived growth factor (PDGF)-BB-induced migration and proliferation through a PKA/Drp1 signaling pathway. Altogether, these results suggest that mitochondrial morphology and function regulate migratory effects of GLP-1 on vascular smooth muscle A7r5 cell line.
2. Materials and methods
2.1. Cell culture
The A7r5 cell line, originally derived from embryonic rat aorta, was purchased from the American Type Culture Collection (ATCC) and cultured as described [12]. Prior to stimulation, 80–90% confluent VSMCs were serum-starved overnight and then stimulated with 100 nM GLP-1 (7-36) amide (cat # 46113, American Peptide Company, Sunnyvale, CA, USA).
2.2. Mitochondria imaging
After stimulation with GLP-1, cells were incubated with MitoTracker Orange (MTO, 400 nM for 30 min [cat # M7510, Molecular Probes-Invitrogen, Eugene, OR, USA]), washed with PBS, fixed with paraformaldehyde (4% [w/v] in PBS for 20 min [cat # 15700, Electron Microscopy Sciences, Hatfield, PA, USA) and blocked with bovine serum albumin (BSA, 1% [w/v] in PBS for 1 h [cat # 05470, Sigma-Aldrich Corp. St. Louis, MO, USA]). Confocal images were captured with a Zeiss LSM-5, Pascal 5 Axiovert 200, equipped with a Plan-Apochromat 63x/1.4 Oil DIC objective and with LSM 5 3.2 software for image capture/analysis as previously described [12]. Providing a pixel size of 0.0049 μm2 and according to Nyqvist criterion, the resulting optical resolution (xy) is 143 nm. With this resolution, we can track changes in mitochondrial size that ranged from 0.039 to 0.873 μm2, as described for other cells in the cardiovascular system [13]. Images were deconvolved with Image J (NIH) and then, Z-stacks of thresholded images were volume-reconstituted using the VolumeJ plug-in. The number and individual volume of each object (mitochondria) were quantified using the ImageJ-3D Object counter plug-in. Each experiment was done at least four times and in each time 16–25 cells per condition were quantified. A decrease in mitochondrial volume or area and an increase in the number of mitochondria per cell were considered as fission criteria [14, 15].
2.3. Mitochondrial activity
Mitochondrial membrane potential (ΔΨm), reactive oxygen species (ROS), ATP content and oxygen consumption were determined as described [12].
2.4. Drp1 and mitochondria colocalization
A7r5 cells cultured on coverslips were stimulated with GLP-1 for 3 h. During the last 30 min of treatment 400 nM MTO was added. Cells were washed with PBS and fixed with PBS containing 4% paraformaldehyde and incubated for 10 min in ice-cold 0.3% Triton X-100 (cat # X100, Sigma-Aldrich Corp. St. Louis, MO, USA) for permeabilization. Nonspecific sites were blocked with 1% BSA in PBS for 1 h and then the cells were incubated with anti Drp1 (1:500) antibody (cat # 611112, BD Transduction Laboratories, San Jose, CA, USA). Secondary antibody was anti-mouse Alexa488 (cat # A-11034, Molecular Probes-Invitrogen, Eugene, OR, USA). For the colocalization analysis only one focal plane was analyzed with a Zeiss LSM-5 Pascal 5 Axiovert 200 microscope. Images obtained were deconvolved and background was subtracted using the ImageJ software. Colocalization between the Drp1 and mitochondria was quantified using the Manders' algorithm, as previously described [15, 16].
2.5. Western blot analysis
Equal amounts of protein from cells were separated by SDS–PAGE (10% polyacrylamide gels) and electrotransferred to nitrocellulose. Membranes were blocked with 5% defatted milk in Tris-buffered saline, pH 7.6, containing 0.1% (v/v) Tween 20 (TBST). Membranes were incubated with primary antibodies at 4ºC (mtHsp70 1:1000 [cat # MA3-028, ABR-Affinity Bioreagents, Glosen, CO, USA], total Drp1 1:1000 [cat # 611112, BD Transduction Laboratories, San Jose, CA, USA], p-Drp1 1:500 [cat # 4867, Cell Signalling, Danvers, MA, USA], Mfn2 1:1000 [cat # ab50838, Abcam, Cambridge, MA, USA]; Fis1 1:1000 [cat # ALX 210 907, Alexis Biochemicals, San Diego, CA, USA], Opa1 1:1000 [cat # ab55772, Abcam, Cambridge, MA, USA]; β-tubulin 1:5000 [cat # T0198, Sigma-Aldrich Corp. St. Louis, MO, USA]; β-actin 1:5000 [cat # A3853, Sigma-Aldrich Corp. St. Louis, MO, USA]) and re-blotted with horseradish peroxidase-linked secondary antibody (1:5000 in 1% [w/v] defatted milk in TBST [cat # AP307P & AP308P, Calbiochem, La Jolla, CA, USA]). The bands were detected using ECL (cat # NEL103001EA, Pelkin Elmer, Waltham, MA, USA) with exposure to Kodak film and quantified by scanning densitometry. Protein content was normalized by β-tubulin or β-actin.
2.6. Immunoprecipitation of Drp1
For immunoprecipitation of Drp1, 0.4 mg of total protein lysate of each treatment condition was mixed with 30 μL of protein A/G PLUS-agarose (cat # sc-2003, Santa Cruz Biotechnology, Dallas, TX, USA) and 30 μL anti total Drp1 antibody and incubated for overnight at 4°C. After centrifugation at 9000 x g for 5 min at 4ºC, the elution of Drp1 was performed by adding 15 μL of 4x SDS-sample buffer and boiling. Equal amounts of supernatants were submitted to western blotting analysis and revealed using anti p-Drp1 antibody.
2.7. Adenoviruses
A7r5 cells were transduced with adenoviruses overexpressing β-galactosidase (LacZ), wild type Drp1 (wtDrp1), dominant negative Drp1 (DN-Drp1) and wild type Mfn2 (Mfn2) for 24 h using MOI 300.
2.8. Migration assay
Near confluent A7r5 cells seeded in 60 mm culture plates were serum deprived for 24 h. Culture media was replaced with DMEM containing bromodeoxyuridine (100 μM [cat # B9285, Sigma-Aldrich Corp. St. Louis, MO, USA]) then treated with GLP-1 (100 nM), forskolin (100 μM [cat # F6886, Sigma-Aldrich Corp. St. Louis, MO, USA]) or Mdivi-1 (10 μM [cat # M0199, Sigma-Aldrich Corp. St. Louis, MO, USA]) for 3 h and then stimulated with PDGF-BB (10 nM [cat # 521225, Merck Millipore Corporation, Darmstadt, Germany]) for another 24 h. Just after adding PDGF-BB, a sterile 200 μL pipet tip was used to make a straight scratch in the cells in each plate. Inhibitors (H-89 100 nM [cat. 371963, Calbiochem, La Jolla, CA, USA]; Exendin-9 [Ex-9] 100 nM [cat # 46310B, American Peptide Company, Sunnyvale, CA, USA) were added 30 min before GLP-1 pretreatment. Under a 10x lens, images were taken of 9 fields per well of the linear wound. PDGF-BB-stimulated migration was expressed as a percentage of migration respect to the initial distance at time 0 h. Alternatively, cell migration was assessed using 24-well plates with Transwell inserts (8.0 μm pore; Costar [cat # 3422, Corning Incorporated, NY, USA]), as described previously [17].
2.9. Proliferation assay
VSMC proliferation was determined by [3H]-thymidine incorporation. Cells were pulse-labeled for 4 h in culture medium containing [3H]-thymidine (1 μCi/mL, 2 Ci/mmol [cat # NET027A001MC, Perkin Elmer, Waltham, MA, USA]) as described [18]. Each experiment was performed in triplicate in 6-well tissue culture plates.
2.10. Statistical analysis
Data are shown as mean ± SEM of the number of independent experiments indicated (n). Data were analyzed by Student's t-test or one-way ANOVA and differences among groups was detected using a Dunnett's test. Statistical significance was defined as P < 0.05.
3. Results
3.1. GLP-1 stimulates mitochondrial fusion and function
Treatment of A7r5 cells with GLP-1 stimulated the appearance of large interconnected mitochondria (Fig. 1A). Single confocal images were used to quantify mitochondrial area and number of mitochondrial per cell (Fig. 1A). GLP-1 increased mitochondrial area after 0.5 and 3 h of incubation (Fig. 1B), an effect that was reversed after 6 h. Conversely, the number of mitochondria per cell decreased significantly at 0.5 h of GLP-1 treatment (Fig. 1B). Similar data were obtained when the mitochondrial network was assessed by the number and volume of individual mitochondria through 3D reconstitution of confocal stacks (Fig. 1C). Additionally, these changes were not associated with a decrease in mitochondrial biogenesis or degradation because GLP-1 did not change the total amount of the mitochondrial protein mtHsp70 (Fig. 1D). Taking together, these results suggest that GLP-1 stimulates mitochondrial fusion in A7r5 without changing the existing balance between mitochondrial synthesis and turnover rates.
Fig. 1. GLP-1 stimulates mitochondrial fusion and activity on VSMC.

A7r5 cells were stimulated with GLP-1 (100 nM) for 0, 0.5, 3, 6 and 24 h. (A) Confocal images of the mitochondrial network stained with MitoTracker Orange. Inserts are a 5x magnification of indicated areas. Scale bar = 25 μm. (B) Quantitative analysis of mitochondrial morphology. A single confocal image was used to determine mitochondrial area and number of mitochondria per cell using ImageJ software. (C) Confocal images of the mitochondrial network were subjected to 3D reconstruction to determine the volume of mitochondrial particles and the number of mitochondrial per cell using image J software. (D) Total protein extracts were obtained and mtHsp70 protein levels were determined by western blot and relativized using β-tubulin. (E) Mitochondrial potential (ΔΨm) was determined using JC-1 probe (10 μM) and detected using a FACS system. Uncoupler CCCP (200 nM) was used as a control. Upper panel shows representative dot plots. (F) Total ROS content was measured by flow cytometry using the dihydrorhodamine (DHR) probe. Upper panel is a representative histogram of basal and A7r5 cells treated with GLP-1 for 6 h. (G) Basal oxygen consumption rate (OCR) was measured for 5 min using a Clark electrode. (H) Uncoupled respiration rate was determined by adding CCCP (200 nM). (I) ATP content was measured by a luciferin/luciferase-based kit. Data are the average ± SEM of 4–5 independent experiments *p < 0.05 and **p < 0.01 vs. 0 h.
Mitochondrial fusion is associated with an increase of mitochondrial metabolism [10]. GLP-1 increased ΔΨm at 0.5 h of GLP-1 treatment (Fig. 1E). Changes in ROS production by GLP-1 was observed after 6 h (Fig. 1F). To assess changes in mitochondrial oxidative phosphorylation, we measured oxygen consumption rates (OCR) at baseline and after maximal uncoupling. Increased basal OCR was observed after 3 h of GLP-1 treatment (Fig. 1G). Raise in OCR was due to an increased mitochondrial oxidative capacity, because CCCP-stimulated maximal OCR was significantly modified with GLP-1 treatment (Fig. 1H). Increase of ΔΨm and OCR were associated with an elevation of ATP intracellular levels (Fig. 1I). These last data suggest that uncoupling among the components of the electron transport chain occurs only after reversion of mitochondrial fusion. Collectively, these data suggest that GLP-1 enhances mitochondrial activity on A7r5 cells.
3.2. GLP-1 induces Drp1 inactivation by PKA
We have recently showed that GLP-1 stimulates GLP-1 receptor/adenylate cyclase/PKA signaling pathway in VSMC [12]. To elucidate the mechanism of GLP-1-dependent mitochondrial fusion, involvement of PKA was assessed. PKA inhibition with H-89 completely inhibited mitochondrial fusion induced by GLP-1 (Fig. 2A). H-89 completely prevented the GLP-1-induced increase in mitochondrial area (Fig. 2B, upper panel) and the GLP-1-induced reduction of the number of mitochondria per cell (Fig. 2B, lower panel). Treatment with GLP-1 did not modify mitochondrial fission protein levels, Drp1 and Fis1 (Fig. 2C). However, as we described previously, GLP-1 increased mitochondrial fusion protein Mfn2, without modifying Opa1 protein levels (Fig. 2D).
Fig. 2. GLP-1 stimulates mitochondrial fusion by a PKA/Drp1-dependent mechanism.

(A) A7r5 cells were pretreated or not with H-89 (10 μM) for 30 min and then stimulated with GLP-1 (100 nM) for 3 h. Confocal images of the mitochondrial network stained with MitoTracker Orange. Inserts are a 5x magnification of indicated areas. Scale bar = 25 μm. (B) Quantitative analysis of mitochondrial morphology using the ImageJ software. Total protein extracts were obtained for A7r5 cells. (C, upper panel) Total Drp1, (C, lower panel) Fis1, (D, upper panel) Mfn2 and (D, lower panel) Opa1 protein levels were determined by western blot. β-actin and β-tubulin were used as protein loading controls. (E) A7r5 cells were treated with GLP-1 (100 nM) for 3 h or with forskolin (100 μM). Total protein extracts were prepared and total Drp1 was immunoprecipitated as described in Materials and Methods. Immunoprecipitated proteins were submitted to western blot using anti-p-Drp1. (F) Quantification of immunoprecipitated p-Drp1 relativized against total Drp1. (G) A7r5 cells were pretreated or not with H-89 (10 μM) for 30 min and then stimulated with GLP-1 (100 nM) for 3 h. p-Drp1 and total Drp1 was detected as described above. (H) Mitochondria and Drp1 were labeled with MitoTracker orange (MTO, 400 nM) and anti-Drp1 antibody 1:500 (green), respectively. Representative images by confocal microscopy of A7r5 cells. Bar represents 25 μm. (I) Colocalization was assessed by Manders' coefficients between mitochondria-Drp1 (upper panel) and Drp1-mitochondria (lower panel). Data are mean ± SEM of 4–5 independent experiments *p < 0.05 vs. control; #p < 0.05 vs. GLP-1.
Drp1 activity is inhibited by PKA phosphorylation of serine 637 and Drp1 inactivation promotes mitochondrial fusion [19]. To test whether Drp1 was responsible for GLP-1-induced mitochondrial fission, PKA-dependent Drp1 phosphorylation was assessed. GLP-1 increased Drp1 phosphorylation in serine 637. The same phosphorylation was induced by the adenylate cyclase activator forskolin that increases intracellular cAMP levels (Fig. 2E–F). GLP-1-induced Drp1 phosphorylation was inhibited by preincubation with H-89 (Fig. 2G).
Previous studies have established the migration of Drp1 from the cytosol to the mitochondrial surface as an initial step in mitochondrial fission [10]. Therefore, we next evaluated whether mitochondrial fusion triggered by GLP-1 was associated with changes in the subcellular distribution of Drp1. Immunofluorescence studies showed that the punctuated distribution pattern of Drp1 was decreased after 3 h of treatment with GLP-1 (Fig. 2H). Moreover, GLP-1 increased the effective colocalization of Drp1 with mitochondria, but not the effective colocalization of mitochondria with Drp1, as evaluated by Manders’ coefficients (Fig. 2I).
Taking together, these data suggest that GLP-1 induced Drp1 phosphorylation by an adenylate cylase/PKA-dependent mechanism. The decrease of Drp1 association with the mitochondria, together with an increase in Mfn2 protein levels, triggers mitochondrial fusion.
3.3. GLP-1 inhibits PDGF-BB-induced cell migration and proliferation through a PKA-dependent pathway
To test whether GLP-1 regulates A7r5 cell migration, cells were stimulated with PDGF-BB and treated with GLP-1. Treatment with GLP-1 did not modify basal A7r5 cell migration. However, pretreatment with GLP-1 prevented PDGF-BB-induced cell migration, measured by wound healing assay (Fig. 3A, upper panel). The same results were obtained using the transwell assay (Fig. 3A, lower panel). GLP-1-dependent inhibition of cell migration relies on the activation of GLP-1 receptor, because pretreatment with exendin-9 (Ex-9), a GLP-1 receptor antagonist, completely abolished the inhibitory effect of GLP-1 on PDGF-BB-induced cell migration (Fig. 3C). Forskolin mimicked the action of GLP-1 on PDGF-BB-induced cell migration (Fig. 3D). Moreover, H-89 completely abolished GLP-1 inhibitory effect on PDGF-BB-induced cell migration (Fig. 3E). Taking together, these results showed that GLP-1 inhibits PDGF-BB-induced cell migration through a GLP-1 receptor/adenylate cyclase/PKA pathway.
Fig. 3. GLP-1 inhibits PDGF-BB-induced cell migration and proliferation.

A7r5 cells were pretreated or not with GLP-1 (100 nM) for 3 h and then stimulated with PDGF-BB (10 nM). (A) Cell migration was determined by wound healing assay (upper panel) and by transwell assay (lower panel). In the wound assay, confluent A7r5 cell monolayers were wounded by scraping and pretreated or not with GLP-1 (100 nM) for 3 h and then stimulated with PDGF-BB (10 nM) in serum-free medium. Cell migration to the wound surface was monitored from 0 to 24 h. Nine different areas of migrated cells were counted for each data point. (B, upper panel) The migrated distance of the wound edge was quantitated and expressed as % of migration respect to the initial distance at time 0 h. (B, lower panel) In the transwell assay, cells in the lower side of the transwell membrane were stained and counted. (C) Participation of GLP-1 receptor was evaluated by incubating A7r5 cells with exendin-9 (Ex-9, 100 nM) 30 min previous to GLP-1 treatment. (D) Involvement of adenylate cyclase/cAMP was evaluated by incubating A7r5 cells with forskolin (100 μM). (E) Role of PKA in migration, assessed by wound healing assay (upper panel) and transwell assay (lower panel), was evaluated by incubating A7r5 cells with H-89 (100 nM) 30 min previous to GLP-1 or GLP-1/PDGF-BB treatments. (F) Proliferation was assessed by [3H]-thymidine incorporation. (G) Role of PKA in proliferation was evaluated by incubating A7r5 cells with H-89 (100 nM) 30 min previous to GLP-1 or GLP-1/PDGF-BB treatments. Data are mean ± SEM of 5 independent experiments. *p < 0.05, ***p<0.001 vs. control; #p<0.05, ##p<0.01, ###p<0.001 vs. PDGF-BB; &p<0.05, &&p<0.01 vs. GLP-1+PDGF-BB.
To test whether GLP-1 is involved in the control of cell proliferation, A7r5 cells were stimulated with PDGF-BB and then treated with GLP-1. PDGF-BB but not GLP-1 induced cell proliferation, as determined by [3H]-thymidine incorporation (Fig. 3F). GLP-1-dependent inhibition of cell proliferation relies on PKA activity, because pretreatment with H-89 completely abolished GLP-1 inhibitory effect on PGDF-BB-induced cell proliferation (Fig. 3G). Taking together, these results showed that GLP-1 inhibits PDGF-BB-induced cell proliferation through a PKA-dependent mechanism.
3.4. GLP-1-dependent mitochondrial fusion inhibits PDGF-BB-induced cell migration and proliferation
PDGF-BB induced mitochondrial fission. Pretreatment with GLP-1 completely abolished PDGF-BB-induced mitochondrial fission (Fig. 4A). GLP-1 inhibited both the decrease on mitochondrial volume and the increase in the number of mitochondria per cell induced by PDGF-BB (Fig. 4B). To test whether GLP-1-dependent control of mitochondrial dynamics regulates A7r5 cell migration and proliferation, mitochondrial dynamics was manipulated by activating or inhibiting Drp1. GLP-1-dependent inhibition of PDGF-BB-induced cell migration was complete abolished by the overexpression of a wild type Drp1 (wtDrp1) (Fig. 4C, upper panel). Because Drp1 was responsible for mitochondrial fission, its overexpression induces mitochondrial fragmentation [20] antagonizing the mitochondrial fusion induced by GLP-1. The same antagonizing effect was observed when cell proliferation was assessed (Fig. 4C, lower panel). Moreover, Mdivi-1, a selective cell-permeable inhibitor of Drp1 GTPase [21, 22], also inhibited PDGF-BB induced migration and proliferation (Fig. 4D). Mitochondrial fusion induced by overexpression of a domain negative Drp1 (DN-Drp1) or by overexpression of wild type Mfn2 also inhibited PDGF-BB-induced cell proliferation (Figs 4E–F). These data suggest that mitochondrial fusion induced by GLP-1 inhibits PDGF-BB-induced cell migration and proliferation.
Fig. 4. GLP-1 and PDGF-BB effects on cell migration and proliferation are regulated by mitochondrial dynamics.

A7r5 cells were pretreated or not with GLP-1 (100 nM) for 3 h and then stimulated with PDGF-BB (10 nM). (A) Confocal images of the mitochondrial network stained with MitoTracker Orange. Inserts are a 5x magnification of indicated areas. Scale bar = 25 μm. (B) Quantitative analysis of mitochondrial morphology. (C) To assess the contribution of mitochondrial fission, A7r5 cells were transduced (MOI 300) with adenovirus overexpressing β-galactosidase (LacZ) or wild type Drp1 (wtDrp1) for 24 h prior to experiments. (D) Contribution of mitochondrial fusion was evaluated by incubating A7r5 cells with Mdivi-1 (Drp1 inhibitor, 10 μM) 3 h previous to PDGF-BB treatment. Cell migration was determined by wound assay. Proliferation was assessed by [3H]-thymidine incorporation. A7r5 cells were transduced with adenoviruses overexpressing β-galactosidase (LacZ, control), (E) dominant negative Drp1 (DN-Drp1) or (F) wild type Mfn2 (Mfn2) using MOI 300. Twenty four hours later, A7r5 cells were stimulated with PDGF-BB (10 nM) and incubated with [3H]-thymidine (1 μCi/mL) for 4 h. Data are mean ± SEM of 5 independent experiments. *p < 0.05, **p < 0.01, ***p<0.001 vs. respective control; #p<0.05 vs. PDGF-BB; &p<0.05 vs. wtDrp1.
4. Discussion
Our findings showed for the first time that: a) GLP-1 controls mitochondrial fusion though the regulation of Drp1 and Mfn2; and b) GLP-1 inhibits cell migration and proliferation induced by PDGF-BB, and these effects relies on the activation of GLP-1 receptor/adenylate cyclase/PKA signaling pathway and Drp1 inhibition by a PKA-dependent phosphorylation.
In VSMC, mitochondrial dynamics is emerging as an important factor for controlling not only cell metabolism but also cell phenotype [7]. We showed that GLP-1 activates GLP-1R, stimulates PKA and induced both Drp1 phosphorylation and Mfn2 protein increase, leading to the formation of large interconnected mitochondria. Mitochondrial fusion was associated with an increase in mitochondrial activity, measured as ΔΨm, OCR, ATP level and ROS production.
There is a close relationship between the mitochondrial dynamics and mitochondrial metabolism [10, 23]. Thus, tissues with high energy demand (i.e. skeletal muscle, cardiomyocytes, etc.) normally have fused interconnected mitochondria. Conversely, tissues with low energy requirements have smaller and fragmented mitochondria [24, 25]. VSMC exhibit unusually high rates of glucose metabolization and lactate production under normal, well-oxygenated conditions [26]. Under resting conditions, the rate of oxygen consumption and lactate production are often almost equal on a molar basis, resulting in approximately 30% of the ATP supply coming from mitochondria, but at least 90% of the flux through glycolysis resulting in lactate production [27]. Therefore, VSMC have basally low mitochondrial activity that should be associated with a more fragmented mitochondrial network. Our results showed that A7r5 cells have small mitochondria, more fragmented than we and others have described for cardiomyocytes and skeletal muscle [15, 20].
GLP-1 induced a rapid mitochondrial fusion detected at 0.5 to 3 h of GLP-1 treatment. In accordance, increase of ΔΨm, OCR and ATP level were increased between 0.5 to 3 h after GLP-1 treatment. However, we observed that ROS was increased only after 6 h of GLP-1 incubation. Probably, this ROS increase was due to the uncoupling of mitochondrial respiratory chain due to the reversion of mitochondrial fusion induced by GLP-1. At 6 h mitochondrial morphology resembles a basal fragmented state. Moreover, at that time, these mitochondria still have increased OCR with normal ΔΨm. Increased electron transfer could be dissipated by ROS formation.
Our data support the idea that GLP-1-induced mitochondrial fusion depends on both an increase in Mfn2 and Drp1 inactivation by phosphorylation. Drp1 is one of the most important proteins involved in the regulation of mitochondrial fission [10, 11]. Drp1 translocates from the cytosol to the mitochondria and interacts with mitochondria outer membrane proteins (Fis-1, Caf-4, MDV-1 in yeast and Mff in metazoans) [28]. After generating a ring around the organelle, the GTP hydrolysis cause their constriction triggering the mitochondrial fission [28]. Drp1 mitochondrial translocation and GTPase activity are regulated mainly by post-translational modifications and the actin cytoskeleton [29]. Drp1 S-nitrosylation and phosphorylation by Cdk1/cyclin and PKA induce mitochondrial fission [10, 30].
Our results also showed an increase in Mfn2 protein levels. We described previously that GLP-1 induced Mfn2 protein increase in a PKA-dependent mechanism [12]. As Mfn2 mRNA levels were also increased [12], it is likely that a genomic response is elicited by GLP-1. Although we previously showed that GLP-1 induced CREB phosphorylation [12], we were unable to demonstrate that CREB was responsible for Mfn2 up-regulation. Analysis of human and rat Mfn2 promoters showed that in VSMC, Mfn2 expression is regulated by Sp1 [31]. Moreover, PKA activation was reported to regulate Sp1 activity [32]. These data suggest that cAMP signaling is relevant for Mfn2 gene regulation.
Mfn2 post-translational modification by phosphorylation was first proposed by Chen et al [33]. Zhou et al showed that PKA-induced Ser 422 phosphorylation inhibits the anti-proliferative role of Mfn2 on VSMC [34]. However, we have shown that PKA activity is necessary for the GLP-1-dependent induction of Mfn2, effect associated with a decrease in VSMC proliferation. Zhou et al [34] and our data seems to be controversial, but this might be just a temporally different response, as the experiments showed by Zhou et al were conducted after 48 h of adenovirus transduction to overexpress Mfn2, while our data were obtained only after 3 h of GLP-1 stimulation. We did not test whether Mfn2 Ser422 phosphorylation was modified in response to GLP-1.
Salabei & Hill showed that PDGF-BB induces mitochondrial fragmentation in VSMC and inhibition of mitochondrial fragmentation using Mdivi-1 suppressed PDGF-BB-induced proliferation [35]. Pulmonary artery smooth muscle cell proliferation has been associated with mitochondrial fission phenotype that was also inhibited by Mdivi-1 [36]. Moreover, overexpression of Mfn2 reduced VSMC proliferation [37]. These data strongly suggest that mitochondrial fusion is associated with and inhibition of VSMC proliferation. Recently, Wang et al showed that PDGF induced mitochondrial fission through a Drp1 dependent mechanism [38]. Moreover, they showed that PDGF induced an augmentation of mitochondrial energetics as well as ROS production, both of which were found to be necessary for VSMC migration [38]. Our data also showed that GLP-1-dependent regulation of mitochondrial dynamics controls VSMC migration and proliferation, and this mechanism relied partially on the regulation of Drp1 activity. Regulation of mitochondrial dynamics by Drp1 was previously involved in the control of human glioblastoma U251 cell migration induced by hypoxia [39] and in the migration and invasion of breast carcinoma [40].
Treatment with incretins improves fasting and postprandial lipid parameters by reducing total cholesterol, LDL-cholesterol and triglycerides concentrations and increasing HDL cholesterol values [41]. In VSMC, incretins are able to prevent vascular remodeling [42–46]. Exendin-4 and GLP-1 prevent the progression of atherosclerosis in apoE−/− mice, without major effects on metabolic parameters, and markedly reduced the accumulation of monocytes/macrophages in the vascular wall [43, 45]. Moreover, in Zucker fatty rats and C57BL/6 mice, exenatide caused a significant reduction in intimal hyperplasia in balloon catheter injured carotid arteries and endothelial denudation injury of the femoral artery, respectively [42, 44]. Furthermore, the GLP-1 receptor analogue liraglutide significantly reduced carotid intima-media thickness, a surrogate marker of atherosclerosis, independently of glucometabolic changes, in diabetic subjects with non-alcoholic fatty liver disease [46]. These data clearly show a direct effect of GLP-1 and its analogs on the vasculature, suggesting a therapeutical role of these peptides on vascular diseases. Our results show that the vascular anti-remodeling actions of GLP-1 involves the inhibition of PDGF-BB-induced VSMC dedifferentiation through a mitochondrial dynamics-dependent mechanism.
Acknowledgments
This research was funded in part by Comision Nacional de Ciencia y Tecnologia (CONICYT), Chile (FONDECYT 1110180 and 1140329 to M.C.; FONDAP 15130011 to M.C.). HL113167 from the National Institute of Health (to ASM). P.M. and DM-R hold CONICYT PhD fellowships. The authors finally thanks Fidel Albornoz and Gindra Latorre for their excellent technical assistance and Roberto Bravo for his help on image analysis.
Abbreviations
- ΔΨm
mitochondrial membrane potential
- Drp1
dynamin related protein 1
- Fis1
fission protein 1
- GAPDH
glyceraldehyde 3-phosphate dehydrogenase
- GLP-1
glucagon-like peptide-1
- Mfn1/2
mitofusin-1/2
- MTO
MitoTracker Orange
- OCR
oxygen consumption rate
- Opa1
optic atrophy 1 protein
- PDGF-BB
platelet-derived growth factor-BB
- PKA
protein kinase A
- ROS
reactive oxygen species
- VSMC
vascular smooth muscle cells
References
- 1.Holst JJ, Orskov C, Nielsen OV, Schwartz TW. Truncated glucagon-like peptide I, an insulin-releasing hormone from the distal gut. FEBS Lett. 1987;211:169–74. doi: 10.1016/0014-5793(87)81430-8. [DOI] [PubMed] [Google Scholar]
- 2.Mojsov S, Weir GC, Habener JF. Insulinotropin: glucagon-like peptide I (7–37) co-encoded in the glucagon gene is a potent stimulator of insulin release in the perfused rat pancreas. J Clin Invest. 1987;79:616–9. doi: 10.1172/JCI112855. [DOI] [PMC free article] [PubMed] [Google Scholar]
- 3.Kendall DM, Riddle MC, Rosenstock J, Zhuang D, Kim DD, Fineman MS, et al. Effects of exenatide (exendin-4) on glycemic control over 30 weeks in patients with type 2 diabetes treated with metformin and a sulfonylurea. Diabetes Care. 2005;28:1083–91. doi: 10.2337/diacare.28.5.1083. [DOI] [PubMed] [Google Scholar]
- 4.Creutzfeldt W, Ebert R. New developments in the incretin concept. Diabetologia. 1985;28:565–73. doi: 10.1007/BF00281990. [DOI] [PubMed] [Google Scholar]
- 5.Grieve DJ, Cassidy RS, Green BD. Emerging cardiovascular actions of the incretin hormone glucagon-like peptide-1: potential therapeutic benefits beyond glycaemic control? Br J Pharmacol. 2009;157:1340–51. doi: 10.1111/j.1476-5381.2009.00376.x. [DOI] [PMC free article] [PubMed] [Google Scholar]
- 6.Mudaliar S, Henry RR. Incretin therapies: effects beyond glycemic control. Eur J Intern Med. 2009;20(Suppl 2):S319–28. doi: 10.1016/j.ejim.2009.05.010. [DOI] [PubMed] [Google Scholar]
- 7.Chiong M, Morales P, Torres G, Gutierrez T, Garcia L, Ibacache M, et al. Influence of glucose metabolism on vascular smooth muscle cell proliferation. Vasa. 2013;42:8–16. doi: 10.1024/0301-1526/a000243. [DOI] [PubMed] [Google Scholar]
- 8.Campbell GR, Campbell JH. Smooth muscle phenotypic changes in arterial wall homeostasis: implications for the pathogenesis of atherosclerosis. Exp Mol Pathol. 1985;42:139–62. doi: 10.1016/0014-4800(85)90023-1. [DOI] [PubMed] [Google Scholar]
- 9.Rzucidlo EM, Martin KA, Powell RJ. Regulation of vascular smooth muscle cell differentiation. J Vasc Surg. 2007;45(Suppl A):A25–32. doi: 10.1016/j.jvs.2007.03.001. [DOI] [PubMed] [Google Scholar]
- 10.Kuzmicic J, Del Campo A, Lopez-Crisosto C, Morales PE, Pennanen C, Bravo-Sagua R, et al. Mitochondrial dynamics: a potential new therapeutic target for heart failure. Rev Esp Cardiol. 2011;64:916–23. doi: 10.1016/j.recesp.2011.05.018. [DOI] [PubMed] [Google Scholar]
- 11.Parra V, Verdejo H, del Campo A, Pennanen C, Kuzmicic J, Iglewski M, et al. The complex interplay between mitochondrial dynamics and cardiac metabolism. J Bioenerg Biomembr. 2011;43:47–51. doi: 10.1007/s10863-011-9332-0. [DOI] [PMC free article] [PubMed] [Google Scholar]
- 12.Morales PE, Torres G, Sotomayor-Flores C, Pena-Oyarzun D, Rivera-Mejias P, Paredes F, et al. GLP-1 promotes mitochondrial metabolism in vascular smooth muscle cells by enhancing endoplasmic reticulum-mitochondria coupling. Biochem Biophys Res Commun. 2014;446:410–6. doi: 10.1016/j.bbrc.2014.03.004. [DOI] [PubMed] [Google Scholar]
- 13.Hom J, Yu T, Yoon Y, Porter G, Sheu SS. Regulation of mitochondrial fission by intracellular Ca2+ in rat ventricular myocytes. Biochim Biophys Acta. 2010;1797:913–21. doi: 10.1016/j.bbabio.2010.03.018. [DOI] [PMC free article] [PubMed] [Google Scholar]
- 14.Parra V, Eisner V, Chiong M, Criollo A, Moraga F, Garcia A, et al. Changes in mitochondrial dynamics during ceramide-induced cardiomyocyte early apoptosis. Cardiovasc Res. 2008;77:387–97. doi: 10.1093/cvr/cvm029. [DOI] [PubMed] [Google Scholar]
- 15.Parra V, Verdejo HE, Iglewski M, Del Campo A, Troncoso R, Jones D, et al. Insulin stimulates mitochondrial fusion and function in cardiomyocytes via the Akt-mTOR-NFkappaB-Opa-1 signaling pathway. Diabetes. 2014;63:75–88. doi: 10.2337/db13-0340. [DOI] [PMC free article] [PubMed] [Google Scholar]
- 16.Manders EMM, Verbeek EJ, Aten JA. Measurement of co-localization of objects in dual-colour confocal images. Journal of Microscopy. 1993;169:375–82. doi: 10.1111/j.1365-2818.1993.tb03313.x. [DOI] [PubMed] [Google Scholar]
- 17.Zhang L, Peppel K, Sivashanmugam P, Orman ES, Brian L, Exum ST, et al. Expression of tumor necrosis factor receptor-1 in arterial wall cells promotes atherosclerosis. Arterioscler Thromb Vasc Biol. 2007;27:1087–94. doi: 10.1161/ATVBAHA.0000261548.49790.63. [DOI] [PMC free article] [PubMed] [Google Scholar]
- 18.Chang MW, Barr E, Lu MM, Barton K, Leiden JM. Adenovirus-mediated over-expression of the cyclin/cyclin-dependent kinase inhibitor, p21 inhibits vascular smooth muscle cell proliferation and neointima formation in the rat carotid artery model of balloon angioplasty. J Clin Invest. 1995;96:2260–8. doi: 10.1172/JCI118281. [DOI] [PMC free article] [PubMed] [Google Scholar]
- 19.Chang CR, Blackstone C. Cyclic AMP-dependent protein kinase phosphorylation of Drp1 regulates its GTPase activity and mitochondrial morphology. J Biol Chem. 2007;282:21583–7. doi: 10.1074/jbc.C700083200. [DOI] [PubMed] [Google Scholar]
- 20.del Campo A, Parra V, Vasquez-Trincado C, Gutierrez T, Morales PE, Lopez-Crisosto C, et al. Mitochondrial fragmentation impairs insulin-dependent glucose uptake by modulating Akt activity through mitochondrial Ca2+ uptake. Am J Physiol Endocrinol Metab. 2014;306:E1–E13. doi: 10.1152/ajpendo.00146.2013. [DOI] [PubMed] [Google Scholar]
- 21.Cassidy-Stone A, Chipuk JE, Ingerman E, Song C, Yoo C, Kuwana T, et al. Chemical inhibition of the mitochondrial division dynamin reveals its role in Bax/Bak-dependent mitochondrial outer membrane permeabilization. Dev Cell. 2008;14:193–204. doi: 10.1016/j.devcel.2007.11.019. [DOI] [PMC free article] [PubMed] [Google Scholar]
- 22.Tanaka A, Youle RJ. A chemical inhibitor of DRP1 uncouples mitochondrial fission and apoptosis. Mol Cell. 2008;29:409–10. doi: 10.1016/j.molcel.2008.02.005. [DOI] [PubMed] [Google Scholar]
- 23.Ong SB, Hall AR, Hausenloy DJ. Mitochondrial dynamics in cardiovascular health and disease. Antioxid Redox Signal. 2013;19:400–14. doi: 10.1089/ars.2012.4777. [DOI] [PMC free article] [PubMed] [Google Scholar]
- 24.Duchen MR. Mitochondria in health and disease: perspectives on a new mitochondrial biology. Mol Aspects Med. 2004;25:365–451. doi: 10.1016/j.mam.2004.03.001. [DOI] [PubMed] [Google Scholar]
- 25.Kodde IF, van der Stok J, Smolenski RT, de Jong JW. Metabolic and genetic regulation of cardiac energy substrate preference. Comp Biochem Physiol A Mol Integr Physiol. 2007;146:26–39. doi: 10.1016/j.cbpa.2006.09.014. [DOI] [PubMed] [Google Scholar]
- 26.Butler TM, Siegman MJ. High-energy phosphate metabolism in vascular smooth muscle. Annu Rev Physiol. 1985;47:629–43. doi: 10.1146/annurev.ph.47.030185.003213. [DOI] [PubMed] [Google Scholar]
- 27.Paul RJ. Functional compartmentalization of oxidative and glycolytic metabolism in vascular smooth muscle. Am J Physiol Cell Physiol. 1983;244:C399–409. doi: 10.1152/ajpcell.1983.244.5.C399. [DOI] [PubMed] [Google Scholar]
- 28.Pon LA. Mitochondrial fission: rings around the organelle. Curr Biol. 2013;23:R279–81. doi: 10.1016/j.cub.2013.02.042. [DOI] [PMC free article] [PubMed] [Google Scholar]
- 29.Korobova F, Ramabhadran V, Higgs HN. An actin-dependent step in mitochondrial fission mediated by the ER-associated formin INF2. Science. 2013;339:464–7. doi: 10.1126/science.1228360. [DOI] [PMC free article] [PubMed] [Google Scholar]
- 30.Cribbs JT, Strack S. Reversible phosphorylation of Drp1 by cyclic AMP-dependent protein kinase and calcineurin regulates mitochondrial fission and cell death. EMBO Rep. 2007;8:939–44. doi: 10.1038/sj.embor.7401062. [DOI] [PMC free article] [PubMed] [Google Scholar]
- 31.Sorianello E, Soriano FX, Fernandez-Pascual S, Sancho A, Naon D, Vila-Caballer M, et al. The promoter activity of human Mfn2 depends on Sp1 in vascular smooth muscle cells. Cardiovasc Res. 2012;94:38–47. doi: 10.1093/cvr/cvs006. [DOI] [PubMed] [Google Scholar]
- 32.Rohlff C, Ahmad S, Borellini F, Lei J, Glazer RI. Modulation of transcription factor Sp1 by cAMP-dependent protein kinase. J Biol Chem. 1997;272:21137–41. doi: 10.1074/jbc.272.34.21137. [DOI] [PubMed] [Google Scholar]
- 33.Chen KH, Guo X, Ma D, Guo Y, Li Q, Yang D, et al. Dysregulation of HSG triggers vascular proliferative disorders. Nat Cell Biol. 2004;6:872–83. doi: 10.1038/ncb1161. [DOI] [PubMed] [Google Scholar]
- 34.Zhou W, Chen KH, Cao W, Zeng J, Liao H, Zhao L, et al. Mutation of the protein kinase A phosphorylation site influences the anti-proliferative activity of mitofusin 2. Atherosclerosis. 2010;211:216–23. doi: 10.1016/j.atherosclerosis.2010.02.012. [DOI] [PubMed] [Google Scholar]
- 35.Salabei JK, Hill BG. Mitochondrial fission induced by platelet-derived growth factor regulates vascular smooth muscle cell bioenergetics and cell proliferation. Redox Biol. 2013;1:542–51. doi: 10.1016/j.redox.2013.10.011. [DOI] [PMC free article] [PubMed] [Google Scholar]
- 36.Marsboom G, Toth PT, Ryan JJ, Hong Z, Wu X, Fang YH, et al. Dynamin-related protein 1-mediated mitochondrial mitotic fission permits hyperproliferation of vascular smooth muscle cells and offers a novel therapeutic target in pulmonary hypertension. Circ Res. 2012;110:1484–97. doi: 10.1161/CIRCRESAHA.111.263848. [DOI] [PMC free article] [PubMed] [Google Scholar]
- 37.Guo YH, Chen K, Gao W, Li Q, Chen L, Wang GS, et al. Overexpression of Mitofusin 2 inhibited oxidized low-density lipoprotein induced vascular smooth muscle cell proliferation and reduced atherosclerotic lesion formation in rabbit. Biochem Biophys Res Commun. 2007;363:411–7. doi: 10.1016/j.bbrc.2007.08.191. [DOI] [PubMed] [Google Scholar]
- 38.Wang L, Yu T, Lee H, O'Brien DK, Sesaki H, Yoon Y. Decreasing mitochondrial fission diminishes vascular smooth muscle cell migration and ameliorates intimal hyperplasia. Cardiovasc Res. 2015;106:272–83. doi: 10.1093/cvr/cvv005. [DOI] [PMC free article] [PubMed] [Google Scholar]
- 39.Wan YY, Zhang JF, Yang ZJ, Jiang LP, Wei YF, Lai QN, et al. Involvement of Drp1 in hypoxia-induced migration of human glioblastoma U251 cells. Oncol Rep. 2014;32:619–26. doi: 10.3892/or.2014.3235. [DOI] [PubMed] [Google Scholar]
- 40.Zhao J, Zhang J, Yu M, Xie Y, Huang Y, Wolff DW, et al. Mitochondrial dynamics regulates migration and invasion of breast cancer cells. Oncogene. 2013;32:4814–24. doi: 10.1038/onc.2012.494. [DOI] [PMC free article] [PubMed] [Google Scholar]
- 41.Rizzo M, Rizvi AA, Spinas GA, Rini GB, Berneis K. Glucose lowering and anti-atherogenic effects of incretin-based therapies: GLP-1 analogues and DPP-4-inhibitors. Expert Opin Investig Drugs. 2009;18:1495–503. doi: 10.1517/14728220903241633. [DOI] [PubMed] [Google Scholar]
- 42.Goto H, Nomiyama T, Mita T, Yasunari E, Azuma K, Komiya K, et al. Exendin-4, a glucagon-like peptide-1 receptor agonist, reduces intimal thickening after vascular injury. Biochem Biophys Res Commun. 2011;405:79–84. doi: 10.1016/j.bbrc.2010.12.131. [DOI] [PubMed] [Google Scholar]
- 43.Arakawa M, Mita T, Azuma K, Ebato C, Goto H, Nomiyama T, et al. Inhibition of monocyte adhesion to endothelial cells and attenuation of atherosclerotic lesion by a glucagon-like peptide-1 receptor agonist, exendin-4. Diabetes. 2010;59:1030–7. doi: 10.2337/db09-1694. [DOI] [PMC free article] [PubMed] [Google Scholar]
- 44.Murthy SN, Hilaire RC, Casey DB, Badejo AM, McGee J, McNamara DB, et al. The synthetic GLP-I receptor agonist, exenatide, reduces intimal hyperplasia in insulin resistant rats. Diab Vasc Dis Res. 2010;7:138–44. doi: 10.1177/1479164109360269. [DOI] [PubMed] [Google Scholar]
- 45.Nagashima M, Watanabe T, Terasaki M, Tomoyasu M, Nohtomi K, Kim-Kaneyama J, et al. Native incretins prevent the development of atherosclerotic lesions in apolipoprotein E knockout mice. Diabetologia. 2011;54:2649–59. doi: 10.1007/s00125-011-2241-2. [DOI] [PMC free article] [PubMed] [Google Scholar]
- 46.Rizvi AA, Patti AM, Giglio RV, Nikolic D, Amato A, Al-Busaidi N, et al. Liraglutide improves carotid intima-media thickness in patients with type 2 diabetes and non-alcoholic fatty liver disease: an 8-month prospective pilot study. Expert Opin Biol Ther. 2015;15:1391–7. doi: 10.1517/14712598.2015.1067299. [DOI] [PubMed] [Google Scholar]