Abstract
Background
In the accompanying article, we showed that activation of PPARα signaling by fenofibrate and tesaglitazar decreases ethanol consumption in mice. In this study, we determined the role of these PPAR agonists in ethanol-related behaviors and other actions that may be important in regulating ethanol consumption.
Methods
The effects of fenofibrate (150 mg/kg) and tesaglitazar (1.5 mg/kg) were examined on the following behaviors and effects in male and female C57BL/6J (B6) and B6 × 129S4 mice: preference for saccharin, ethanol-induced conditioned place preference, conditioned taste aversion, loss of righting reflex, and withdrawal, acoustic startle reflex, response to novelty, and ethanol clearance. Because the B6 inbred strain usually displays weak ethanol-induced conditioned place preference and weak ethanol-induced acute withdrawal, B6 × 129S4 mice were also studied.
Results
Fenofibrate and tesaglitazar decreased the novelty response and increased acute ethanol withdrawal severity, and fenofibrate increased ethanol-induced conditioned taste aversion. Two important factors for ethanol consumption (saccharin preference and ethanol-induced conditioned place preference) were not altered by fenofibrate or tesaglitazar. Ethanol clearance was increased by both fenofibrate and tesaglitazar. Response to novelty, acute withdrawal, and ethanol clearance show sex differences and could contribute to the reduced ethanol consumption following fenofibrate administration.
Conclusions
These studies indicate the complexity of ethanol-dependent and -independent behaviors that are altered by PPAR agonists and provide evidence for novel behavioral actions of these drugs that may contribute to PPAR-mediated effects on alcohol drinking.
Keywords: fenofibrate, tesaglitazar, conditioned place preference, conditioned taste aversion, ethanol withdrawal and sedation
Introduction
In our companion manuscript (Blednov et al., in press), we show that the PPAR agonists, fenofibrate and tesaglitazar, reduced ethanol intake in C57BL/6J mice in a PPARα-selective manner and this effect depended on sex as well as the test used for measuring ethanol consumption. The strongest reduction of ethanol intake was observed in the continuous two-bottle choice paradigm, which models a complex behavior that is positively and negatively correlated with several other ethanol-related behaviors (Blednov et al., 2012, Green and Grahame, 2008). For example, conditioned taste aversion (CTA) is negatively correlated with voluntary ethanol intake (Blednov et al., 2012, Green and Grahame, 2008, Risinger and Cunningham, 1998). Alcohol withdrawal severity is also negatively correlated with alcohol consumption (Belknap et al., 2008, Hitzemann et al., 2009, Metten et al., 1998). Perhaps the most robust positive correlation is with consumption of sweet solutions, as shown in studies of inbred strains, hybrid mice, and taste-deficient mutants (Bachmanov et al., 1996, Blednov et al., 2008, Yoneyama et al., 2008). There is a positive correlation between response to novelty and alcohol consumption (Blednov et al., 2012), and the clinical literature suggests a relationship between novelty seeking and alcohol craving and relapse in alcohol-dependent patients (Evren et al., 2012). In addition, the rewarding properties of ethanol measured using conditioned place preference (CPP) show a positive correlation with ethanol consumption (Green and Grahame, 2008).
In this study, we determined if fenofibrate or tesaglitazar altered the behaviors discussed above in a manner consistent with their ability to decrease ethanol consumption. We also evaluated startle response, ethanol-induced loss of righting reflex, and clearance of ethanol, representing an extensive panel of tests in male and female mice designed to provide a comprehensive in vivo analysis of PPAR agonists that are important in alcohol drinking.
Materials and Methods
Mice
Male and female C57BL/6J (B6) mice were taken from a colony maintained at The University of Texas at Austin (original breeders were purchased from Jackson Laboratories, Bar Harbor, ME). In addition to B6 inbred mice, wild-type mice from a colony lacking the ρ1 subunit of the GABAA receptor (B6;129S4-Gabrr1tm1Llu/J , stock # 010535) (Jackson Laboratories, Bar Harbor, ME) were used in some experiments. Mice were group-housed 4–5 to a cage. Food and water were available ad libitum. The vivarium was maintained on a 12:12 hour light:dark cycle with lights on at 7:00 a.m.; however, for studies of ethanol and saccharin intake, mice were housed on a reverse light cycle. The temperature and humidity of the rooms were kept constant. Baseline drinking and other experiments began when the mice were 2–3 months old. All experiments were approved by the Institutional Animal Care and Use Committee at The University of Texas at Austin.
Drug Administration
Fenofibrate (150 mg/kg) and tesaglitazar (1.5 mg/kg) were administered orally by gavage (p.o.). Sulforaphane (12 mg/kg) and Alda-1 (50 mg/kg) were administered intraperitoneally (i.p.) 30 minutes before the drinking session. Drugs were purchased from Sigma-Aldrich (St. Louis, MO) and Tocris Bioscience (Minneapolis, MN). All drugs were freshly prepared as suspensions in saline with 4–5 drops of Tween-80 and administered once daily in a volume 0.05 ml/10 g of body weight (for oral administration), 0.1 ml/10g of body weight (for intraperitoneal administration). Saline containing 4–5 drops of Tween-80 was administered to control groups. Single use, sterile Becton, Dickinson and Co. gavage needles (27.5 gauge; model #305109) were used. When measuring the acute effects of ethanol (acute withdrawal, loss of righting reflex, ethanol clearance, motor response to novelty, and startle reflex), mice were treated daily with saline or drugs for 8 days. In contrast, when testing behavioral responses after chronic treatment with ethanol (conditioned taste aversion and conditioned place preference), mice were treated with saline or drugs daily for the duration of the experiment.
Preference for Saccharin
Saccharin consumption and preference were measured according to the two-bottle choice procedure described for ethanol intake in our companion study (Blednov et al., in press). The experimental rooms used for all drinking experiments were maintained on a reversed 12:12 hour light:dark cycle with lights off at 10:00 a.m. Before beginning experiments, mice were moved to their experimental rooms and remained there for at least 2 weeks to adapt to the reversed light cycle.
Motor Response to Novelty
Locomotor activity was measured in standard mouse cages using the Opto-microvarimex animal activity meter (Columbus Instruments, Columbus, OH). Activity was monitored by 6 light beams placed along the width of the cage at 2.5-cm intervals, 1.5 cm above the floor. Each cage had bedding and food and was covered by a heavy plastic lid with holes for ventilation. On the day of the experiment, mice were placed in individual experimental cages, and activity was monitored every 5 minutes for 60 minutes. Saline or drugs were administered daily for 8 days. Experiments were carried out the day after the last injection.
Conditioned Place Preference (CPP)
The CPP protocol was carried out as described in (Blednov et al., 2003), and the main principles of CPP are described in (Cunningham et al., 1993). Four identical acrylic boxes (30 × 15 × 15 cm) were separately enclosed in ventilated, light, and sound-attenuating chambers (Med Associates, St. Albans, VT). Each box had two compartments separated by a wall with a door. The compartments each contained a different type of floor (either bars set in a grid or small round holes). Infrared light sources and photodetectors were mounted opposite each other at 2.5-cm intervals along the length of each box, 2.2 cm above the floor. Occlusion of the infrared light beams was used to measure general activity and location of the animal (left or right compartment) within the box. Total activity counts and location of the animal (left or right) within the box were recorded by computer. The floors and the inside of the boxes were wiped with water, and the litter paper beneath the floors was changed between animals. Ethanol (2.0 g/kg) was administered i.p.. Saline or drugs were given daily 3 hours before the experimental session.
Conditioned Taste Aversion (CTA)
Mice were adapted to a water-restricted schedule (2 hours of water per day) over a 7-day period. At 48-hour intervals over days 1, 3, 5, 7, 9 and 11, all mice received 1-hour access to a solution of saccharin (0.15% w/v sodium saccharin in tap water). Immediately after 1-hour access to saccharin, mice received injections of saline or ethanol (2.0 g/kg). All mice also received 30-minute access to tap water 5 hours after each saccharin-access period to prevent dehydration. On intervening days, mice had 2-hour continuous access to water at standard times in the morning. Reduced consumption of the saccharin solution is used as a measure of CTA. Drug treatment was started 2 days before the first control session with saccharin. Saline or drugs were given daily 3 hours before experimental or control sessions.
Ethanol-induced Acute Withdrawal
Mice were scored for handling-induced convulsion (HIC) severity 30 minutes before and immediately before ethanol administration, and the two pre-drug baseline scores were averaged. A dose of 4.0 g/kg of ethanol in saline was injected i.p., and the HIC score was tested every hour until the HIC level reached baseline. Acute withdrawal was quantified as the area under the curve but above the pre-drug level (Crabbe et al., 1991). Briefly, each mouse was picked up gently by the tail and, if necessary, gently rotated 180°, and the HIC was scored as follows: 5, tonic-clonic convulsion when lifted; 4, tonic convulsion when lifted; 3, tonic-clonic convulsion after a gentle spin; 2, no convulsion when lifted, but tonic convulsion elicited by a gentle spin; 1, facial grimace only after a gentle spin; 0, no convulsion. Saline or drugs were given daily for 8 days. Experiments were carried out the day after the last injection.
Loss of Righting Reflex (LORR)
Sensitivity to the depressant effects of ethanol (3.6 g/kg) was determined using the standard duration of LORR (sleep time) in mice. When mice became ataxic, they were placed in the supine position in V-shaped plastic troughs until they were able to right themselves 3 times within 30 s. Sleep time was defined as the time from being placed in the supine position until they regained their righting reflex. Saline or drugs were given daily for 8 days, and experiments were carried out the day after the last injection.
Startle Reflex
Acoustic startle responses were measured using SR-LAB test stations and software (San Diego Instruments, San Diego, CA) and recorded as described previously (Findlay et al., 2003). Briefly, test sessions began by placing the mouse in a Plexiglas holding cylinder for a 5-minute acclimation period. Over the next 8 minutes, mice were presented with each of 7 trial types across 5 discrete blocks of trials for a total of 35 trials. The inter-trial interval was 10–20 s. One trial measured the response to no stimulus (baseline movement). The other 6 trials measured the response to a startle stimulus alone, consisting of a 40-ms sound burst of 90, 95, 100, 105, 110 or 115 dB. Startle response amplitude was measured every 1 ms over a 65-ms period beginning at the onset of the startle stimulus. The 6 trial types were presented in pseudorandom order such that each trial type was presented once within a block of 6 trials. The maximum startle amplitude (Vmax) over this sampling period was taken as the dependent variable. A background noise level of 70 dB was maintained over the duration of the test session. Saline or drugs were given daily for 8 days. Experiments were carried out the day after the last injection.
Ethanol Clearance
Animals were given a single dose of ethanol (4.0 g/kg, i.p.), and blood samples were taken from the retro-orbital sinus 30, 60, 120, 180, and 240 minutes after injection. Blood ethanol concentration (BEC) values, expressed as mg ethanol per ml blood, were determined spectrophotometrically by an enzyme assay (Lundquist, 1959). Saline or drugs were given daily for 8 days. Experiments were carried out the day after the last injection.
Statistical Analyses
The number of mice in each group is shown in the Supplemental Tables and Figure Legends. Data are reported as the mean ± S.E.M. The statistics software program GraphPad Prism (GraphPad Software, Inc., La Jolla, CA) was used to perform one-way or two-way repeated measures ANOVA and Bonferroni post hoc tests.
Results
Saccharin Consumption
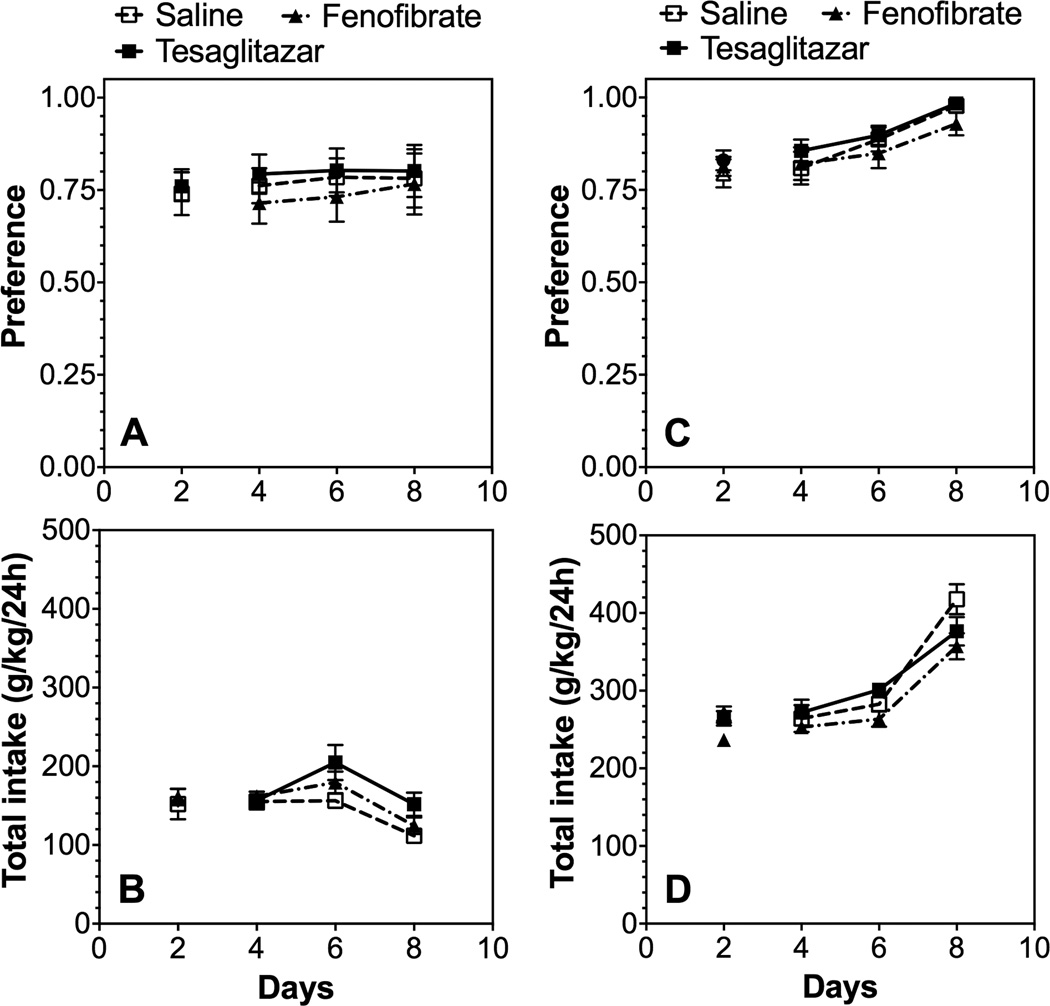
In the two-bottle choice test (continuous 24-hour access to saccharin and water), fenofibrate or tesaglitazar did not change preference for saccharin in male or female B6 mice (Fig. 1; Supplemental Table 1). Total intake was increased by tesaglitazar in male mice only.
Figure 1. Fenofibrate and tesaglitazar did not alter preference for saccharin in the 24-hour two-bottle choice test in B6 mice.
After 1 week of 0.0099% saccharin consumption, consumption was measured (g/kg/24h) after 2 days of saline administration and mice were grouped to provide similar levels of saccharin intake and preference. Beginning on day 3, saline or drugs were administered and intake averaged over 2-day periods using different bottle positions. A, B. Preference for saccharin and total fluid intake in male mice (n=6 per group). C, D. Preference for saccharin and total fluid intake in female mice (n=10 per group). Data were analyzed by two-way repeated measures ANOVA followed by Bonferroni’s post hoc test for multiple comparisons.
Motor Response to Novelty
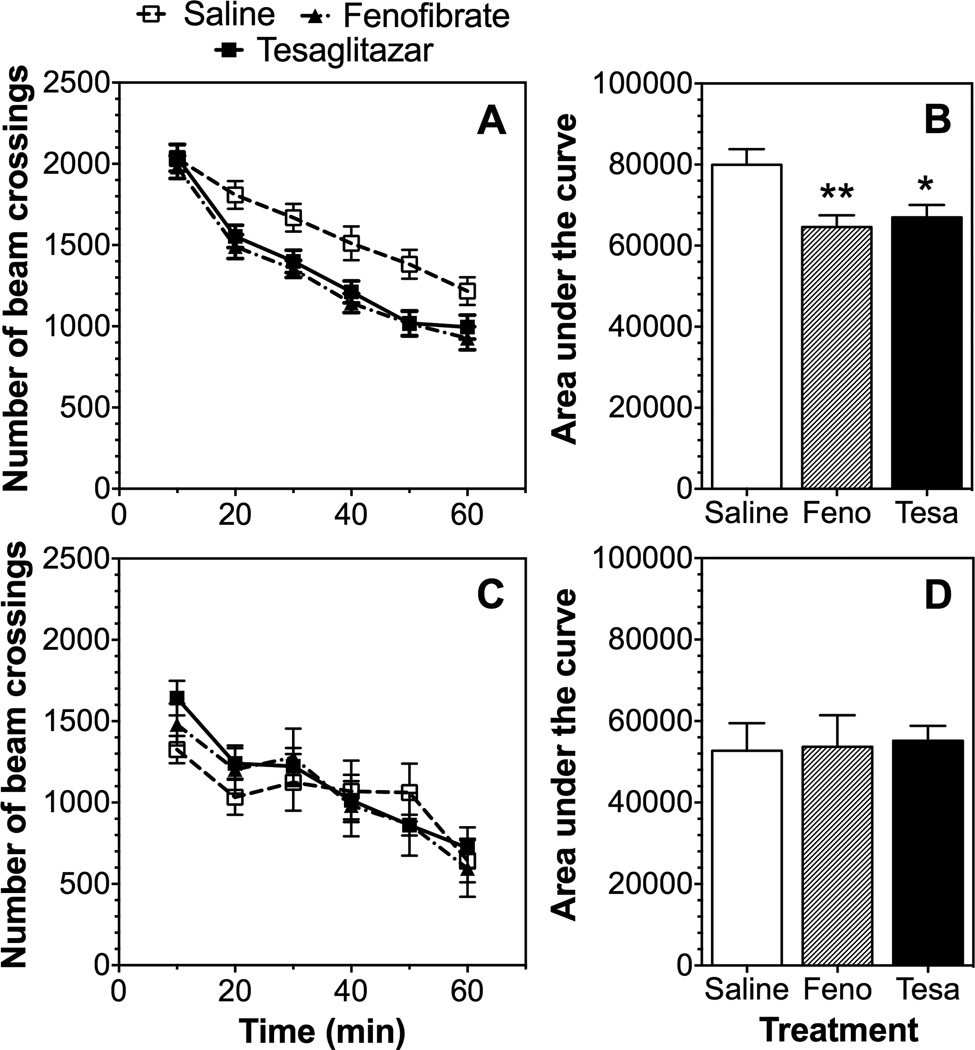
We compared the effect of pre-treatment (8 daily injections) with fenofibrate or tesaglitazar on response to a novel environment in male and female B6 mice. Male mice pre-treated with either drug showed reduced motor responses to a novel environment [F(1,48)=36.7, p<0.0001 treatment; F(5,240)=106, p<0.0001 time; F(5,240)=3.2, p<0.01 time x treatment interaction for fenofibrate and F(1,48)=5.9, p<0.05 treatment; F(5,240)=97.9, p<0.0001 time; F(5,240)=3.3, p<0.01 time x treatment for tesaglitazar] (Fig. 2 A). Comparison of the area under the curve for the period of observation also showed a modest but significant reduction of motor responses in male mice treated with either drug [F(2,72)=6.3, p<0.01] (Fig. 2 B). Control and drug-treated female mice showed a time dependence [F(5,90)=18.6, p<0.0001 for fenofibrate and F(5,90)=19.3, p<0.0001 for tesaglitazar] but no differences between control and drug-treated groups were found (Fig. 2 C, D).
Figure 2. Effects of fenofibrate and tesaglitazar on motor response to novelty in B6 mice.
A, B. Number of beam crossings and area under the curve after 1.5 mg/kg tesaglitazar (Tesa) or 150 mg/kg fenofibrate (Feno) in male mice (n=25 per group). C, D. Number of beam crossings and area under the curve in female mice (n=10 per group). Data were analyzed by two-way repeated measures ANOVA followed by Bonferroni’s test (*p<0.05, **p<0.01 compared to control).
Conditioned Place Preference (CPP)
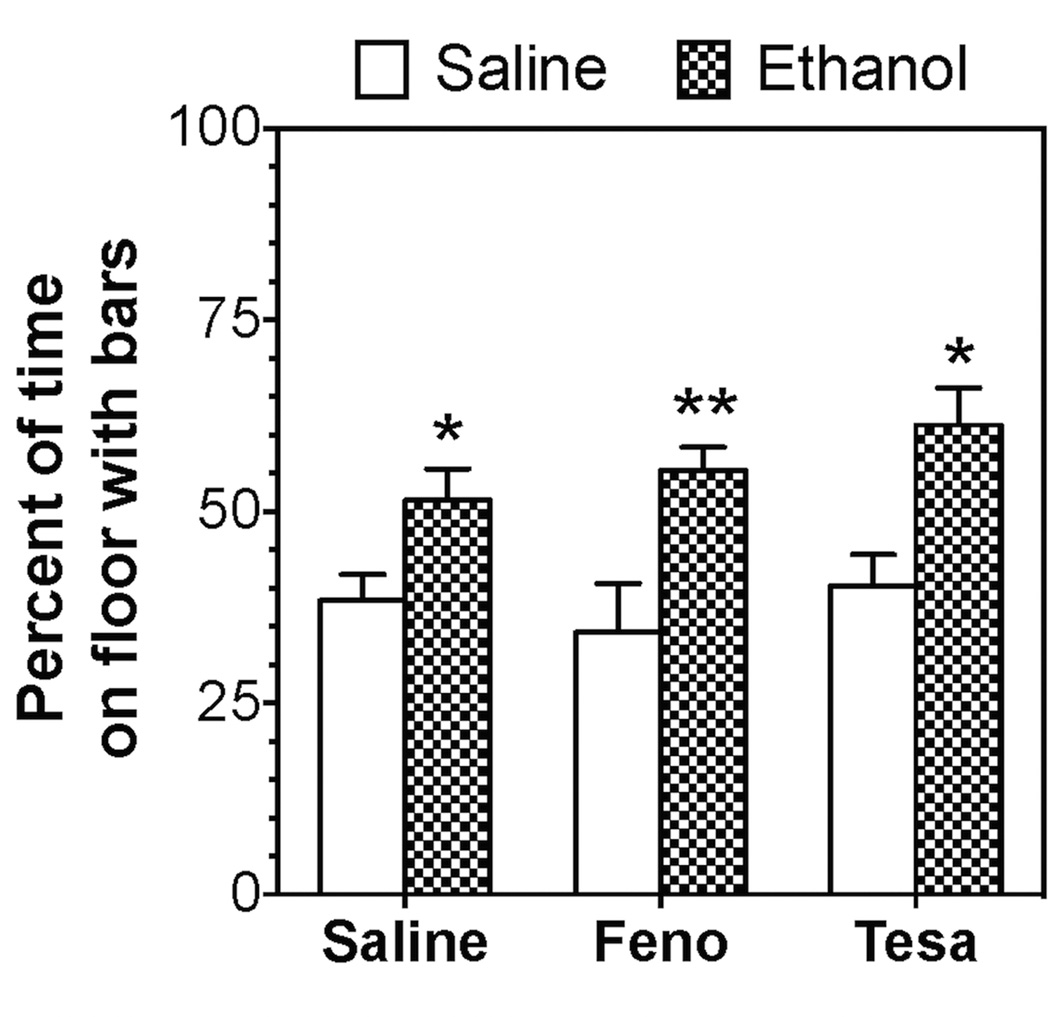
The B6 inbred strain does not always show robust ethanol-induced CPP (Cunningham et al., 1992). Therefore, experiments were carried out with B6 × 129S4 mice because they develop ethanol-induced CPP (Blednov et al., 2014). These mice prefer the floor with holes rather than the floor with bars, so ethanol was paired with the bar floor. Male mice from all 3 groups spent more time on the bar floor when paired with ethanol than when paired with saline, reflecting development of CPP [F(1,65)=23.5, p<0.001]. However, there was no effect of drug pre-treatment on the development of CPP (Fig. 3).
Figure 3. Fenofibrate and tesaglitazar did not alter ethanol-induced conditioned place preference in B6 × 129S4 male mice.
Data represent the percent of time spent on the floor with bars paired with administration of 2.0 g/kg ethanol [n=17–18 for saline control; n=10 for fenofibrate (Feno); n=8 for tesaglitazar (Tesa)]. Data were analyzed by two-way ANOVA followed by Bonferroni’s test (*p<0.05, **p<0.01 compared to corresponding control).
Conditioned Taste Aversion (CTA)
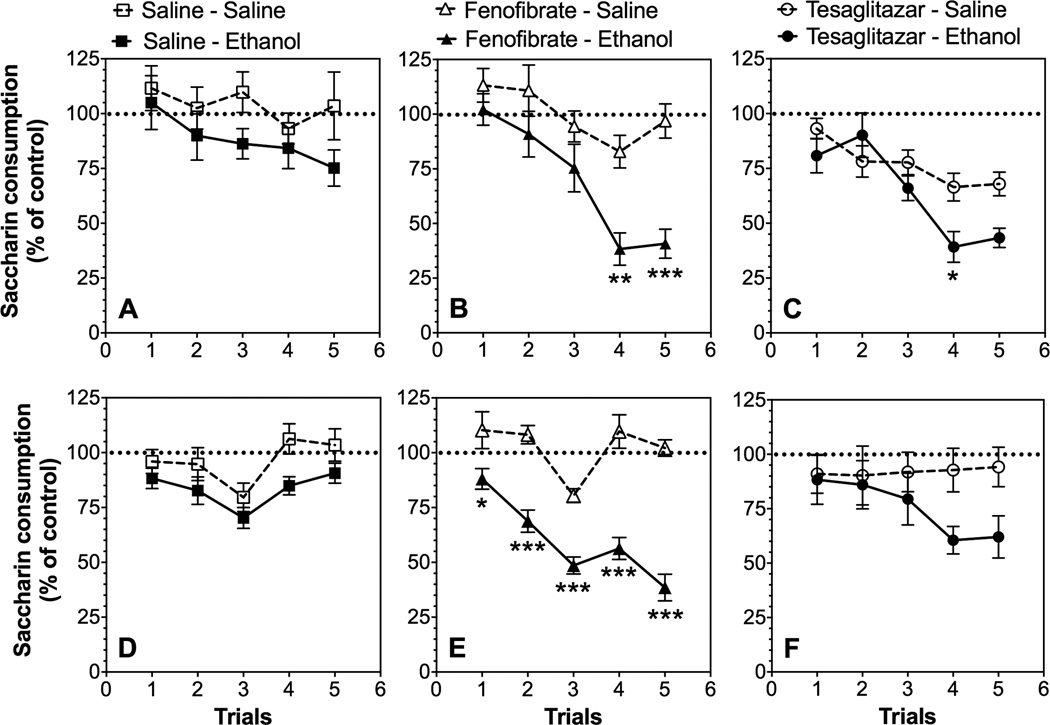
We expected that fenofibrate and tesaglitazar would increase CTA, so we used a low dose of ethanol (2.0 g/kg) that should produce little or no CTA. In order to minimize initial fluctuations in tastant intake and any small differences between sexes, intake was calculated as a percentage of the trial 0 consumption for each subject by dividing the amount of saccharin solution consumed on subsequent conditioning trials by the amount of saccharin solution consumed on trial 0 (before conditioning). In saline pre-treated male and female mice, ethanol-saccharin pairings did not significantly reduce saccharin intake across trials, indicating the lack of development of CTA (Fig. 4 A, D; Supplemental Table 2). Fenofibrate significantly potentiated the development of CTA for ethanol in males [F(1,17)=8.8, p<0.01 treatment; F(4,68)=6.4, p<0.01 interaction] and females [F(1,22)=58, p<0.001 treatment; F(4,88)=7.5, p<0.001 interaction] (Fig. 4 B, E). In contrast, tesaglitazar did not induce CTA after administration of ethanol, and only an interaction effect was found [F(4,72)=4.9, p<0.01 in males and females] (Fig. 4 C, F; Supplemental Table 2). Despite the significant interaction, the differences between the tesaglitazar-saline and tesaglitazar-ethanol groups did not reach significance in post hoc tests for any trials in female mice and were significant only for the fourth trial in male mice.
Figure 4. Effects of fenofibrate and tesaglitazar on ethanol-induced conditioned taste aversion in B6 mice.
Data represent the changes in saccharin consumption produced by injection of saline or 2.0 g/kg ethanol expressed as percent of the control trial (trial 0). Saccharin consumption in male mice pre-treated with: A. Saline (control); n=8–10 per group, B. Fenofibrate; n=9–10 per group, and C. Tesaglitazar; n=10 per group. Saccharin consumption in female mice pre-treated with: D. Saline (control); n=20–22 per group, E. Fenofibrate; n=12 per group, and F. Tesaglitazar; n=10 per group. Values represent mean ± S.E.M. Data were analyzed by two-way repeated measures ANOVA followed by Bonferroni’s test (*p<0.05; **p<0.01; ***p<0.001 compared to control).
Acute Ethanol Withdrawal
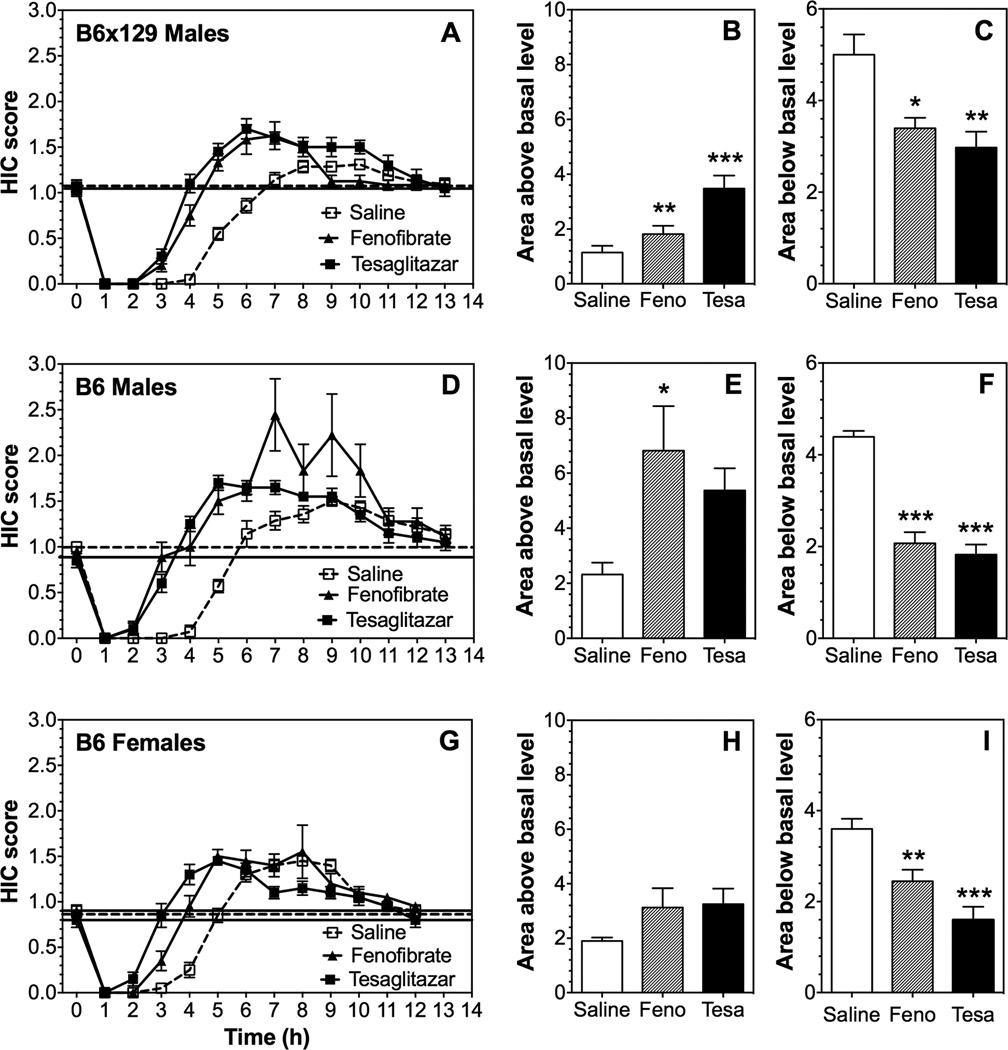
To test the generality of our findings with inbred B6 mice, we also studied B6 × 129S4 mice. A single 4.0 g/kg ethanol dose suppressed basal HIC in all mice for about 3–7 hours, followed by increased HIC (Fig. 5 A, D, G). Recovery of HIC up to the basal level (area below the basal level) was faster after pre-treatment with fenofibrate and tesaglitazar in male and female mice of both genotypes (Fig. 5 C, F, I). Fenofibrate and tesaglitazar increased the severity of acute withdrawal (area above the basal level) in male mice [one-way ANOVA: F(2,40)=12.8, p<0.001 for B6 × 129S4 mice and F(2,23)=3.7, p<0.05 for B6 mice] (Fig. 5 B, E). Post hoc analyses showed that pre-treatment with fenofibrate increased withdrawal severity in males of both genotypes, whereas the effect of tesaglitazar was observed only in male mice from the mixed genetic background. Pre-treatment with either drug did not significantly change the severity of withdrawal in B6 female mice [F(2,27)=1.9, p>0.05] (Fig. 5 H). In contrast, the protective effect of ethanol against HIC (area below the basal level) was significantly reduced in all mice [F(2,40)=7.1, p<0.01 for B6 × 129S4; F(2,23)=38.2, p<0.001 for B6 males, and F(2,27)=15.6, p<0.001 for B6 females] (Fig. 5 C, F, I). Post hoc analyses showed that pre-treatment with both drugs reduced the protective effect of ethanol in males of both genotypes, as well as in B6 female mice.
Figure 5. Effects of fenofibrate and tesaglitazar on the severity of ethanol-induced acute withdrawal in B6 and B6 × 129S4 mice.
A-C. HIC score and area under the curve (above basal) and area above the curve (below basal) in B6 × 129S4 male mice (n=21 for control; n=12 for fenofibrate; n=10 for tesaglitazar). D–F. HIC score and area under the curve (above basal) and area above the curve (below basal) in B6 male mice (n=7 for control; n=9 for fenofibrate; n=10 for tesaglitazar). G–I. HIC score and area under the curve (above basal) and area above the curve (below basal) in B6 female mice (n=10 for each group). Data were analyzed by one-way ANOVA followed by Bonferroni’s test (*p<0.05, **p<0.01, ***p<0.001 compared to saline control). Horizontal dashed and solid lines represent the basal HIC level for control and treated groups, respectively. Feno, fenofibrate; Tesa, tesaglitazar.
Loss of Righting Reflex (LORR) and Blood Ethanol Concentration (BEC) at Time of Regaining Righting Reflex
Because there is a positive correlation between the negative part of the HIC curve (protection from HIC) and duration of LORR (Blednov et al., 2012), we studied the effect of pre-treatment with fenofibrate or tesaglitazar on duration of LORR in male and female B6 mice and male B6 × 129S4 mice. Pre-treatment with these drugs reduced the duration of LORR in both sexes and genotypes (Fig. 6 A, C, D). BECs at the time of regaining the righting reflex were measured in B6 male mice and they were similar for control and treated mice (Fig. 6 B).
Figure 6. Fenofibrate and tesaglitazar reduce duration of ethanol-induced loss of righting reflex in B6 and B6 × 129S4 mice.
A. Duration of LORR (min) in B6 males (n=5–6 per group). B. BEC (mg/dl) at regaining of righting reflex (RORR) in B6 males. C. Duration of LORR (min) in B6 × 129S4 males (n=5–12 per group). D. Duration of LORR (min) in B6 females (n=5–6 per group). The ethanol dose was 3.6 g/kg. Data were analyzed by one-way ANOVA followed by Bonferroni’s test [***p<0.001 compared to control; ###p<0.001 comparison between fenofibrate (Feno) and tesaglitazar (Tesa)].
Startle Reflex
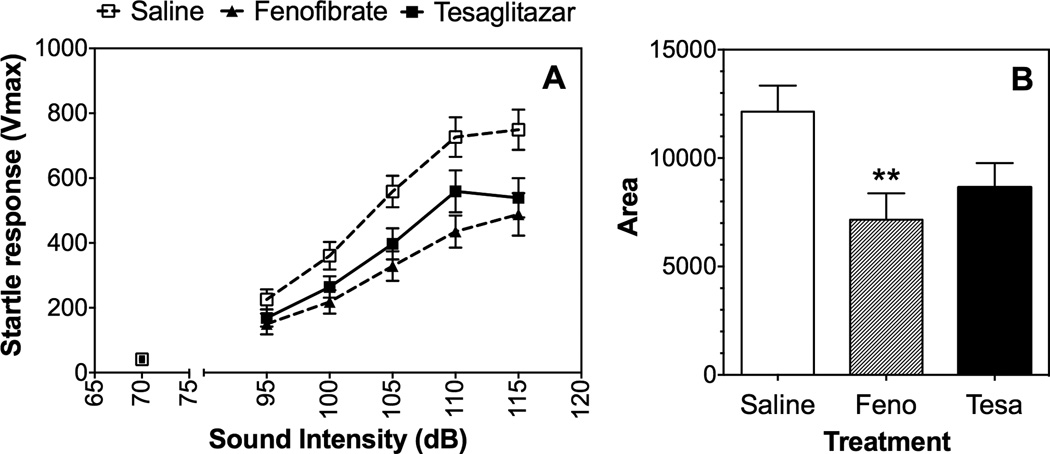
HICs are a sensitive index of CNS excitability (Crabbe et al., 1991) and reduction of the negative part of the HIC-score curve suggests that the drugs attenuated the ability of ethanol to reduce excitability. Acoustic startle response is another measure of excitability and there is a positive genetic correlation between basal startle responses and alcohol preference (Chester and Barrenha, 2007). Fenofibrate pre-treatment reduced the response to acoustic stimuli in B6 male mice [F(1,28)=10.9, p<0.01 treatment; F(4,112)=97, p<0.001 sound intensity; F(4,112)=5.7, p<0.001 treatment x sound intensity] (Fig. 7 A). Tesaglitazar produced a similar but more modest effect [F(1,28)=5.2, p<0.05 treatment; F(4,112)=97, p<0.001 sound intensity] (Fig. 7 A). To rule out potential differences in responses of different groups of mice to white noise, we calculated and compared the areas under the curves shown in Fig. 7 A. There was an effect of drug treatment [F(2,42)=4.7, p<0.05], but post hoc analyses showed that the effect was only significant for fenofibrate (Fig. 7 B).
Figure 7. Effects of fenofibrate and tesaglitazar on the acoustic startle response in B6 male mice.
A. Maximum startle amplitude (Vmax) as a function of sound intensity (decibels, dB) in male B6 mice (n=15 per each group). B. Area under the curve. Values represent mean ± S.E.M.. Raw data (A) were analyzed by two-way repeated measures ANOVA. Transformed data (B) were analyzed by one-way ANOVA followed by Bonferroni’s test (**p<0.01 compared to control). Feno, fenofibrate; Tesa, tesaglitazar.
Ethanol Clearance
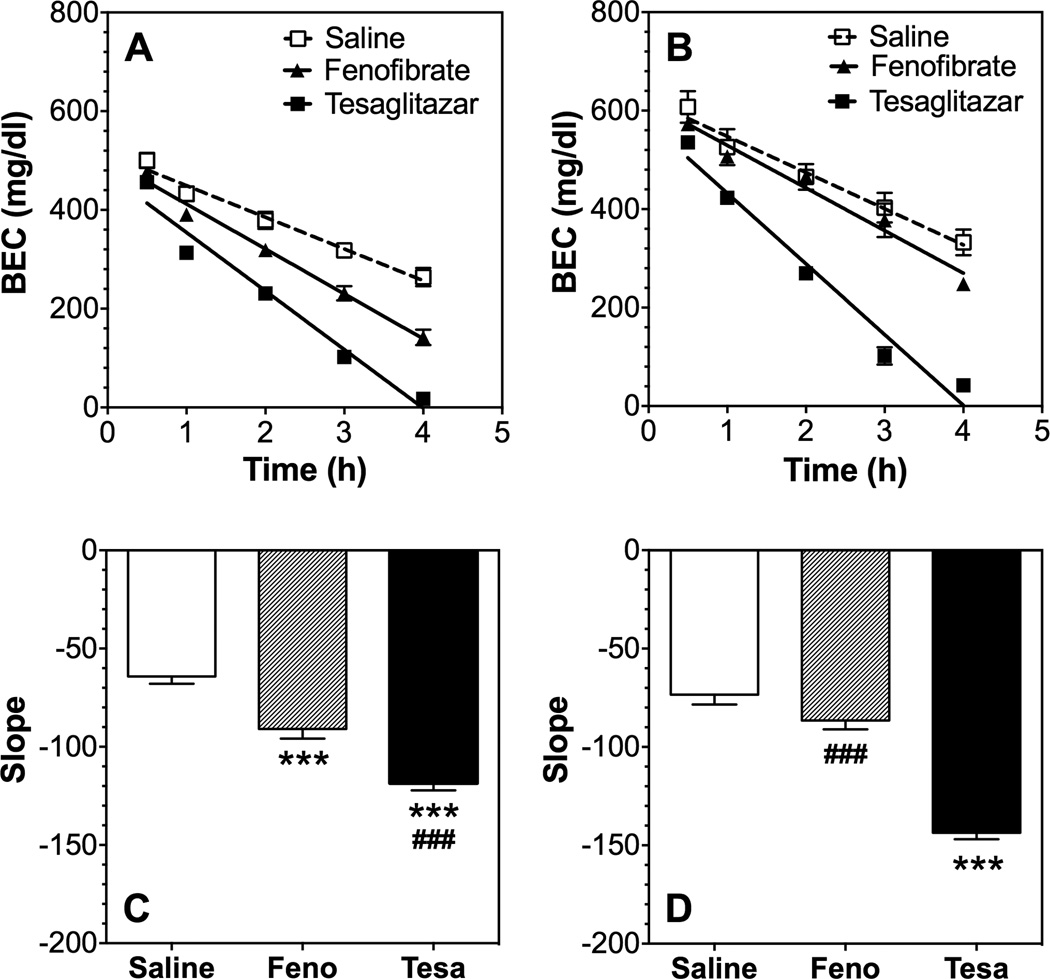
The reduced duration of LORR and similar BEC values at regaining the righting reflex in male mice suggest that fenofibrate and tesaglitazar increased the clearance of ethanol. Indeed, tesaglitazar increased clearance in both male [F(1,16)=102, p<0.001 treatment; F(4,64)=495, p<0.001 time; F(4,64)=45.1, p<0.001 treatment x time] and female [F(1,6)=19, p<0.001 treatment; F(4,24)=43.5, p<0.001 time; F(4,24)=49.2, p<0.001 treatment x time] B6 mice (Fig. 8 A, B). However, fenofibrate increased ethanol clearance in male [F(1,16)=16.6, p<0.001 treatment; F(4,64)=330, p<0.001 time; F(4,64)=9.8, p<0.001 treatment x time] but not female mice (Fig. 8 A, B). Comparison of the slopes of the regression curves showed an overall effect of drug pre-treatment in male mice [F(2,24)=43.7, p<0.001], and post hoc analysis showed that both drugs increased ethanol clearance (Fig. 8 C). There was an overall effect of drug pre-treatment in female mice [F(2,9)=74.4, p<0.001], but post hoc analysis showed that only tesaglitazar significantly increased clearance (Fig. 8 D).
Figure 8. Effects of fenofibrate and tesaglitazar on ethanol clearance in B6 mice.
BECs (mg/dl) in A) male (n=9 per group) and B) female (n=4) mice after 4.0 g/kg ethanol. Slope of regression curves in C) male and D) female mice. Raw data (A, B) were analyzed by two-way repeated measures ANOVA. Transformed data (C, D) were analyzed by one-way ANOVA followed by Bonferroni’s test [***p<0.001 compared to control; ###p<0.001 comparison between fenofibrate (Feno) and tesaglitazar (Tesa)].
Discussion
Fenofibrate and tesaglitazar altered several effects of ethanol and other behavioral responses linked with voluntary ethanol consumption (Table 1), such as CTA and acute withdrawal. The increased acquisition of CTA produced by fenofibrate is consistent with multiple reports that CTA is negatively correlated with voluntary ethanol intake (Blednov et al., 2012, Green and Grahame, 2008, Risinger and Cunningham, 1998). However, tesaglitazar did not affect CTA, despite its greater reduction of ethanol intake compared to fenofibrate. Both fenofibrate and tesaglitazar increased acute withdrawal severity and this measure is also negatively correlated with alcohol consumption (Belknap et al., 2008, Hitzemann et al., 2009, Metten et al., 1998).
Table 1.
Summary of the effects of fenofibrate and tesaglitazar in male and female B6 and B6 × 129S4 mice.
| Test | Males | Females | |||||
|---|---|---|---|---|---|---|---|
| Treatment | Fenofibrate (150 mg/kg) |
Tesaglitazar (1.5 mg/kg) |
Fenofibrate (150 mg/kg) |
Tesaglitazar (1.5 mg/kg) |
|||
| Genotype | B6 × 129 | B6 | B6 × 129 | B6 | B6 | B6 | |
| 2BC (saccharin) |
Preference | = | = | = | = | ||
| Total intake | = | ↑ | = | = | |||
| CPP | Acquisition | = | = | ||||
| Novelty | ↓ | ↓ | = | = | |||
| CTA | Acquisition | ↑ | = | ↑ | = | ||
| Acute withdrawal |
Above basal |
↑ | ↑ | ↑ | ↑ | = | = |
| Below basal |
↓ | ↓ | = | ↓ | ↓ | ↓ | |
| Startle response |
↓ | = | |||||
| LORR | ↓ | ↓ | ↓ | ↓ | ↓ | ↓ | |
| Metabolism | Clearance | ↑ | ↑ | = | ↑ | ||
| 2BC – continuous |
Ethanol (g/kg/24h) |
↓↓ | ↓↓↓ | = | ↓ | ||
| Preference | ↓↓ | ↓↓↓ | = | ↓ | |||
| Total fluid intake (g/kg/24h) |
= | ↑↑ | = | ↑ | |||
| 2BC – intermittent |
Ethanol (g/kg/24h) |
↓ | ↓ | ||||
| Preference | ↓ | ↓ | |||||
| Total fluid intake (g/kg/24h) |
= | = | |||||
2BC, two-bottle choice; CPP, conditioned place preference; CTA, conditioned taste aversion; LORR, loss or righting reflex; =, ↓, ↑ indicate no change, decrease, or increase compared to control. Data from 2BC-continuous and 2BC-intermittent drinking are from the companion manuscript (Blednov et al., in press.).
Although a robust positive correlation between preference for sweet solutions (saccharin consumption) and alcohol consumption has been reported in multiple animal models (Bachmanov et al., 1996, Blednov et al., 2008, Yoneyama et al., 2008), fenofibrate and tesaglitazer did not change saccharin preference. The ability of ethanol to produce CPP is also positively correlated with alcohol consumption (Green and Grahame, 2008) but CPP was not affected by these drugs (Table 1).
Clearance of ethanol increased after treatment with fenofibrate and tesaglitazar, which is consistent with another study showing increased ethanol clearance in UChB rats after chronic treatment with fenofibrate (Karahanian et al., 2014). Increased catalase activity in the liver and increased blood acetaldehyde levels were also observed after oral administration of ethanol (Karahanian et al., 2014). Considering the aversive effects of elevated blood acetaldehyde, it has been suggested that this may be the basis for the reduction in ethanol intake by fenofibrate (Karahanian et al., 2014). Increased clearance may also be important for other ethanol-dependent effects of fenofibrate and tesaglitazar. For example, both drugs reduced the duration of ethanol-induced LORR, but did not change BECs measured at the time of regaining the righting reflex, indicating no change in ethanol sensitivity, but an increased ethanol clearance. The increased alcohol withdrawal severity parallels the increased clearance (produced by fenofibrate in males and by tesaglitazar in both sexes), suggesting that withdrawal severity may be linked to clearance. However, another measure of excitability, acoustic startle response, was reduced by fenofibrate and this test did not involve alcohol treatment and would not be influenced by clearance.
An important finding in the accompanying study is that fenofibrate and tesaglitazar decreased ethanol consumption to a greater extent in male than in female mice (Table 1). For example, in the continuous two-bottle choice test fenofibrate reduced consumption by 30–40% in males but had no effect in females. Thus, it is important to identify other effects of fenofibrate that are found in male, but not female mice, as these are most likely to be relevant to its effects on drinking. We found three measures that meet this criterion: increased ethanol clearance, increased acute withdrawal, and decreased response to novelty. Tesaglitazar reduced ethanol consumption in male and female mice and increased ethanol clearance and withdrawal severity in both sexes.
Voluntary ethanol consumption represents a complex behavior; although it is correlated with other effects of ethanol (Green and Grahame, 2008), the portion of the variance attributable to each correlation is relatively low (Blednov et al., 2012). However, the cumulative effect on drinking might be appreciable if several responses are simultaneously altered. For example, treatment with fenofibrate changed several behavioral responses, which can potentially reduce alcohol consumption (e.g., increased severity of alcohol withdrawal, increased CTA, and reduced motor response to stress). Together these changes may contribute to an overall reduction of ethanol consumption. One unknown is how much the increased clearance of ethanol can contribute to regulation of ethanol consumption. A decreased BEC would be expected to increase ethanol consumption (to achieve the same BEC), but increased acetaldehyde could reduce consumption. Our companion manuscript defines the importance of PPARα in the reduction of ethanol consumption produced by fenofibrate and tesaglitazar, but our approaches (peripheral administration of antagonists, global gene deletion) do not allow us to determine if the drugs are acting peripherally (e.g., liver) or on the brain or both. We found that fenofibrate alters brain gene expression, but has only limited access to brain and produces more changes in liver (Blednov et al., 2015, Ferguson et al., 2014). Another potential mechanism by which PPARα activation can modify brain reward and consumption is by gut-brain signaling (Tellez et al., 2013). Because vagal activity is regulated by PPARα signaling and this can influence brain dopamine reward pathways, this might explain some of the drug effects in our studies following oral administration. However, fenofibrate and tesaglitazar did not affect consumption of saccharin, which is highly rewarding. Direct manipulation of brain, liver, and gut PPARα will be required to address central and peripheral signaling mechanisms and how these interact to regulate alcohol drinking.
Supplementary Material
Acknowledgments
The authors thank Jody Mayfield for editorial assistance and Geyu Liu for technical assistance. This research was supported by the National Institutes of Health National Institute of Alcohol Abuse and Alcoholism (grants AA013520/INIA-West and AA006399).
Footnotes
Author Contributions. Y.A.B. designed and performed experiments, analyzed data, prepared graphs/tables, and wrote the manuscript; M.B., J.M.B., and E.E.S. performed experiments; R.A.H. designed experiments and wrote the manuscript.
The authors declare no conflicts of interest.
REFERENCES
- Bachmanov AA, Reed DR, Tordoff MG, Price RA, Beauchamp GK. Intake of ethanol, sodium chloride, sucrose, citric acid, and quinine hydrochloride solutions by mice: a genetic analysis. Behav Genet. 1996;26:563–573. doi: 10.1007/BF02361229. [DOI] [PMC free article] [PubMed] [Google Scholar]
- Belknap JK, Metten P, Beckley EH, Crabbe JC. Multivariate analyses reveal common and drug-specific genetic influences on responses to four drugs of abuse. Trends Pharmacol Sci. 2008;29:537–543. doi: 10.1016/j.tips.2008.07.010. [DOI] [PMC free article] [PubMed] [Google Scholar]
- Blednov YA, Benavidez JM, Black M, Ferguson LB, Schoenhard GL, Goate AM, Edenberg HJ, Wetherill L, Hesselbrock V, Foroud T, Harris RA. Peroxisome proliferator-activated receptors alpha and gamma are linked with alcohol consumption in mice and withdrawal and dependence in humans. Alcohol Clin Exp Res. 2015;39:136–145. doi: 10.1111/acer.12610. [DOI] [PMC free article] [PubMed] [Google Scholar]
- Blednov YA, Benavidez JM, Black M, Leiter CR, Osterndorff-Kahanek E, Johnson D, Borghese CM, Hanrahan JR, Johnston GA, Chebib M, Harris RA. GABAA receptors containing rho1 subunits contribute to in vivo effects of ethanol in mice. PLoS One. 2014;9:e85525. doi: 10.1371/journal.pone.0085525. [DOI] [PMC free article] [PubMed] [Google Scholar]
- Blednov YA, Black M, Benavidez JM, Stamatakis EE, Harris RA. PPAR agonists: I. Role of receptor subunits in alcohol consumption in male and female mice. Alcohol Clin Exp Res. doi: 10.1111/acer.12976. in press. [DOI] [PMC free article] [PubMed] [Google Scholar]
- Blednov YA, Mayfield RD, Belknap J, Harris RA. Behavioral actions of alcohol: phenotypic relations from multivariate analysis of mutant mouse data. Genes Brain Behav. 2012;11:424–435. doi: 10.1111/j.1601-183X.2012.00780.x. [DOI] [PMC free article] [PubMed] [Google Scholar]
- Blednov YA, Walker D, Alva H, Creech K, Findlay G, Harris RA. GABAA receptor alpha 1 and beta 2 subunit null mutant mice: behavioral responses to ethanol. J Pharmacol Exp Ther. 2003;305:854–863. doi: 10.1124/jpet.103.049478. [DOI] [PubMed] [Google Scholar]
- Blednov YA, Walker D, Martinez M, Levine M, Damak S, Margolskee RF. Perception of sweet taste is important for voluntary alcohol consumption in mice. Genes Brain Behav. 2008;7:1–13. doi: 10.1111/j.1601-183X.2007.00309.x. [DOI] [PMC free article] [PubMed] [Google Scholar]
- Chester JA, Barrenha GD. Acoustic startle at baseline and during acute alcohol withdrawal in replicate mouse lines selectively bred for high or low alcohol preference. Alcohol Clin Exp Res. 2007;31:1633–1644. doi: 10.1111/j.1530-0277.2007.00462.x. [DOI] [PubMed] [Google Scholar]
- Crabbe JC, Merrill C, Belknap JK. Acute dependence on depressant drugs is determined by common genes in mice. J Pharmacol Exp Ther. 1991;257:663–667. [PubMed] [Google Scholar]
- Cunningham CL, Niehus DR, Malott DH, Prather LK. Genetic differences in the rewarding and activating effects of morphine and ethanol. Psychopharmacology. 1992;107:385–393. doi: 10.1007/BF02245166. [DOI] [PubMed] [Google Scholar]
- Cunningham CL, Niehus JS, Noble D. Species difference in sensitivity to ethanol’s hedonic effects. Alcohol. 1993;10:97–102. doi: 10.1016/0741-8329(93)90087-5. [DOI] [PubMed] [Google Scholar]
- Evren C, Durkaya M, Evren B, Dalbudak E, Cetin R. Relationship of relapse with impulsivity, novelty seeking and craving in male alcohol-dependent inpatients. Drug Alcohol Rev. 2012;31:81–90. doi: 10.1111/j.1465-3362.2011.00303.x. [DOI] [PubMed] [Google Scholar]
- Ferguson LB, Most D, Blednov YA, Harris RA. PPAR agonists regulate brain gene expression: relationship to their effects on ethanol consumption. Neuropharmacology. 2014;86:397–407. doi: 10.1016/j.neuropharm.2014.06.024. [DOI] [PMC free article] [PubMed] [Google Scholar]
- Findlay GS, Phelan R, Roberts MT, Homanics GE, Bergeson SE, Lopreato GF, Mihic SJ, Blednov YA, Harris RA. Glycine receptor knock-in mice and hyperekplexia-like phenotypes: comparisons with the null mutant. J Neurosci. 2003;23:8051–8059. doi: 10.1523/JNEUROSCI.23-22-08051.2003. [DOI] [PMC free article] [PubMed] [Google Scholar]
- Green AS, Grahame NJ. Ethanol drinking in rodents: is free-choice drinking related to the reinforcing effects of ethanol? Alcohol. 2008;42:1–11. doi: 10.1016/j.alcohol.2007.10.005. [DOI] [PMC free article] [PubMed] [Google Scholar]
- Hitzemann R, Edmunds S, Wu W, Malmanger B, Walter N, Belknap J, Darakjian P, McWeeney S. Detection of reciprocal quantitative trait loci for acute ethanol withdrawal and ethanol consumption in heterogeneous stock mice. Psychopharmacology. 2009;203:713–722. doi: 10.1007/s00213-008-1418-y. [DOI] [PMC free article] [PubMed] [Google Scholar]
- Karahanian E, Quintanilla ME, Fernandez K, Israel Y. Fenofibrate--a lipid-lowering drug--reduces voluntary alcohol drinking in rats. Alcohol. 2014;48:665–670. doi: 10.1016/j.alcohol.2014.08.004. [DOI] [PubMed] [Google Scholar]
- Lundquist F. The determination of ethyl alcohol in blood and tissue. Methods Biochem Anal. 1959;7:217–251. [Google Scholar]
- Metten P, Phillips TJ, Crabbe JC, Tarantino LM, McClearn GE, Plomin R, Erwin VG, Belknap JK. High genetic susceptibility to ethanol withdrawal predicts low ethanol consumption. Mamm Genome. 1998;9:983–990. doi: 10.1007/s003359900911. [DOI] [PubMed] [Google Scholar]
- Risinger FO, Cunningham CL. Ethanol-induced conditioned taste aversion in BXD recombinant inbred mice. Alcohol Clin Exp Res. 1998;22:1234–1244. [PubMed] [Google Scholar]
- Tellez LA, Medina S, Han W, Ferreira JG, Licona-Limon P, Ren X, Lam TT, Schwartz GJ, de Araujo IE. A gut lipid messenger links excess dietary fat to dopamine deficiency. Science. 2013;341:800–802. doi: 10.1126/science.1239275. [DOI] [PubMed] [Google Scholar]
- Yoneyama N, Crabbe JC, Ford MM, Murillo A, Finn DA. Voluntary ethanol consumption in 22 inbred mouse strains. Alcohol. 2008;42:149–160. doi: 10.1016/j.alcohol.2007.12.006. [DOI] [PMC free article] [PubMed] [Google Scholar]
Associated Data
This section collects any data citations, data availability statements, or supplementary materials included in this article.


