Abstract
Galectin 3 (LGALS3) expression is prognostic for poor survival in acute myeloid leukemia (AML) patients. GCS-100 is a novel galectin inhibitor that may prove useful for AML therapy. In this study, we found GCS-100 induced apoptosis in AML cells. The agent reduced MCL-1 expression suggesting GCS-100 could be more effective when combined with a BH3 mimetic. Indeed, potent synergistic cytotoxicity was achieved when GCS-100 was combined with ABT-737 or ABT-199. Furthermore, the GCS-100/ABT-199 combination was effective against primary AML blast cells from patients with FLT3 ITD mutations, which is another prognostic factor for poor outcome in AML. This activity may involve wild-type p53 as shRNA knockdown of LGALS3 or galectin 1 (LGALS1) sensitized wild-type p53 OCI-AML3 cells to GCS-100/ABT-737-induced apoptosis to a much greater extent than p53 null THP-1 cells. Suppression of LGALS3 by shRNA inhibited MCL-1 expression in OCI-AML3 cells, but not THP-1 cells, suggesting the induced sensitivity to ABT-737 may involve a MCL-1 mediated mechanism. OCI-AML3 cells with LGALS1 shRNA were also sensitized to ABT-737. However, these cells exhibited increased MCL-1 expression, so MCL-1 reduction is apparently not required in this process. A role for p53 appears important as GCS-100 induces p53 expression and shRNA knockdown of p53 protected OCI-AML3 cells from the cytotoxic effects of the GCS-100/ABT-737 treatment combination. Our results suggest that galectins regulate a survival axis in AML cells, which may be targeted via combined inhibition with drugs such as GCS-100 and ABT-199.
1. Introduction
Acute myeloid leukemia (AML) is a malignant hematologic disease that is often fatal [1– 4]. A current strategy for leukemia therapy involves targeting the anti-apoptotic members of the BCL2 family using small molecule inhibitors such as ABT-737 and ABT-199 that are mimetics of the BH3 domain [5–13]. ABT-737, which targets BCL2 and BCL-XL showed promise in preclinical models [9, 10, 14]. However, a serious side effect of ABT-737 is thrombocytopenia as platelet homeostasis is dependent on BCL-XL [15]. To overcome this problem, ABT-199 was developed as a BCL2 specific BH3 mimetic [6, 13]. Use of ABT-199 for AML therapy may be problematic however, since AML survival is often mediated by MCL-1 which is not targeted by the drug [7, 8, 11, 12, 16]. Resistance to BH3 mimetics in many cancers appears to involve MCL-1 expression [7,8,11, 17]. Lymphoma cell lines made resistant to ABT-199 have increased MCL-1 and BCL-XL gene expression [8]. ABT-737 induces ERK activity and MCL-1 expression so resistance may be mediated by the BH3 mimetic itself [11]. Thus, the use of BH3 mimetics for AML therapy will be greatly improved when combined with drugs that suppress MCL-1.
Galectins are important regulators of cell adhesion, apoptosis, cell cycle, and mRNA processing [18–21]. Galectin 3 (LGALS3) is a member of a family of β-galactoside binding proteins that support survival by diverse mechanisms including those involving MCL-1 [18–24]. LGALS3 contains the NWGR motif found in the BH1 domain of BCL2 family proteins and supports mitochondrial stabilization by binding to BCL2 [21, 25, 26]. Furthermore, suppression of LGALS3 by p53 is critical for p53 mediated apoptosis suggesting that the galectin and p53 regulate a survival axis supporting cellular homeostasis [27–29].
LGALS3 has clinical relevance as a target in many cancers [20, 30, 31]. Cheng and colleagues reported that elevated LGALS3 was prognostic for poor survival in AML patients [31]. In models of the tumor microenvironment, LGALS3 appears to play an important role in supporting survival of myeloma, lymphoma, and various leukemias through diverse mechanisms [23, 32–34]. These findings suggest that LGALS3 may be critical for AML cell survival within the BM niche.
GCS-100 is a galectin inhibitor. The compound is currently in a phase II trial for chronic kidney disease (ClinicalTrials.gov Identifier: NCT01843790). In the current study we investigated the efficacy of GCS-100 in AML cell death as a single agent and in combination with the BH3 mimetics. Mechanistically, GCS-100 alone and in combination with BH3 mimetics, induces cell death through diverse pathways including ones mediated by p53. In addition, GCS-100 can suppress MCL-1 but inactivation of MCL-1 does not appear to be required for cell killing.
2. Material and Methods
2.1. Cell lines and shRNA knockdown cells
OCI-AML3 cells were the kind gift from Mark Minden (Ontario Cancer Institute; Toronto, Canada). THP-1 was obtained from ATCC (Manassas, VA). OCI-AML3 cells with control vector and p53 shRNA have been previously described [35]. LGALS3 and LGALS1 were knocked down by lentiviral transduction of shRNA using pLKO based transfer vectors (Open Biosystems, Huntsville, AL, USA). For LGALS3 clones TRCN0000029304 targeting residues 734–754 and TRCN0000029308 targeting residues 606–626 on RefSeq NM_002306.3 were used. For LGALS1 clones TRCN0000057423, which targets residues 397 to 417 on RefSeq NM_002305.3 and TRCN0000057424, which targets residues 178 to 198 on the same RefSeq were used. As negative control we used pLKO.1 control (plasmid 10879, Addgene, Cambridge, MA, USA). Infected cells were selected with puromycin (Invivogen, San Diego, CA). Knockdown was verified by western blot analysis and real time PCR.
Patient Samples
Peripheral blood specimens were collected from a healthy donor and three patients with newly diagnosed AML evaluated at The University of Texas M.D. Anderson Cancer Center (MDACC). Samples were acquired during routine diagnostic assessments in accordance with the regulations and protocols approved by the Investigational Review Board of MDACC. Informed consent was obtained in accordance with the Declaration of Helinski. Patient characteristics are listed in Table 1.
Table 1.
AML Patient Charateristics.
| AML Patient # |
Age | Gender | Diagnosis | % BM blasts |
Cytogenetics | Other molecular parameters |
|---|---|---|---|---|---|---|
| 1 | 85 | M | Therapy-related mixed phenotype Ph+ acute leukemia | 52 | Complex, t(9;22), −5, −7, -Y | e1a2 BCR-ABL1 fusion TET2 Q810* |
| 2 | 64 | M | AML with recurrent genetic abnormality | 78 | Complex, t(6;9), +8, +13 | t(6;9)(p23;q34); DEK-NUP214 FLT3-ITD |
| 3 | 75 | F | AML without maturation (FAB M1) | 86 | Normal | DNMT3A G590fs*21 DNMT3A K589N NPM1 W288fs*12 TET2 Q909* FLT3-ITD |
2.2. Cell treatment and cytotoxicity assessments
Cells were treated with various doses of GCS-100 (La Jolla Pharmaceutical Company), and/or ABT-737 and/or ABT-199 (all from Selleck Chemicals, Houston, TX) for various times. Cell death was assessed by trypan blue staining. To determine that the mechanism of cell death was apoptosis, cells were stained with Annexin V (Roche Diagnostics, Indianapolis, IN) / 4',6-diamidino-2-phenylindole (DAPI) and the percentages of apoptotic cells were assessed by flow cytometry. Apoptotic cells were identified as positive for Annexin V staining using a Becton Dickinson LSR II flow cytometer (Becton Dickinson, San Jose, CA). Total viable cells were determined by total Annexin V negative/DAPI negative cells with counting beads (Roche) included to determine total cell number.
2.3. Immunoblot analysis
Cells were treated with vehicle (10% PBS) or various doses of GCS-100 for 6 or 24 h. Cells were boiled and sonicated in lysis buffer and protein (5 × 10⁵ cell equivalents) was subjected to electrophoresis using SDS/PAGE. Immunoblot analysis was performed with antibodies against LGALS3 (Santa Cruz Biotechnology), LGALS1 (Santa Cruz Biotechnology), phospho-ERK (Y202/Y204; Cell Signaling, Beverly, MA), phospho-AKT (S473; Cell Signaling, Beverly, MA), phospho-MEK (S217/S221; Cell Signaling, Beverly, MA), MCL-1 (Santa Cruz Biotechnology), p53 (Santa Cruz Biotechnology), BCL2 (Dako, Carpinteria, CA), and Tubulin (Sigma Aldrich, St. Louis, MO). Signals were detected by using the Odyssey Infrared Imaging System and quantitated by Odyssey software version 3.0 (both LI-COR Biosciences, Lincoln, NE, USA). Tubulin was used as a loading control.
2.4. Gene expression analysis
Real-time PCR (qRT-PCR) was conducted using an ABI 7900HT Fast Real-Time PCR System (Life Technologies). We ran duplicate 20 µl reactions containing the equivalent of either 1 ng or 7.5 ng total RNA, depending on the housekeeping gene (18S or ABL1, respectively). We used the following TaqMan Gene Expression Assays (Life Technologies) as directed by the manufacturer: ABL1 (Hs01104728_m1), MCL1 (Hs03043899_m1), BCL2 (Hs00608023_m1), and BCL-XL (Hs00236329_m1). We used RQ Manager 1.2.1 (Life Technologies) to analyze the data.
2.5. Statistical analyses
All means ± SD for triplicate samples were calculated with Microsoft Excel 2003 SP2 software (Microsoft Corporation, Seattle, WA). In all statistical analyses, the results were considered statistically significant when p < 0.05 using a two tailed Student t-test.
3. Results
3.1. GCS-100 induces apoptosis in AML cells and inhibits ERK activity and MCL-1 protein expression
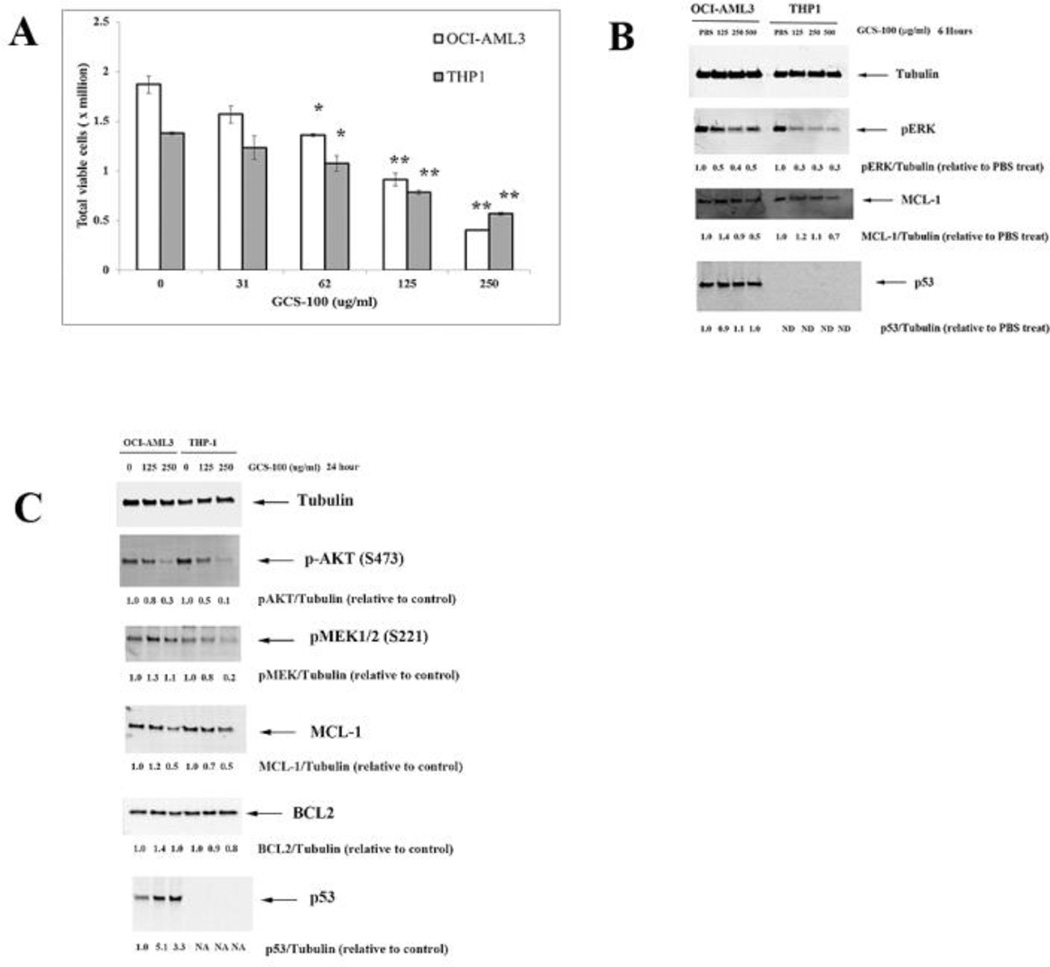
OCI-AML3 and THP-1 AML cells were treated with varying doses of GCS-100 for 72 h. Cell number and viability was assessed by Trypan blue exclusion. As shown in Figure 1A, GCS-100 at > 62 µg/ml was able to kill cells. The agent at 250 µg/ml concentration was more effective killing OCI-AML3 cells compared to THP-1 cells (~ 80% killing versus ~ 60% killing, respectively; Fig. 1A). The increased sensitivity of OCI-AML3 cells to GCS-100 could reflect the difference in p53 status between OCI-AML3 cells (wt) and THP-1 cells (frameshift deletion mutant).
Fig. 1.
GCS-100 kills AML cells and inhibits ERK and AKT activation and MCL-1 expression. A. OCI-AML3 and THP-1 cells were treated with vehicle (10% PBS) or varying doses of GCS-100 for 72 h and cell viability assessed by trypan blue staining. * represents p < 0.05; ** represents p < 0.01 as determined by Student t test. B. OCI-AML3 and THP-1 cells were treated with vehicle (10% PBS) or varying doses of GCS-100 for 6 h, protein lysate isolated, and immunoblot analysis performed with antibodies against phosphorylated ERK, MCL-1, p53, and Tubulin. Ratio of protein expression to Tubulin loading control was determined by densitometry using LiCor imager. C. OCI-AML3 and THP-1 cells were treated with vehicle (10% PBS) or varying doses of GCS-100 for 24 h, protein lysate isolated, and immunoblot analysis performed with antibodies against phosphorylated AKT, phosphorylated MEK1, MCL-1, BCL2, p53, and Tubulin. Ratio of protein expression to Tubulin loading control was determined by densitometry using LiCor imager.
We investigated whether impairment of galectin-mediated RAS transport would have global effects on downstream RAS targets as LGALS3 and the related LGALS1 positively regulate RAS by escort function [18–20, 24, 36]. As shown in Figure 1B, GCS-100 potently suppresses ERK phosphorylation. In addition, high dose GCS-100 reduced MCL-1 in both OCI-AML3 cells (by 50%) and THP-1 cells (by 30%) after 6 hour treatment. GCS-100 had no effect on total p53 protein expression in OCI-AML3 cells after short term treatment (Fig. 1B).
To examine effect of longer exposure of GCS-100 to AML cells, OCI-AML3 cells were treated with vehicle or 125 µg/ml or 250 µg/ml GCS-100 for 24 h. As shown in Figure 1C, the drug suppresses AKT phosphorylation (i.e., activation) in both OCI-AML3 and THP-1 cells. GCS-100 was more potent suppressing MEK-1 phosphorylation in THP-1 compared to OCI-AML3 (Fig. 1C). The greater suppression of MEK phosphorylation in THP-1 compared to OCI-AML3 is consistent with the greater suppression of ERK phosphorylation seen in the THP-1 cells (Fig. 1B). MCL-1 was suppressed in both the OCI-AML3 and THP-1 cells but the drug had little effect on BCL2 expression (Fig. 1C). The ability of GCS-100 to potently suppress AKT and ERK phosphorylation is consistent with inhibition of galectin-mediated RAS signaling by the agent though other possible mechanisms cannot be ruled out. GCS-100 had no effect on p53 expression after short term exposure (Fig. 1B). As shown in Figure 1C, the drug potently induced p53 expression in OCI-AML3 cells. Cells treated with 125 µg/ml GCS-100 displayed a ~ 5-fold increase in p53 protein. This finding suggests that galectin inhibition alone can potentially activate p53 mediated stress pathways.
3.2. GCS-100 synergizes with BH3 mimetics to kill AML cells
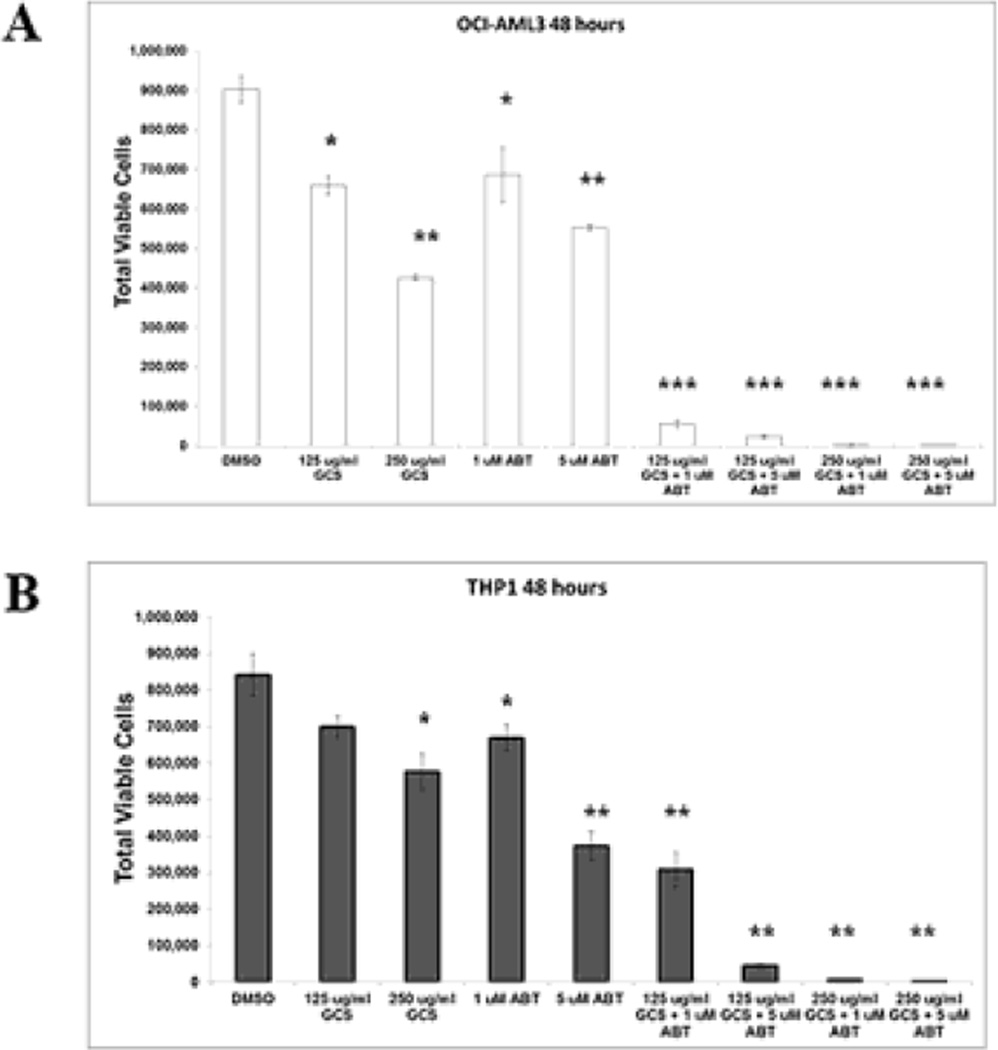
As MCL-1 is a resistance factor for BH3 mimetic-mediated killing [7,8,11, 17], GCS-100 mediated reduction of MCL-1 optimize BH3 mimetic efficacy. GCS-100/ABT-737 combination was examined using OCI-AML3 and THP-1 cells. As shown in Figure 2A, 125 µg/ml GCS-100 and 1 µM ABT-737 resulted in ~ 28% and 24% reduction, respectively of viable cells, in the OCI-AML3 cells. However, the combination of both agents at these doses results in > 94% cell killing of these cells. Apoptosis was induced in ~ 69% of OCI-AML3 cells treated with 125 µg/ml GCS-100 and 1 µM ABT-737, while apoptosis was < 20% in cells treated with either single agent (Supplemental Fig. 1A). If 250 µg/ml GCS-100 is used with 1 µM ABT-737, >99% of OCI-AML3 cells are killed with > 90% apoptotic cells (Fig. 2A and Supplemental Fig. 1A). Synergy of GCS-100 and ABT-737 in cell killing was also observed in THP-1 cells, though the effect was less pronounced (Fig. 2B and Supplemental Fig. 1B). Low dose addition of both agents results in ~64% reduction of viable THP-1 cells, but still 250 µg/ml GCS-100 with 1 µM ABT-737 kills > 99% THP-1 cells (Fig. 2B).
Fig. 2.
Combination of GCS-100 and ABT-737 potently reduces AML cells. OCI-AML3 and THP-1 cells were treated with vehicle (0.1% DMSO) or GCS-100 (125 µg/ml or 250 µg/ml) +/− ABT-737 for 48 h. Total viable cells (Ann V −/ DAPI – with bead count; OCI-AML3 in “A” and THP-1 in “B”) were determined by FACSCAN analysis. * represents p < 0.05; ** represents p < 0.01, *** represents p < 0.001 as determined by Student t test.
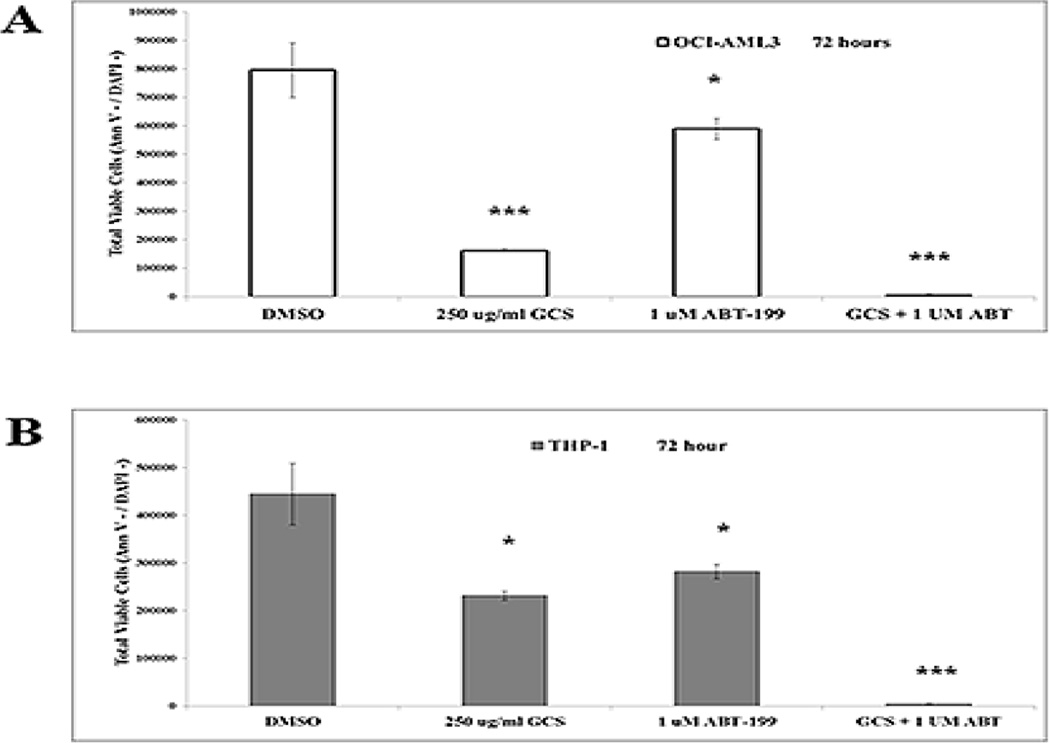
We next tested if GCS-100 would prove effective against AML in combination with the BCL2 specific BH3 mimetic ABT-199. OCI-AML3 cells and THP-1 cells were treated with 1 µM ABT-199 and/or 250 µg/ml GCS-100 for 72 h. As shown in Supplemental Fig.2A and 2B, GCS-100 and ABT-199 alone were not very effective inducing apoptosis in either AML cell line (i.e., the apoptotic cell percentage did not exceed 20% in all cases). GCS-100 alone was effective suppressing viable OCI-AML3 cells (i.e., ~ 80 reduction of viable cells) and THP-1 cells (i.e., viable cells reduced by ~ 50%). ABT-199 effectively killed both cell lines with THP-1 exhibiting greater sensitivity to the BH3 mimetic (Fig. 3A and B). Importantly, combination of GCS-100 and ABT-199 in both AML cell lines resulted in > 99% reduction of viable cells suggesting that the combination of agents could eliminate the leukemic cells (Fig. 3A and B) and induce apoptosis in ~ 90% of cells (Supplemental Fig. 2A and B).
Fig. 3.
Combination of GCS-100 and ABT-199 potently reduces AML cells. OCI-AML3 and THP-1 cells were treated with vehicle (0.1% DMSO) or GCS-100 (250 µg/ml) +/− ABT-199 for 72 h. Total viable cells (Ann V −/ DAPI – with bead count; OCI-AML3 in “A” and THP-1 in “B”) were determined by FACSCAN analysis. * represents p < 0.05; ** represents p < 0.01, *** represents p < 0.001 as determined by Student t test.
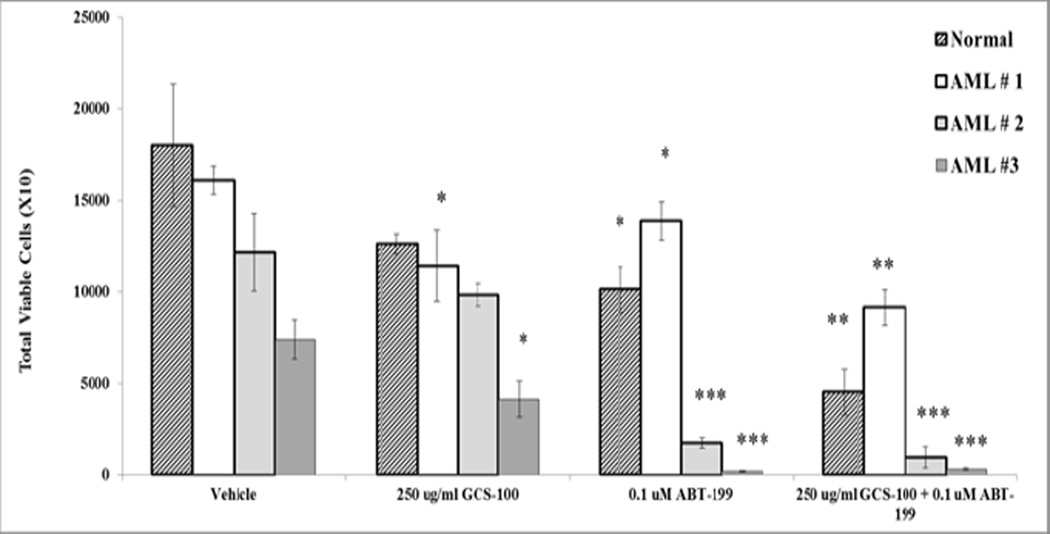
As ABT-199 is currently in clinical trials for AML, we investigated combination of GCS-100 with ABT-199 in three primary leukemia samples as well as in a healthy donor. Patient characteristics are in Table 1. Patient 1 had mixed leukemia with 20% AML and 80% Ph+ B ALL (acute lymphoblastic leukemia). Patient #2 had complex karyotype AML while Patient #3 had AML with normal diploid karyotype though possibly secondary AML (Table 1). Samples were obtained by informed consent under an Institution approved protocol and cells were treated with 250 µg/ml of GCS-100 with or without 0.1 µM ABT-199 for 72 h. Total viable cell number and apoptosis were measured by flow cytometry. As shown in Fig. 4, GCS-100 reduced monocytes in the healthy donor sample by ~ 30% though the difference was not significant. ABT-199 alone resulted in a significant reduction of cells (~ 50%; p = 0.02). Combination of both agents did significantly reduce monocytes in the healthy donor (~ 75% reduction; p = 0.003). The primary leukemia samples showed variable sensitivity to GCS-100 and ABT-199 as single agents (Fig. 4). Of the three patients, Patient #1 was relatively resistant to ABT-199 exhibiting only a ~15% reduction of viable cells (p = 0.04) whereas the BH3 mimetic killed ~ 85% of leukemia cells in the sample from Patient #2 (p = 0.001) and nearly eliminated viable cells in Patient #3 (> 97% killing; p < 0.001). As shown in Figure 4, Patient #1 and Patient #3 were both sensitive to GCS-100 with ~ 30% (p = 0.02) and ~45% (p = 0.02) reduction of blasts achieved, respectively. Patient # 2 was resistant to GCS-100. However in cells from Patient #2, GCS-100 combined with ABT-199 did reduce viable cells by ~ 50% compared to cells treated with ABT-199 alone though not statistically significant. In Patient #1, GCS-100 increased ABT-199 killing significantly with a 35% further reduction of AML blast cells compared to treatment with ABT-199 as a single agent (p = 0.005). These results indicate that leukemia patients have variable responses to GCS-100 and ABT-199 both as single agents and when the agents are combined. Importantly, both AML patients (Patient #2 and Patient #3) saw near elimination of leukemia cells when treated with GCS-100 combination with ABT-199 (Fig. 4).
Fig. 4.
Combination of GCS-100 and ABT-199 reduces leukemic cells in AML samples. Normal monocytic cells were obtained from a heathy donor and primary leukemia blast cells (N = 3) were treated with vehicle (0.1% DMSO) or 250 µg/ml GCS-100 +/− 0.1 µM ABT-199 for 72 h. Total viable cells (Ann V −/ DAPI – with bead count were determined by FACSCAN analysis. * represents p < 0.05; ** represents p < 0.01, *** represents p < 0.001 as determined by Student t test.
3.3. Suppression of LGALS3 or LGALS1 sensitizes AML cells to ABT-737
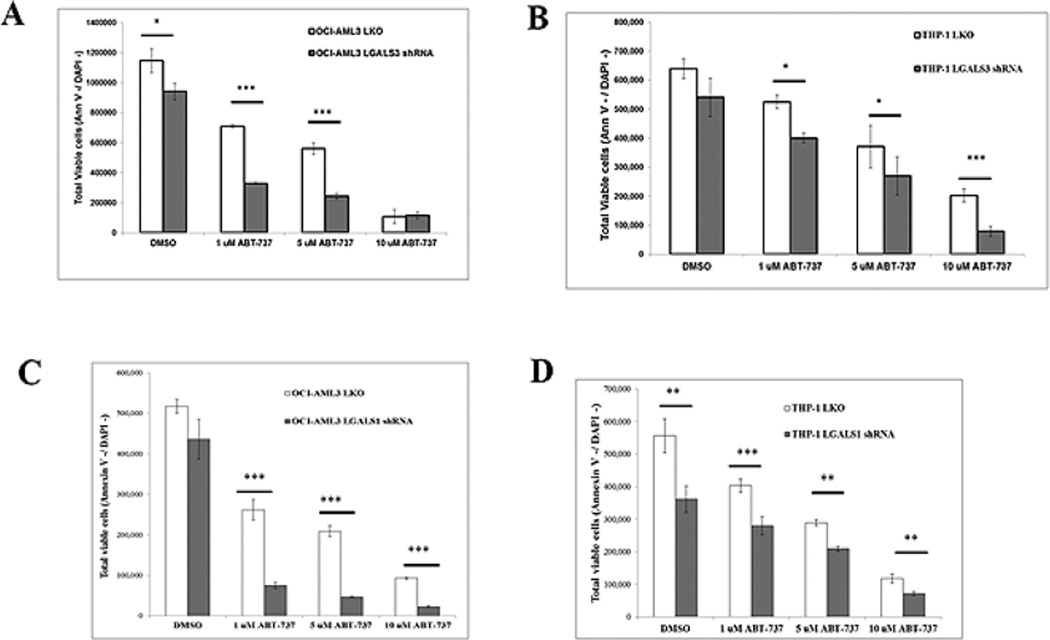
LGALS3 positively regulates a number of different anti-apoptotic BCL2 family members by diverse mechanisms [18–21]. To determine the role of LGALS3 in ABT-737 mediated killing, LGALS3 was suppressed by lentiviral shRNA in OCI-AML3 and THP-1 cells. In both cell lines > 95% reduction of LGALS3 was achieved as determined by immunoblotting (Supplemental Fig. 3). Cells were treated with varying doses of the BH3 mimetic for 48 h. Reduction of LGALS3 had different effects on sensitivity to ABT-737 in OCI-AML3 and THP-1 cells. In OCI-AML3 cells, reduction of LGALS3 sensitized cells to both 1 µM and 5 µM ABT-737 as determined by increased apoptosis of cells and reduction of viable cells (Fig. 5A and Supplemental Fig. 4A). However, there was only a small albeit statistically significant difference between control and LGALS3 shRNA OCI-AML cell sensitivity to 10 µM ABT-737 (Fig. 5A and Supplemental Fig. 4A). This finding suggests it is beyond LGALS3’s ability to protect these cells at this dose of the agent. Though there was a 2-fold increase in percentage of apoptotic cells in THP-1 cells with LGALS3 shRNA compared to control cells with low (1 µM) ABT-737, there was only a slight statistical difference in the reduction of viable cells treated with ABT-737 at 1 µM and 5 µM ABT-737 when comparing THP-1 cells with control shRNA or LGALS3 shRNA (Fig. 5B and Supplemental Fig. 4B). However, suppression of LGALS3 by shRNA sensitized THP-1 cells to high dose (10 µM) ABT-737. The differences in effect of suppression of LGALS3 on sensitivity to ABT-737 in THP-1 versus OCI-AML3 cells could be due to differences in p53 status as p53 could be more effective aiding BH3 mimetic mediated apoptosis in the absence of LGALS3. Another reason why LGALS3 suppression only had minimal effect on ABT-737 sensitivity in THP-1 cells may be that GCS-100 inhibits other galectin family members such as LGALS1. To examine the effect of suppression of LGALS1 in OCI-AML3 and THP-1 cells, lentiviral transductants with control LKO or LGALS1 shRNA were produced. Suppression of LGALS1 was > 90% in LGALS1 transductants compared to LKO control in both cell lines (Supplemental Fig. 3). Similar to cells with LGALS3 shRNA, OCI-AML3 cells with LGALS1 shRNA were more sensitive to 1 µM and 5 µM doses of ABT-737, (Fig. 5C and Supplemental Fig. 4A). However unlike cells with LGALS3 shRNA, OCI-AML3 cells were sensitized to 10 µM ABT-737 when LGALS1 was reduced. Suppression of LGALS1 by shRNA sensitized THP-1 cells to all doses of ABT-737 (Fig. 5D and Supplemental Fig. 4B). Interestingly suppression of LGALS1 resulted in a significant basal reduction of THP-1 cells as observed when comparing viable cells and apoptosis in THP-1 cells (Fig. 5D and Supplemental Fig. 4D). Reduction of LGALS1 in OCI-AML3 cells reduced viable cells albeit not significantly but did result in increased apoptotic cells (Fig. 5C and Supplemental Fig. 4C). These results suggest that both LGALS3 and LGALS1 play roles in survival pathways targeted by ABT-737.
Fig. 5.
Suppression of LGALS3 or LGALS1 sensitizes AML cells to ABT-737.OCI-AML3 and THP-1 transductant cells with either LKO vector control shRNA or LGALS3 shRNA or LGALS1 were treated with vehicle (0.1% DMSO) or varying doses of ABT-737 for 48 h. Total viable cells (Ann V −/ DAPI – with bead count) for OCI-AML3 LKO or LGALS3 shRNA transductants in “A”; OCI-AML3 LKO or LGALS1 transductants in “C” THP-1 LKO or LGALS3 shRNA transductants in “B”; and THP-1 LKO or LGALS1 transductants in “D” was determined by FACSCAN analysis. * represents p < 0.05; ** represents p < 0.01, *** represents p < 0.001 as determined by Student t test.
3.4. Suppression of LGALS3 reduces BCL2 and MCL-1 gene expression in AML cells
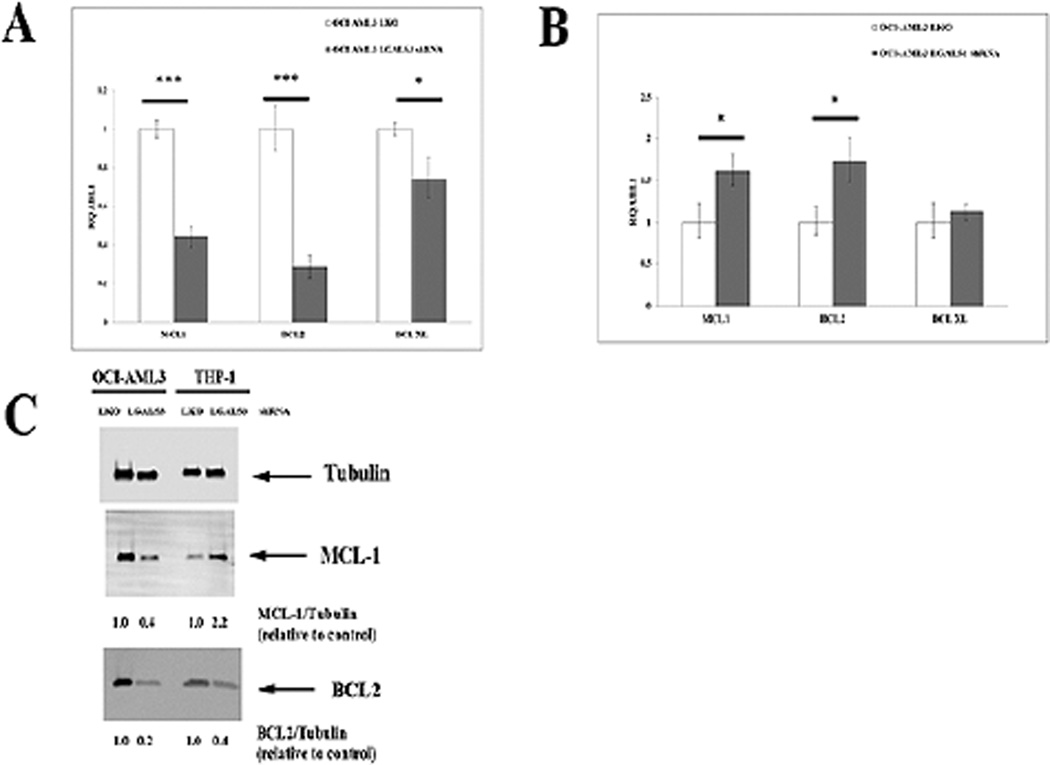
A mechanism to regulate BCL2 gene expression involving both LGALS3 and p53 is currently unknown. We examined expression of BCL2 family members BCL2, MCL-1, and BCL-XL in OCI-AML3 cells and THP-1 cells that expressed control shRNA or LGALS3 shRNA. Transcript was determined using qRT-PCR and normalized to housekeeping gene ABL-1. As shown in Fig. 6A, reduction of LGALS3 in OCI-AML3 cells had only a slight effect on BCL-XL gene expression compared to control cells (~ 25% reduction) but suppression of the galectin resulted in > 70% reduction of BCL2 transcript and > 50% reduction of MCL-1 transcript when compared with control. Suppression of LGALS1 in OCI-AML3 cells actually resulted in an increase in BCL2 and MCL-1 gene expression with no effect on BCL-XL transcription (Fig. 6B). In THP-1 cells, reduction of LGALS3 by shRNA had no effect on BCL-XL gene expression and had only slight effects on BCL2 (28% reduction) and MCL1 (25% reduction) while reduction of LGALS1 had no effect on transcription of BCL2, BCL-XL, or MCL-1 (data not shown).
Fig. 6.
Suppression of LGALS3 reduces BCL2 gene expression in OCI-AML3 but less so in THP-1 cells. RNA from OCI-AML3 transductant cells with either LKO vector control shRNA or LGALS3 shRNA (A) or LKO vector control shRNA or LGALS1 shRNA (B) was isolated, cDNA produced, and mRNA levels of BCL-2, BCL-XL, MCL-1, and ABL1 were determined by qRT-PCR and levels normalized to ABL-1 as described in “Materials and Methods”. C. Protein was isolated from OCI-AML3 and THP-1 transductant cells with either LKO vector control shRNA or LGALS3 shRNA. Immunoblot analysis was performed with antibodies against MCL-1, BCL2 and Tubulin. Ratio of protein expression to Tubulin loading control was determined by densitometry using LiCor imager.
Western blot analysis of BCL2 and MCL-1 in parental OCI-AML3 and THP-1 cells treated with vehicle or GCS-100 revealed the drug suppressed MCL-1 in both cell lines but had little effect on BCL2 (Fig. 1B and Fig. 1C). To examine effect of LGALS3 knock down by shRNA, western analysis was performed on OCI-AML 3 cells and THP-1 cells with control shRNA or LGALS3 shRNA. As shown in Figure 6C, suppression of LGALS3 inhibited MCL-1 by ~ 60% and BCL2 protein expression by ~ 80% in the OCI-AML3 cells consistent with the gene expression data. This was in contrast to the effect GCS-100 had on BCL2 protein in OCI-AML3 cells as the drug did not impact BCL2 protein levels after longer treatment (Fig. 1C). MCL-1 and BCL2 protein expression was also examined in THP-1 cells with control shRNA or LGALS3 shRNA (Fig. 6C). Suppression of LGALS3 actually resulted in increased MCL-1 (i.e., ~ 2-fold; Fig. 6C). BCL2 protein was reduced in THP-1 cells by ~ 60% when the galectin was suppressed (Fig. 6C). These findings suggest that LGALS3 supports BCL2 protein expression in both OCI-AML3 and THP-1 cells. Like OCI-AML3 cells, though suppression of the galectin by shRNA suppressed BCL2 protein, GCS-100 had little or no effect on BCL2 in the THP-1 cells after short exposure (Fig. 6C) and only a minimal reduction (~ 20% with 250 µg/ml drug) after 24 hour treatment (Fig. 1C). The results also suggest that LGALS3 positively regulates MCL-1 in OCI-AML3 cells but not THP-1 cells and may explain why suppression of LGALS3 has a greater effect on ABT-737 sensitivity in OCI-AML3 cells compared to THP-1 cells (Fig. 5 A – D).
3.5. Suppression of p53 partially protects OCI-AML3 cells from ABT-737
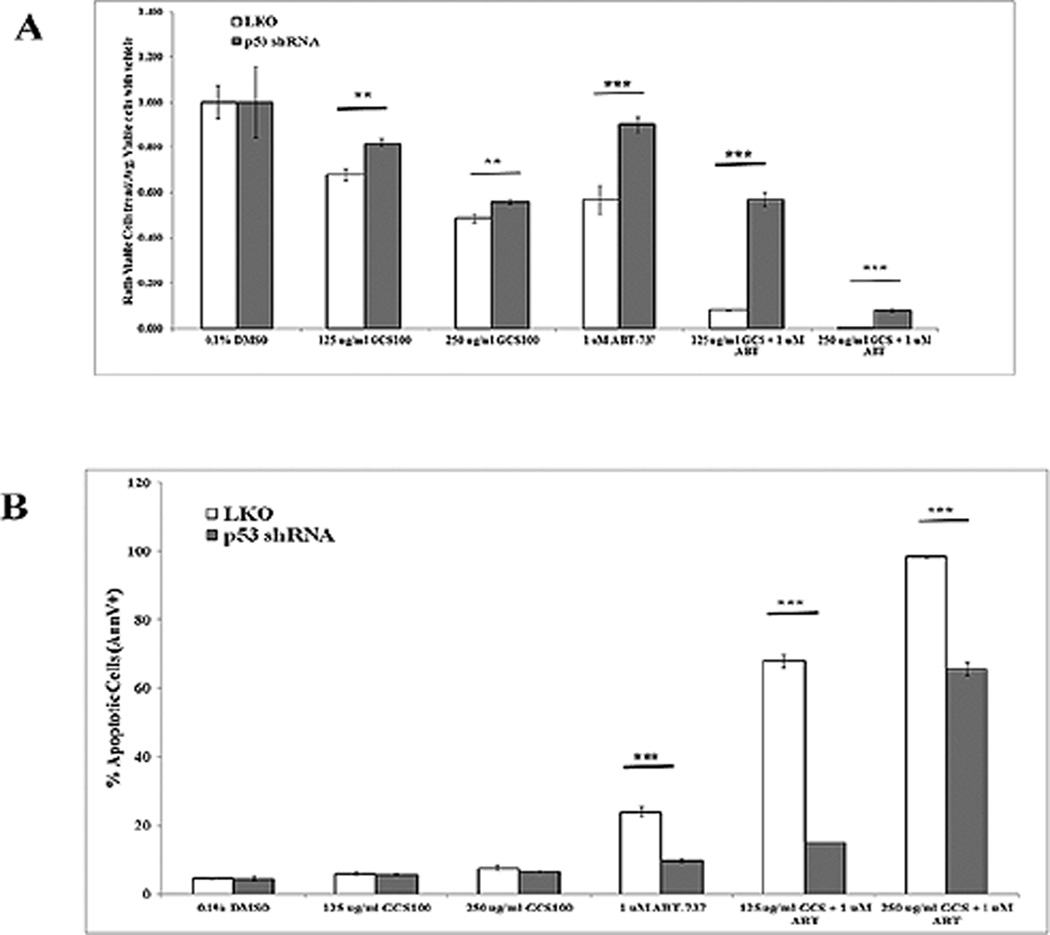
To assess the role for p53 in this process, p53 was suppressed by lentiviral shRNA in OCI-AML3 cells[35]. Reduction of p53 was ~ 80% in shRNA cells compared to LKO control cells as shown in Supplemental Figure 3. Control shRNA OCI-AML3 cells and p53 shRNA OCI-AML3 cells were similarly treated with GCS-100 with or without ABT-737 for 48 h as was performed for parental cells (Fig. 2A – D). As shown in Figure 7A and B, knockdown of p53 had little effect on sensitivity to GCS-100 alone as a single agent. With 250 µg/ml GCS-100, viable cells were reduced roughly by half and the apoptotic rate was roughly 6%. The status of p53 appears to be more important for ABT-737 sensitivity in OCI-AML3 cells as cells with control shRNA were more sensitive to 1 µM ABT-737 alone compared to the cells with p53 shRNA (Fig. 7A and B). Similar to parental OCI-AML3 cells, cells with control shRNA showed synergistic killing with GCS-100 and ABT-737. Control cells treated with 250 µg/ml GCS-100 and 1 µM ABT-737 for 48 h demonstrated a > 99% reduction of viable cells and the percentage of apoptotic cells was > 98% (Fig. 7A and B). OCI-AML3 cells expressing p53 shRNA treated with 250 µg/ml GCS-100 and 1 µM ABT-737 for 48 h were less sensitive to the combination but still there was a 92% reduction of viable cells and 67% of cells were apoptotic (Fig. 7A and B). The greater sensitivity of wt p53 cells suggests that p53 is necessary but not sufficient for the death mechanism in GCS-100/BH3 mimetic induced killing.
Fig. 7.
Suppression of p53 protects AML cells from GCS-100/ ABT-737 combination. OCI-AML3 transductant cells with either LKO vector control shRNA or p53 shRNA were treated with vehicle (0.1% DMSO) or GCS-100 (125 µg/ml or 250 µg/ml) or 1 µM ABT-737 for 48 h. Ratio of total viable cells (Ann V −/ DAPI – with bead count; “A”) relative to the average of viable cells treated with DMSO and percentage of apoptotic cells (Ann V +; “B”) was determined by FACSCAN analysis. * represents p < 0.05; ** represents p < 0.01, *** represents p < 0.001 as determined by Student t test.
4. Discussion
Consistent with the previous myeloma study23, GCS-100 was able to suppress both ERK phosphorylation and MCL-1 expression in AML cells (Fig. 1B and C). GCS-100 does not appear to affect BCL2 protein expression in the AML cell lines (Fig. 1C). This finding is consistent with a previous study where the agent was found to have little effect on BCL2 expression as in myeloma cell lines as tested by the Cotter group [23]. Very preliminary results suggest GCS-100 can induce apoptosis in primary AML cells (Fig. 1B).
Though GCS-100 had little effect on BCL2 protein expression in OCI-AML3 and THP-1 cells (Fig. 1D), suppression of LGALS3 by shRNA was able to reduce BCL2 levels in both cell lines (Fig. 6C). The mechanism of LGALS3 regulation of BCL2 is not clear as the reduction of the galectin resulted in suppressed bcl2 transcription in OCI-AML3 cells but reduction of LGALS3 in THP-1 was less potent suppressing bcl2 gene expression in the THP-1 cells. GCS-100 was able to reduce MCL-1 protein expression in both cell lines albeit with more potency for OCI-AML3 cells (Fig. 1B and C). This effect may be due to suppression of either AKT, which regulates MCL-1 stability via Glycogen Synthase Kinase 3 (GSK3), or via ERK activity (which has been implicated in MCL-1 gene expression and protein stability) as GCS-100 was shown to effectively block both AKT and ERK phosphorylation in both cell lines (Fig. 1B and C). As GCS-100 reduced MCL-1 expression in both AML cell lines after 24 h (Fig. 1C), it would be expected the agent would synergize with BH3 mimetic agents by targeting MCL-1 and BCL2, respectively. However with LGALS3 knockdown cells we only see reduction of MCL-1 in OCI-AML3 but not THP-1 cells. At least for LGALS3, it is appears that support of MCL-1 by the galectin may be important for resistance to BH3 mimetics in the AML cells. Combination of GCS-100 with either ABT-737 (Fig. 2A and Fig. 2B and Supplemental Fig. 1A and Fig. 1B) or ABT-199 (Fig. 3A and B, and Supplemental Fig. 2A and Fig. 2B) resulted in near complete elimination of AML cells. While efficacy of GCS-100/BH3 mimetic was high in both p53 wt (OCI-AML3) and p53 deletion mutant (THP-1) cells, cells with wt p53 were more sensitive to the combination of agents. The cell’s p53 status may affect how GCS-100 affects p53 mediated stress pathways though further investigation is required to identify the mechanism(s) responsible. Suppression of LGALS3 by shRNA in OCI-AML3 cells resulted in potent inhibition of both MCL-1 and BCL2 gene expression while there was only a slight effect in THP-1 cells suggesting transcription of these pro-survival molecules can be negatively regulated by p53. Regulation of BCL2 gene expression by p53 has been reported [43]. It is also important to note that there are other genetic differences in THP-1 and OCI-AML3 cells beside p53 mutation status. The Broad-Novartis Cancer cell Line Encyclopedia (CCLE; http://www.broadinstitute.org/ccle/home) list the various reported mutations in OCI-AML3 and THP-1 cells. Both cell lines have N-RAS mutations -- OCI-AML3 has Q61L while THP-1 has G12D (either mutation results in constitutive activation of the kinase). Mutations in OCI-AML3 cells include Ten-Eleven Translocation 1(TET1; P828S) and Nucleophosmin 1 (NPM1; L287frame shift). THP-1 mutations include Fanconi Anemia Complementation Group D2 (FANCD2; Y1117F) and General Control Nonderepressible 2 (GCN2; P662L). It is not clear how these or other mutations might contribute to cell survival or death with inhibition of galectins and/or BCL2 family members.
There was a difference in sensitivity of THP-1 and OCI-AML3 cells to GCS-100/ABT-737 combination (Fig. 2A and Fig. 2B and Supplemental Fig. 1A and B), yet there was still nearly complete elimination of leukemia cells independent of p53 status if 250 µg/ml GCS-100 was used. This concentration of agent is well below the effective dose reported for use in the myeloma studies [23]. In addition, the effectiveness of the GCS-100/ABT-737 combination in killing the AML cells suggests that perhaps lower and less toxic doses of ABT-737 could be used if combined with GCS-100.
Testing primary leukemia samples, two of three patients displayed sensitivity to 250 µg/ml GCS-100 as a single agent (Fig. 4). The patient that was resistant to GCS-100 (Patient #2) did show increased killing of AML blast cells with combination of the galectin inhibitor with ABT-199 compared to treatment with ABT-199 alone though the difference was not significant. Patient #1 displayed improved blast cell killing with the GCS-100/ABT-199 combination (Fig. 4). However, GCS-100/ABT-199 combination did not kill the leukemia cells from Patient #1 as effectively as observed in the other patients (Fig. 4). Patient #1 had mixed phenotype leukemia with Philadelphia chromosome, and had both leukemic myeloblasts and lymphoblasts. AML and ALL cells may possess differential sensitivity to these drugs, and the activity against Patient #1’s leukemic cells may reflect a heterogeneous response. GCS-100 did not increase killing of AML cells from Patient #3 however the cells were quite sensitive to ABT-199 alone (Fig. 4). Considering that MCL-1 is a major resistance factor for BH3 mimetic therapy [7,11], GCS-100 could be investigated to prevent resistant clones in patients that are responsive to ABT-199.
The combination of GCS-100 and ABT-199 was able to nearly eliminate the leukemia cells from Patient #2 and Patient #3 in the in vitro assay (Fig. 4). Both patients harbor a FLT3 ITD mutation which is associated with unfavorable survival [1–4]. Patient #2 also had a complex karyotype, also prognostic for unfavorable outcome [1–4]. Furthermore, MCL-1 has been implicated as a critical survival factor in AML leukemic stem cells harboring FLT3 ITD mutations [46 1–4, 46]. Dual targeting of BCL-2 and MCL-1 may be particularly meaningful for the >30% of AML patients who are FLT3-ITD positive. GCS-100 alone reduced normal mononuclear cells, though not significantly (Fig. 4). Mononuclear cells from the healthy donor were sensitive to ABT-199, and GCS-100 did increase cell killing in combination with ABT-199. Reduction of healthy donor cells by GCS-100/ABT-199 combination was not complete, whereas in two of three AML patients > 98% of leukemic cells were killed by this combination (Fig. 4). Further work is needed to determine combinatorial dosing of these agents, and their utility in treating patients with AML.
The finding that suppression of p53 partially protected AML cells from GCS-100/ABT-737 combination is consistent with the increased sensitivity of p53 wt OCI-AML3 cells to BH3 mimetic/GCS-100 combination compared to p53 mutant THP-1 cells (Fig. 2A and Fig. 2B and Supplemental Fig. 1A and B). The data also indicates that there is probably a feedback mechanism that regulates BCL2 expression when global galectin activity is suppressed as opposed to when a single galectin (i.e. LGALS3) is reduced. As for effects on gene expression, analysis of OCI-AML3 cells treated with 125 µg/ml, 250 µg/ml, or 500 µg/ml GCS-100 for 24 h revealed that the drug only slightly reduced MCL-1 gene expression (~ 40% reduction) and had no effect on BCL2 gene expression (data not shown). These differences could reflect different effects of other galectins on BCL2 gene expression as GCS-100 may affect other galectin family members other than LGALS3 and that the drug is more effective reducing BCL2 protein could trigger a feedback system involving transcription. That LGALS1 suppression results in increased BCL2 and MCL-1 gene expression supports this possibility (Fig. 6B). Still, that GCS-100 does not appear to affect BCL2 protein expression in either wt p53 cells or p53 mutant cells suggests BCL2 is not important in this pathway.
Suppression of p53 in the OCI-AML3 cells protected OCI-AML3 cells from the BH3 mimetic ABT-737 but had little effect on cell sensitivity to GCS-100 as a single agent. However, in combination of both ABT-737 and GCS-100, suppression of p53 potently protects cells (Fig. 7A and B). GCS-100 induces p53 expression in OCI-AML3 cells (Fig. 1C). At present the mechanism how the drug induces p53 is unclear. Still, the induction of p53 by the drug could contribute to increased cell killing as a single agent or when combined with a BH3 mimetic.
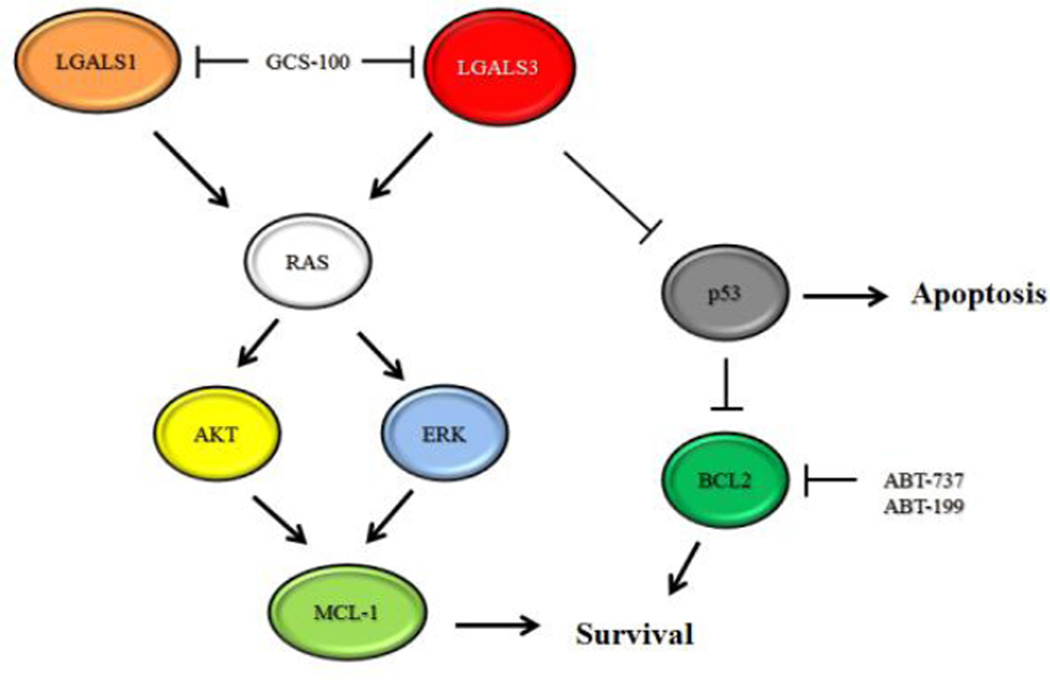
GCS-100 was effective suppressing expression of MCL-1 in AML cells though the drug appeared not to affect BCL2. Suppression of MCL-1 may at least be necessary for GCS-100 mediated cell death as both OCI-AMML3 and THP-1 cells were sensitive to the drug and the drug reduced MCL-1 in both cell lines. When combined with BH3 mimetics, GCS-100 was effective eliminating leukemia cells independent of p53 status if the appropriate dose was used. A requirement for suppression of death in response to combination of GCS-100 and BH3 mimetic seems unlikely as LGAS1 actually induced MCL-1 but sensitized cells to ABT-7373. A model of the possible pathways affected by GCS-100 is depicted in Figure 8. In summary, GCS-100 has promise as a therapeutic agent for AML therapy especially if combined with a BH3 mimetic such as ABT-199.
Fig. 8.
Model of GCS-100 mediated killing. LGALS1 and LGAS3 mediate RAS signaling that support MCL-1 expression mediated by AKT and ERK. LGALS3 suppresses expression of p53 by an unknown mechanism. ABT-737 and ABT-199 inhibit BCL2, and GCS-100 inhibits LGALS1 and LGALS3.
Supplementary Material
Highlights.
Galectin inhibitor GCS-100 induces apoptosis in AML cells and synergizes with BH3 mimetics ABT-737 and ABT-199.
GCS-100 suppresses ERK and AKT signaling, reduces MCL-1 protein expression, and induces p53 protein expression.
Suppression of Galectin 3 supports MCL-1 gene and protein expression in wt p53 OCI-AML3 cells but not p53 null THP-1 cells.
Acknowledgments
This work was supported by the National Institutes of Health (PO1 grant CA-55164 to M.A. and CA-016672 to J.K.B. and M.A.).
List of Abbreviations
- LGALS3
Galectin 3
- LGALS1
Galectin 1
- AML
Acute myeloid leukemia
- qRT-PCR
Real-time PCR
- AKT
Protein Kinase B
- ERK
Extracellular Receptor Kinase
- BCL2
B Cell Lymphoma 2
- BCL-XL
B Cell Lymphoma 2 Like 1
- MCL-1
Myeloid Cell Leukemia 1
- Ph+
Philadelphia chromosome +
- ALL
Acute lymphoblastic leukemia
- GSK3
Glycogen Synthase Kinase 3
- TET1
Ten-Eleven Translocation 1
- NPM1
Nucleophosmin 1
- FANCD2
Fanconi Anemia Complementation Group D2
- GCN2
General Control Nonderepressible 2
Footnotes
Publisher's Disclaimer: This is a PDF file of an unedited manuscript that has been accepted for publication. As a service to our customers we are providing this early version of the manuscript. The manuscript will undergo copyediting, typesetting, and review of the resulting proof before it is published in its final citable form. Please note that during the production process errors may be discovered which could affect the content, and all legal disclaimers that apply to the journal pertain.
Conflict of interest
James Rolke and George Tidmarsh are employees of La Jolla Pharmaceutical Company, San Diego, CA. The other authors declare no competing conflict of interest.
References
- 1.Andreeff M, Milella M, Carter BZ, Tabe Y, Ricciardi MR, Sneed T, et al. Targeted therapy of AML new concepts. Ann.Hematol. 2004;83(Suppl 1):S51–S53. doi: 10.1007/s00277-004-0849-8. [DOI] [PubMed] [Google Scholar]
- 2.Estey E, Dohner H. Acute myeloid leukemia. Lancet. 2006;368:1894–1907. doi: 10.1016/S0140-6736(06)69780-8. [DOI] [PubMed] [Google Scholar]
- 3.Kantarjian H, O'Brien S, Cortes J, et al. Therapeutic advances in leukemia and myelodysplastic syndrome over the past 40 years. Cancer. 2008;113:1933–1952. doi: 10.1002/cncr.23655. [DOI] [PMC free article] [PubMed] [Google Scholar]
- 4.Estey EH. How to manage high-risk acute myeloid leukemia. Leukemia. 2012;26:861–869. doi: 10.1038/leu.2011.317. [DOI] [PubMed] [Google Scholar]
- 5.Desai AV, El-Bakkar H, Abdul-Hay M. Novel Agents in the Treatment of Chronic Lymphocytic Leukemia: A Review About the Future. Clin Lymphoma Myeloma Leuk. 2014 doi: 10.1016/j.clml.2014.09.007. pii: S2152-2650(14)00417-0. [DOI] [PubMed] [Google Scholar]
- 6.Souers AJ, Leverson JD, Boghaert ER, Ackler SL, Catron ND, Chen J, et al. ABT-199, a potent and selective BCL-2 inhibitor, achieves antitumor activity while sparing platelets. Nat Med. 2013;19:202–208. doi: 10.1038/nm.3048. [DOI] [PubMed] [Google Scholar]
- 7.Pan R, Hogdal LJ, Benito JM, Bucci D, et al. Selective BCL-2 inhibition by ABT-199 causes on-target cell death in acute myeloid leukemia. Cancer Discov. 2014;4:362–375. doi: 10.1158/2159-8290.CD-13-0609. [DOI] [PMC free article] [PubMed] [Google Scholar]
- 8.Choudhary GS, Al-Harbi S, Mazumder S, Hill BT, Smith MR, Bodo J, et al. MCL-1 and BCL-xL-dependent resistance to the BCL-2 inhibitor ABT-199 can be overcome by preventing PI3K/AKT/mTOR activation in lymphoid malignancies. Cell Death Dis. 2015;6:e1593. doi: 10.1038/cddis.2014.525. [DOI] [PMC free article] [PubMed] [Google Scholar]
- 9.Oltersdorf T, Elmore SW, Shoemaker AR, Armstrong RC, Augeri DJ, Belli BA, et al. An inhibitor of Bcl-2 family proteins induces regression of solid tumours. Nature. 2005;435:677–681. doi: 10.1038/nature03579. [DOI] [PubMed] [Google Scholar]
- 10.Konopleva M, Contractor R, Tsao T, Samudio I, Ruvolo PP, Kitada S, Deng X, et al. Mechanisms of apoptosis sensitivity and resistance to the BH3 mimetic ABT-737 in acute myeloid leukemia. Cancer Cell. 2006;10:375–388. doi: 10.1016/j.ccr.2006.10.006. [DOI] [PubMed] [Google Scholar]
- 11.Konopleva M, Milella M, Ruvolo P, et al. MEK inhibition enhances ABT-737-induced leukemia cell apoptosis via prevention of ERK-activated MCL-1 induction and modulation of MCL-1/BIM complex. Leukemia. 2012;26:778–787. doi: 10.1038/leu.2011.287. [DOI] [PMC free article] [PubMed] [Google Scholar] [Retracted]
- 12.Glaser SP, Lee EF, Trounson E, Bouillet P, Wei A, Fairlie WD, et al. Anti-apoptotic Mcl-1 is essential for the development and sustained growth of acute myeloid leukemia. Genes Dev. 2012;26:120–125. doi: 10.1101/gad.182980.111. [DOI] [PMC free article] [PubMed] [Google Scholar]
- 13.Letai AG. Diagnosing and exploiting cancer's addiction to blocks in apoptosis. Nat Rev Cancer. 2008;8:121–132. doi: 10.1038/nrc2297. [DOI] [PubMed] [Google Scholar]
- 14.Davids MS, Letai A. Targeting the B-cell lymphoma/leukemia 2 family in cancer. J Clin Oncol. 2012;30:3127–3135. doi: 10.1200/JCO.2011.37.0981. [DOI] [PMC free article] [PubMed] [Google Scholar]
- 15.Mason KD, Carpinelli MR, Fletcher JI, Collinge JE, Hilton AA, Ellis S, et al. Programmed anuclear cell death delimits platelet life span. Cell. 2007 Mar 23;128(6):1173–1186. doi: 10.1016/j.cell.2007.01.037. [DOI] [PubMed] [Google Scholar]
- 16.Gores GJ, Kaufmann SH. Selectively targeting Mcl-1 for the treatment of acute myelogenous leukemia and solid tumors. Genes Dev. 2012;26:305–311. doi: 10.1101/gad.186189.111. [DOI] [PMC free article] [PubMed] [Google Scholar]
- 17.Tse C, Shoemaker AR, Adickes J, Anderson MG, Chen J, Jin S, Johnson EF, et al. ABT-263: a potent and orally bioavailable Bcl-2 family inhibitor. Cancer Res. 2008;68:3421–3428. doi: 10.1158/0008-5472.CAN-07-5836. [DOI] [PubMed] [Google Scholar]
- 18.Fukumori T, Kanayama HO, Raz A. The role of galectin-3 in cancer drug resistance. Drug Resist Updat. 2007;10:101–108. doi: 10.1016/j.drup.2007.04.001. [DOI] [PMC free article] [PubMed] [Google Scholar]
- 19.Newlaczyl AU, Yu LG. Galectin-3--a jack-of-all-trades in cancer. Cancer Lett. 2011;313:123–128. doi: 10.1016/j.canlet.2011.09.003. [DOI] [PubMed] [Google Scholar]
- 20.Giordano M, Croci DO, Rabinovich GA. Galectins in hematological malignancies. Curr Opin Hematol. 2013;20:327–335. doi: 10.1097/MOH.0b013e328362370f. [DOI] [PubMed] [Google Scholar]
- 21.Harazono Y, Nakajima K, Raz A. Why anti-Bcl-2 clinical trials fail: a solution. Cancer Metastasis Rev. 2014;33:285–294. doi: 10.1007/s10555-013-9450-8. [DOI] [PMC free article] [PubMed] [Google Scholar]
- 22.Vladoiu MC, Labrie M, St-Pierre Y. Intracellular galectins in cancer cells: potential new targets for therapy (Review) Int J Oncol. 2014;44:1001–1014. doi: 10.3892/ijo.2014.2267. [DOI] [PubMed] [Google Scholar]
- 23.Streetly MJ, Maharaj L, Joel S, Schey SA, Gribben JG, Cotter FE. GCS-100, a novel galectin-3 antagonist, modulates MCL-1, NOXA, and cell cycle to induce myeloma cell death. Blood. 2010;115:3939–3948. doi: 10.1182/blood-2009-10-251660. [DOI] [PMC free article] [PubMed] [Google Scholar]
- 24.Levy R, Biran A, Poirier F, Raz A, Kloog Y. Galectin-3 mediates cross-talk between K-Ras and Let-7c tumor suppressor microRNA. PLoS One. 2011;6:e27490. doi: 10.1371/journal.pone.0027490. [DOI] [PMC free article] [PubMed] [Google Scholar]
- 25.Yoshii T, Fukumori T, Honjo Y, Inohara H, Kim HR, Raz A. Galectin-3 phosphorylation is required for its anti-apoptotic function and cell cycle arrest. J Biol Chem. 2002;277:6852–6857. doi: 10.1074/jbc.M107668200. [DOI] [PubMed] [Google Scholar]
- 26.Harazono Y, Kho DH, Balan V, Nakajima K, Zhang T, Hogan V, Raz A. Galectin-3 leads to attenuation of apoptosis through Bax heterodimerization in human thyroid carcinoma cells. Oncotarget. 2014;5:9992–10001. doi: 10.18632/oncotarget.2486. [DOI] [PMC free article] [PubMed] [Google Scholar]
- 27.Veschi V, Petroni M, Cardinali B, Dominici C, Screpanti I, Frati L, et al. Galectin-3 impairment of MYCN-dependent apoptosis-sensitive phenotype is antagonized by nutlin-3 in neuroblastoma cells. PLoS One. 2012;7:e49139. doi: 10.1371/journal.pone.0049139. [DOI] [PMC free article] [PubMed] [Google Scholar]
- 28.Lavra L, Rinaldo C, Ulivieri A, Luciani E, Fidanza P, Giacomelli L, et al. The loss of the p53 activator HIPK2 is responsible for galectin-3 overexpression in well differentiated thyroid carcinomas. PLoS One. 2011;6:e20665. doi: 10.1371/journal.pone.0020665. [DOI] [PMC free article] [PubMed] [Google Scholar]
- 29.Cecchinelli B, Lavra L, Rinaldo C, Iacovelli S, Gurtner A, Gasbarri A, et al. Repression of the antiapoptotic molecule galectin-3 by homeodomain-interacting protein kinase 2-activated p53 is required for p53-induced apoptosis. Mol Cell Biol. 2006;26:4746–4757. doi: 10.1128/MCB.00959-05. [DOI] [PMC free article] [PubMed] [Google Scholar]
- 30.Califice S, Castronovo V, Van Den Brûle F. Galectin-3 and cancer (Review) Int J Oncol. 2004;25:983–992. [PubMed] [Google Scholar]
- 31.Cheng CL, Hou HA, Lee MC, Liu CY, Jhuang JY, Lai YJ, et al. Higher bone marrow LGALS3 expression is an independent unfavorable prognostic factor for overall survival in patients with acute myeloid leukemia. Blood. 2013;121:3172–3180. doi: 10.1182/blood-2012-07-443762. [DOI] [PubMed] [Google Scholar]
- 32.Yamamoto-Sugitani M, Kuroda J, Ashihara E, Nagoshi H, Kobayashi T, Matsumoto Y, et al. Galectin-3 (Gal-3) induced by leukemia microenvironment promotes drug resistance and bone marrow lodgment in chronic myelogenous leukemia. Proc Natl Acad Sci U S A. 2011;108:17468–17473. doi: 10.1073/pnas.1111138108. [DOI] [PMC free article] [PubMed] [Google Scholar]
- 33.Nakayama R, Kuroda J, Taniyama N, Yamamoto-Sugitani M, Wada S, Kiyota M, et al. Suppression of SERPINA1-albumin complex formation by galectin-3 overexpression leads to paracrine growth promotion of chronic myelogenous leukemia cells. Leuk Res. 2014;38:103–108. doi: 10.1016/j.leukres.2013.07.026. [DOI] [PubMed] [Google Scholar]
- 34.Hu K, Gu Y, Lou L, Liu L, Hu Y, Wang B, Luo Y, et al. Galectin-3 mediates bone marrow microenvironment-induced drug resistance in acute leukemia cells via Wnt/β-catenin signaling pathway. J Hematol Oncol. 2015;8:1–10. doi: 10.1186/s13045-014-0099-8. [DOI] [PMC free article] [PubMed] [Google Scholar]
- 35.Kojima K, Kornblau SM, Ruvolo V, Dilip A, Duvvuri S, Davis RE, et al. Prognostic impact and targeting of CRM1 in acute myeloid leukemia. Blood. 2013;121:4166–4174. doi: 10.1182/blood-2012-08-447581. [DOI] [PMC free article] [PubMed] [Google Scholar]
- 36.Song S, Ji B, Ramachandran V, Wang H, Hafley M, Logsdon C, Bresalier RS. Overexpressed galectin-3 in pancreatic cancer induces cell proliferation and invasion by binding Ras and activating Ras signaling. PLoS One. 2012;7:e42699. doi: 10.1371/journal.pone.0042699. [DOI] [PMC free article] [PubMed] [Google Scholar]
- 37.Shahbazi J, Lock R, Liu T. Tumor Protein 53-Induced Nuclear Protein 1 Enhances p53 Function and Represses Tumorigenesis. Front Genet. 2013;4:80. doi: 10.3389/fgene.2013.00080. [DOI] [PMC free article] [PubMed] [Google Scholar]
- 38.Tsay YG, Lin NY, Voss PG, Patterson RJ, Wang JL. Export of galectin-3 from nuclei of digitonin-permeabilized mouse 3T3 fibroblasts. Exp Cell Res. 1999;252:250–261. doi: 10.1006/excr.1999.4643. [DOI] [PubMed] [Google Scholar]
- 39.Haudek KC, Spronk KJ, Voss PG, Patterson RJ, Wang JL, Arnoys EJ. Dynamics of galectin-3 in the nucleus and cytoplasm. Biochim Biophys Acta. 2010;1800:181–189. doi: 10.1016/j.bbagen.2009.07.005. [DOI] [PMC free article] [PubMed] [Google Scholar]
- 40.Funasaka T, Raz A, Nangia-Makker P. Nuclear transport of galectin-3 and its therapeutic implications. Semin Cancer Biol. 2014;27:30–38. doi: 10.1016/j.semcancer.2014.03.004. [DOI] [PMC free article] [PubMed] [Google Scholar]
- 41.Tan DS, Bedard PL, Kuruvilla J, Siu LL, Razak AR. Promising SINEs for embargoing nuclear-cytoplasmic export as an anticancer strategy. Cancer Discov. 2014;4:527–537. doi: 10.1158/2159-8290.CD-13-1005. [DOI] [PubMed] [Google Scholar]
- 42.Ranganathan P, Yu X, Na C, Santhanam R, Shacham S, Kauffman M, Walker A, Klisovic R, Blum W, Caligiuri M, Croce CM, Marcucci G, Garzon R. Preclinical activity of a novel CRM1 inhibitor in acute myeloid leukemia. Blood. 2012;120:1765–1773. doi: 10.1182/blood-2012-04-423160. [DOI] [PMC free article] [PubMed] [Google Scholar]
- 43.Wu Y, Mehew JW, Heckman CA, Arcinas M, Boxer LM. Negative regulation of bcl-2 expression by p53 in hematopoietic cells. Oncogene. 2001;20:240–251. doi: 10.1038/sj.onc.1204067. [DOI] [PubMed] [Google Scholar]
- 44.Lee YK, Lin TH, Chang CF, Lo YL. Galectin-3 silencing inhibits epirubicin-induced ATP binding cassette transporters and activates the mitochondrial apoptosis pathway via β-catenin/GSK-3β modulation in colorectal carcinoma. PLoS One. 2013;8:e82478. doi: 10.1371/journal.pone.0082478. [DOI] [PMC free article] [PubMed] [Google Scholar]
- 45.Wang Y, Balan V, Kho D, Hogan V, Nangia-Makker P, Raz A. Galectin-3 regulates p21 stability in human prostate cancer cells. Oncogene. 2013;32:5058–5065. doi: 10.1038/onc.2012.528. [DOI] [PMC free article] [PubMed] [Google Scholar]
- 46.Yoshimoto G, Miyamoto T, Jabbarzadeh-Tabrizi S, Iino T, et al. FLT3-ITD up-regulates MCL-1 to promote survival of stem cells in acute myeloid leukemia via FLT3-ITD-specific STAT5 activation. Blood. 2009;114:5034–5043. doi: 10.1182/blood-2008-12-196055. [DOI] [PMC free article] [PubMed] [Google Scholar]
Associated Data
This section collects any data citations, data availability statements, or supplementary materials included in this article.


