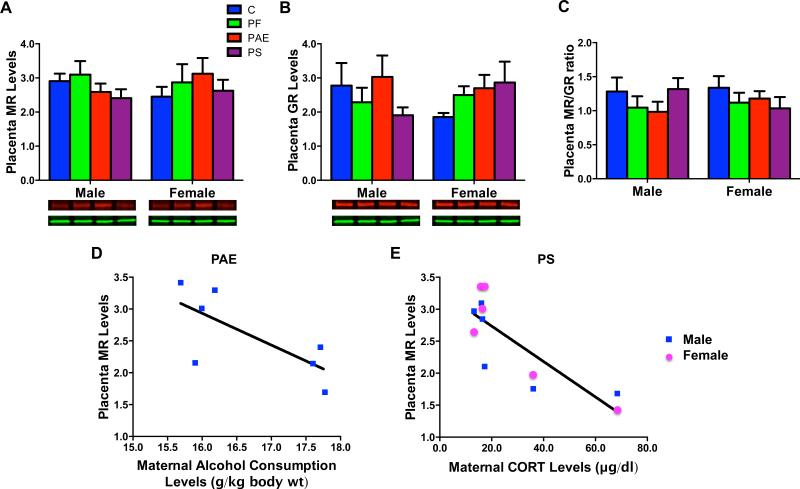
Fig 4.
Placental MR (A), GR (B) protein levels (relative to GAPDH), and MR/GR ratio (C), with representative Western Blots of respective target proteins GR [95 kDa in red], MR [102 kDa in red], and internal control GAPDH [36 kDa in green]) underneath each graph. (D), A negative correlation (P = 0.067) that approached significance between maternal alcohol consumption during gestation week 3 and MR protein levels in male PAE fetuses. (E), A significant negative correlation (P < 0.05) between maternal CORT levels and MR protein levels in PS male and female fetuses.

