Abstract
We are in a crisis of bacterial resistance. For economic reasons, most pharmaceutical companies are abandoning antimicrobial discovery efforts, while, in health care itself, infection control and antibiotic stewardship programs have generally failed to prevent the spread of drug-resistant bacteria. At this point, what can be done? The first step has been taken. Governments and international bodies have declared there is a worldwide crisis in antibiotic drug resistance. As discovery efforts begin anew, what more can be done to protect newly developing agents and improve the use of new drugs to suppress resistance emergence? A neglected path has been the use of recent knowledge regarding antibiotic dosing as single agents and in combination to minimize resistance emergence, while also providing sufficient early bacterial kill. In this review, we look at the data for resistance suppression. Approaches include increasing the intensity of therapy to suppress resistant subpopulations; developing concepts of clinical breakpoints to include issues surrounding suppression of resistance; and paying attention to the duration of therapy, which is another important issue for resistance suppression. New understanding of optimizing combination therapy is of interest for difficult-to-treat pathogens like Pseudomonas aeruginosa, Acinetobacter spp., and multidrug-resistant (MDR) Enterobacteriaceae. These lessons need to be applied to our old drugs to preserve them as well and need to be put into national and international antibiotic resistance strategies. As importantly, from a regulatory perspective, new chemical entities should have a corresponding resistance suppression plan at the time of regulatory review. In this way, we can make the best of our current situation and improve future prospects.
INTRODUCTION
Antimicrobial resistance is a crisis of incalculable proportion. We are in jeopardy of having many untreatable serious bacterial infections for the first time in decades (1, 2). Besides the serious morbidity and mortality affecting individual patients, it is important to recognize the impact of drug resistance on other areas of medicine. For example, the ability to treat many types of cancer is inextricably linked with the use of antibiotics to treat infections that arise during periods of profound, persistent granulocytopenia. Similarly, the success of all solid-organ transplant programs depends on an ability to treat life-threatening infections. Surgical interventions disrupt anatomical boundaries, and infection is an ever-present threat. Therefore, the inability to treat pathogens will compromise the outcomes of patients with many different types of disease.
HOW DID WE GET INTO THIS SITUATION?
The first thing that has changed is the drug development landscape. Until recently, there were vibrant and effective drug discovery and development programs, with tens of companies invested in the field of anti-infectives. This activity led to a responsive program and a pipeline of agents that could be deployed for treatment of resistant pathogens. For example, the advent of β-lactamase-bearing Staphylococcus aureus was met with the development of methicillin and, later, isoxazolyl penicillins. Similarly, when TEM- and SHV-type enzymes emerged in the clinic, changes to side chains in cephalosporins were engineered, enabling them to retain activity. Likewise, β-lactamase inhibitors such as the clavams and penicillanic acid sulfones were developed and rapidly incorporated into clinical practice.
Regulators and the pharmaceutical industry have been somnolent until recently. Multimergers and supermergers of companies have resulted in a cut in the number of antimicrobial agent discovery programs. When one of these large pharmaceutical companies decides that the return on investment is insufficient to support anti-infective drug development programs, the abandonment of the area removes multiple older research and development programs. Now, with the advent of Klebsiella pneumoniae carbapenemase (KPC)-type β-lactamases, extended-spectrum β-lactamases (ESBLs) (e.g., CTX-M enzymes), and NDM-type zinc metalloenzymes, many common pathogens are virtually untreatable. The only active agents, such as colistin, frequently have both therapeutic and toxicological limitations. Pathogens such as Pseudomonas aeruginosa, Acinetobacter spp., and multidrug-resistant (MDR) Enterobacteriaceae are particularly difficult therapeutic problems because of the multitude of resistance mechanisms that are operational alone or in combination. All of a sudden, the therapeutic locker is empty. Older agents such as colistin, fosfomycin, temocillin, amdinocillin, or aztreonam need to be reexamined in the light of new knowledge to optimize their activity.
The alarm has been sounded (1–3), and a number of programs have now started to search for novel new molecular entities (4). Examples include new aminoglycosides such as plazomicin that retain activity against many isolates resistant to older agents such as tobramycin and amikacin; a number of new β-lactamase inhibitors that inhibit Kpc enzymes, AmpC enzymes, and ESBLs, among others; and new molecular targets such as LpxC. We await the advent of these agents, but this poses a question:
WHAT CAN AND SHOULD BE DONE NOW?
While awaiting the development of new agents, it is important to maintain the clinical utility of the drugs that are currently available. There are a number of different ways to do this. Perhaps the most important are thoughtful stewardship and active infection control. We should NOT use antimicrobials needlessly. We should practice good infection control. These and other straightforward approaches are necessary, but the objectives are often difficult to achieve for health care providers. All of these stewardship issues have been extensively reviewed (5, 6). Note that, to have a successful outcome, it is necessary to have a team approach employing experts as well as support from hospital administration to implement a comprehensive and effective stewardship program. An area that has been virtually ignored is the use of pharmacological-pharmacodynamic approaches aimed at suppressing resistance amplification. It is this approach that we examine here.
HOW IS RESISTANCE SUPPRESSION DIFFERENT FROM OTHER EXPOSURE-RESPONSE RELATIONSHIPS?
In traditional exposure-response relationships, the more intense the regimen, the greater the effect until a maximal response is induced. Such a relationship is evident when one considers the link between drug exposure and bacterial kill as well as drug exposure and survival. These relationships are referred to as monotonic functions.
With resistance suppression, the shape of the relationship between exposure and response is different. At relatively low exposures to the active agent, little selective pressure is brought to bear. Consequently, there is little amplification of a less-susceptible subpopulation. As exposures increase, the selective pressure increases, causing more injury to the fully susceptible population relative to the less-susceptible population and causing amplification of the less-susceptible population. This continues until a maximal size of the less-susceptible population is achieved in a specific time. Use of progressively larger exposures will begin to affect the resistant subpopulation, causing a decline to their starting value or below. The overall shape of this relationship has been referred to as an “inverted U” (7, 8) and is nonmonotonic (Fig. 1).
FIG 1.
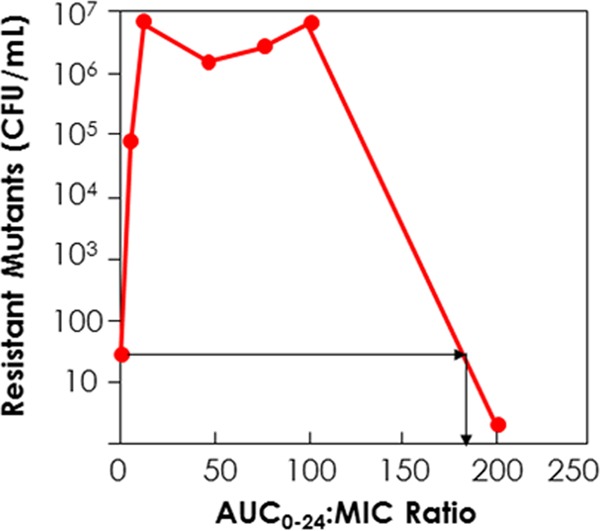
“Inverted U” plot. Low drug exposures cause little selective pressure, and little resistance amplification occurs. Higher drug exposures cause maximal resistance amplification. After a sufficient exposure is attained, resistance suppression is achieved. The bottom red dot on the y axis represents the level of resistant organisms at baseline. All other data points represent resistant organism counts at 48 h of therapy.
CORE IDEAS FOR RESISTANCE SUPPRESSION
Below, we examine factors that can have an impact on the emergence of resistance. Examples include (i) the impact of increasing drug exposure with single-agent chemotherapy, (ii) the impact of duration of therapy, (iii) what the pharmacodynamics drivers are for resistance suppression and how they are concordant with or different from the pharmacodynamics drivers for cell kill, (iv) what resistance mechanisms drive most resistance emergence and how they interact, and, finally, (v) combination chemotherapy.
SUPPRESSING RESISTANT MUTANT AMPLIFICATION WITH DOSING (THERAPY INTENSITY)
The concept of a mutant prevention concentration (MPC) was proposed by Drlica and colleagues (9, 10). This simple but elegant concept starts with the idea that a large initial bacterial burden has a very high probability of containing a first-stage mutant organism (e.g., an organism with a target site mutation, efflux pump stable overexpression, stable derepression of an inducible β-lactamase, and porin downregulation). The highest probability of developing a strain that is doubly resistant is for the first-stage resistant isolate to develop a second resistance mechanism. Therefore, if an exposure profile is used that prevents amplification of the first-stage resistant organism, the ability to acquire a second-stage mutation will also be prevented. The concept of the MPC has been used to account for in vitro data and is somewhat limited because it explicitly states that the drug concentration needs to be above a specific threshold (the MPC) throughout the dosing interval. As is discussed below, there may be other pharmacodynamic drivers that are more closely linked to resistance suppression (at least in some instances).
The first demonstration of resistance suppression in vivo or in vitro was performed in a murine thigh infection model (11) and an in vitro pharmacodynamic model (8). Pseudomonas aeruginosa was the challenge strain and levofloxacin the drug employed in the animal model (11) and moxifloxacin the drug employed in the in vitro model (8). In contrast to other studies conducted in mice in that time frame, the animals were nonneutropenic.
The first set of experiments (11) examined two different bacterial challenges. In the first (Fig. 2a), the burden was sufficiently below the inverse of the mutational frequency to resistance that there was a low probability of having resistant mutants in the population. In another cohort, the challenge inoculum was such that at therapy initiation there was a high likelihood of resistant isolates already being present (Fig. 2b). The results show a striking contrast. When the relationship between levofloxacin AUC/MIC ratio in the mouse and the amount of biological activity was examined , the members of the lower-inoculum group uniformly showed the same microbiological effect with a less intense drug exposure. This difference was on the order of 2-fold to greater than 5-fold. The presence of a small, preexistent less-susceptible population made the therapeutic problem much more difficult. This is because the drug pressure can kill the fully susceptible population but the less-susceptible population amplifies, essentially replacing easier-to-treat organisms with ones more difficult to treat.
FIG 2.
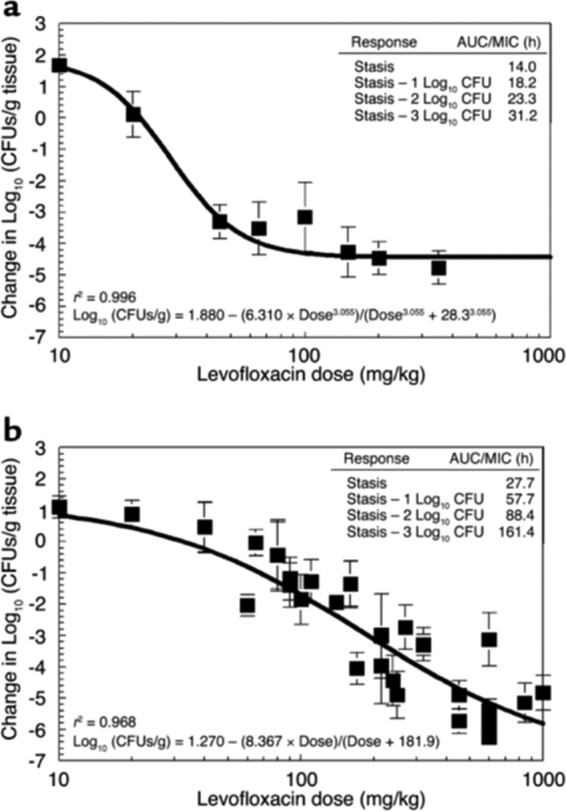
P. aeruginosa dose response. Normal mice were inoculated with about 107 (a) or 108 (b) bacteria per thigh. The levofloxacin MIC and minimal bacterial concentration (MBC) were 0.8 mg/liter and 1.6 mg/liter, respectively. The x axis displays the dose exposures in milligrams per kilograms. The model allowed calculation of the dose necessary to achieve stasis (i.e., to return the colony counts at sacrifice to that used for the challenge), as well as 1, 2, and 3 log10 (CFU/g) reductions in bacterial counts from the stasis point. These data are displayed in the insets as AUC/MIC ratio values for each of these degrees of drug effect. Comparison of microbiological outcome endpoints shows that levofloxacin treatment of P. aeruginosa infections is inoculum dependent. At the higher infection inoculum, the microbial population burden significantly exceeded the inverse of the mutation frequency with respect to resistance. At exposures that killed the sensitive population, the resistant population was able to survive, allowing this subpopulation to be amplified by the drug pressure. Only with sufficient exposure to inhibit and kill the resistant subpopulation do we attain a larger overall reduction of bacterial load.
A range of doses were studied and the impact on both populations delineated. All these data were simultaneously modeled using a set of differential equations. The model fit the data well. This allowed calculation of drug exposures that would (i) suppress resistant mutant amplification or (ii) optimally amplify the less-susceptible subpopulation. This allowed the performance of a prospective validation experiment to demonstrate that the model was able to accurately predict outcomes. Doses were administered to infected mice that would generate an AUC/MIC ratio of 52, which was predicted to amplify the resistant subpopulation. Another dose drove an AUC/MIC ratio of 157, which was predicted to suppress resistant subpopulation amplification. It should be noted that the duration was longer than that used in the original studies at 48 versus 24 h.
The results are shown in Fig. 3. In panel a, the data indicate that the resistant population does amplify with the lower-intensity exposure. The total burden falls by only approximately 0.75 log10 (CFU/g), but the burden of resistant isolates increases by over twice that amount. We are indeed trading susceptible for less-susceptible organisms. In panel b, the data show that the higher-intensity exposure does prevent the amplification of less-susceptible organisms. This was the first demonstration that it is possible to counterselect resistance emergence at the primary infection site through appropriate dosing of a single agent.
FIG 3.
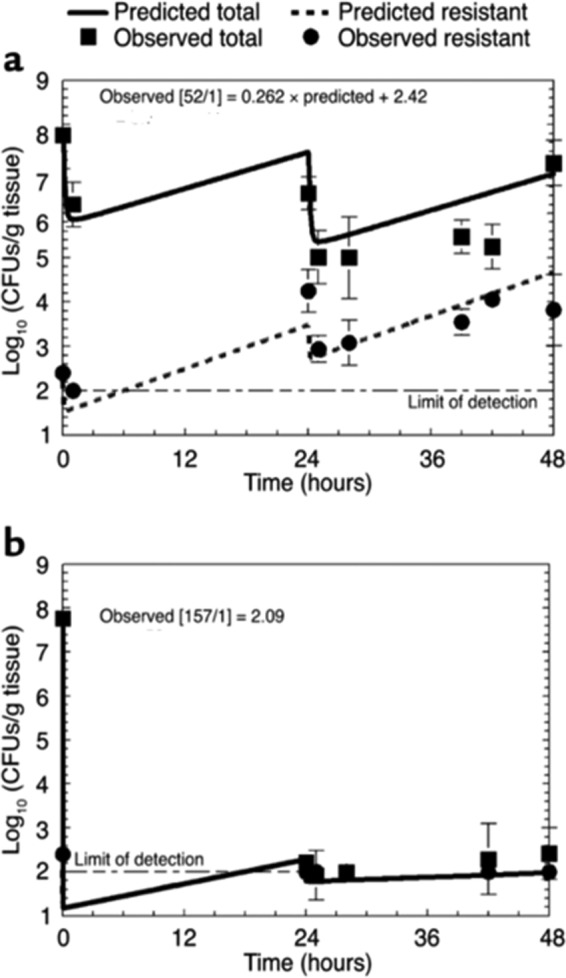
Prospective validation study from the predictions of a mathematical model regarding total cell kill and resistant subpopulation amplification. (a) An exposure calculated to expand the resistant subpopulation was employed (AUC/MIC ratio = 52). (b) An exposure that was calculated to suppress mutant subpopulation amplification was employed (AUC/MIC ratio = 157). The lines are prospective prediction lines and not best-fit lines.
When the resistant isolates were sequenced, there were no mutations in the topoisomerase II or IV genes. Rather, there was an upregulation of efflux pumps as the mechanism for loss of susceptibility to the fluoroquinolone. This was an important finding and one which is discussed below. Finally, as we had prospectively validated that an AUC/MIC ratio of 157 would suppress resistance, we performed Monte Carlo simulation to identify by MIC determinations how often a standard dose of levofloxacin (750 mg daily) would attain the requisite intensity of exposure for resistance suppression. At an MIC of 0.5 mg/liter, the target attainment was slightly in excess of 80%. When an expectation was analyzed across a range of MIC values, as one would see in the clinic, the dose would achieve the appropriate drug exposure for resistance suppression about 62% of the time. This was a first clue that for many single-agent therapies, attainment of resistance suppression is quite a difficult goal, leading to the hypothesis that combination chemotherapy may be the way forward to attain this endpoint in an acceptable proportion of patients.
This type of exposure-range experiment was recapitulated in an in vitro hollow-fiber infection model [HFIM] (12). The same strain of P. aeruginosa was used, but another quinolone, garenoxacin, served as the drug. The same approach was taken. A number of candidate exposures were studied and mathematically modeled, with exposures predicted to amplify and suppress resistant subpopulations identified. This was followed by a prospective validation experiment. The results are displayed in Fig. 4. As expected, the no-treatment control generates a stable fraction of less-susceptible organisms, as there is no selective pressure. The substantial exposure of an AUC/MIC ratio of 137 still behaves as predicted and allows amplification of the resistant subpopulation, resulting in essentially complete replacement of the whole population by resistant organisms by h 36. The regimen designed to suppress resistant clone amplification (AUC/MIC ratio = 201) succeeded in doing so. This prediction was again demonstrated to be accurate in another prospective validation experiment, thus demonstrating the utility of the approach.
FIG 4.
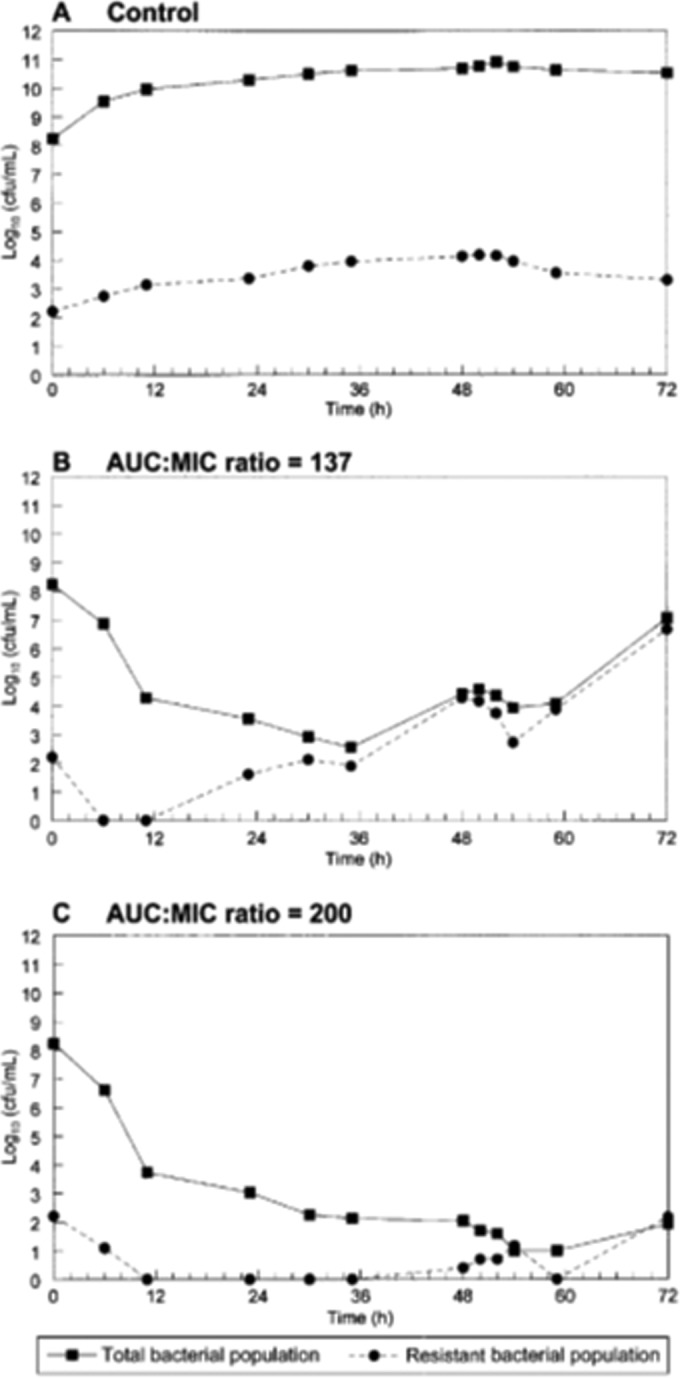
Recapitulation of the experiment whose results are shown in Fig. 3 but employing the hollow-fiber infection model with the same strain of Pseudomonas aeruginosa as described for Fig. 2 and 3. This was a prospective validation study designed from mathematical modeling to compare a control conditions (A) to an exposure (AUC/MIC ratio) of 137 (B) and an exposure of 200 (C). Both exposures gave results as predicted.
The AUC/MIC ratio value of 201 was higher than that identified in the mouse (AUC/MIC ratio of 157), but this was to be expected, as the HFIM completely lacks an immune system, while the mouse was granulocyte replete and otherwise normal. Also, the murine exposure was total drug (levofloxacin is approximately 30% bound in the mouse), while the HFIM has only free drug. The modest difference (201/110 = 1.83) is consistent with the impact of granulocytopenia demonstrated in a murine system by Andes and Craig (13). Finally, also in line with the previous study, the first 48 h of the experiment did not demonstrate any mutations in the target site. All organisms mediated resistance through efflux pump upregulation, as seen previously (11).
The fluoroquinolone moxifloxacin was also studied in an in vitro system for Pseudomonas (8). In this study, resistance suppression levels were compared between P. aeruginosa and S. pneumoniae. Not surprisingly, it is substantially more difficult to suppress resistance in the Gram-negative bacillus than in the pneumococcus.
These examples were supplemented in a murine pneumonia model with P. aeruginosa and levofloxacin (14). Somewhat surprisingly, the bacterial kill targets and the resistance suppression targets were lower than those seen in the murine thigh model. It should be recognized that only a single isolate was studied and that these outcomes should not be generalized without further strains being studied (14, 15).
Both examples involved quinolone antimicrobials. However, there are other examples of drugs in many therapeutic classes that show the same thing. In Table 1, we enumerate examples of different drugs and pathogens for which it is possible to demonstrate that resistance suppression is possible with monotherapy.
TABLE 1.
Examples of agents and pathogens where there is evidence that resistance emergence can be suppressed by dosing for single-agent therapy
| Drug class | Pathogen | Reference(s) |
|---|---|---|
| Quinolones | Pseudomonas aeruginosa | 8, 11, 12 |
| Klebsiella pneumoniae | 7 | |
| Staphylococcus aureus | 16, 17, 18, 19 | |
| Streptococcus pneumoniae | 20, 21, 22 | |
| Mycobacterium tuberculosis | 23 | |
| Yersinia pestis | 24, 25, 26 | |
| Bacillus anthracis | 27, 28, 29 | |
| β-Lactams | Pseudomonas aeruginosa | 30, 31, 32, 33 |
| Staphylococcus aureus | 34, 35, 36 | |
| Enterobacteriaceae | 36 | |
| Acinetobacter spp. | 33 | |
| Isoniazid | Mycobacterium tuberculosis | 37, 38 |
| Rifampin | Mycobacterium tuberculosis | 39 |
| Glycopeptides | Staphylococcus aureus/enterococci | 40 |
| Daptomycin | Staphylococcus aureus | 41 |
MPC-plus.
The MPC concept was refined and extended (42–44). The “time in the mutant prevention window” approach has been proposed as a way to employ the MPC concept in in vitro systems with changing drug concentrations like the HFIM and in-animal systems and, ultimately, in patients. The extension of the MPC is that there is a concentration of drug low enough that it exerts minimal selective pressure. This concentration is the floor of the window. The top of the window is the MPC. Regimens that keep drug exposure out of the window should not produce amplification of a less-susceptible population. This was shown to work in both HFIM and an animal system (16, 42–44). This concept has some of the drawbacks of the MPC. It essentially forces the linked dynamic index into a time mode which may not be true. Further, Firsov (17, 45) clearly demonstrated that there were substantially different outcomes for regimens that traversed the window in different spots (middle, near the top, near the floor). Chavanet et al. (46) had similar findings.
For a range of Gram-positive and Gram-negative bacteria, the pharmacodynamic index size for amplification of antimicrobial-resistant populations, as indicated by changes in population profiles, has been compared to the pharmacodynamic index sizes associated with a bacteriostatic or −1 log drop bactericidal endpoint at 24 h (Table 2). In general, the pharmacodynamic index sizes around those associated with a 0 or 1 log kill at 24 h are associated with emergence of resistance. This is significant, as the pharmacodynamic target used in setting clinical breakpoints is that associated with a 0 to 1 log drop in pathogen count at 24 h. The implication of this is that for most presently used agents, strains with MICs close to the clinical breakpoint are at risk of emergence of resistance when drugs are used as monotherapy. There is at present no way to warn prescribers of this risk, as most susceptibility reports from laboratories are issued as “sensitive” without an attached MIC value or qualification.
TABLE 2.
Pharmacodynamic index values for bacterial inhibition and kill and for emergence of resistant subpopulationsa
| Pathogen | Drug | PDI | PDI for: |
Reference | |
|---|---|---|---|---|---|
| 0 to −1 log kill at 24 h | Amplification of resistance | ||||
| S. aureus | Ceftaroline | T>MIC(%) | 13–40 | 15–30 | 34 |
| Razupenem | T>MIC(%) | 4–32 | 0.5–35 | 36 | |
| Telavancin | AUC/MIC | 3–98 | 1–175 | 40 | |
| Tomopenem | T>MIC(%) | 1–24 | 1–30 | 35 | |
| Daptomycin | AUC/MIC | 14–71 | 0.5–40 | 41 | |
| Enterococcus | Telavancin | AUC/MIC | 6–60 | 1–50 | 40 |
| Enterobacteriaceae | Razupenem | T>MIC | 28–56 | 1–69 | 36 |
| P. aeruginosa | Doripenem | T.MIC | 14–42 | 12–37 | 33 |
| Acinetobacter | Doripenem | T>MIC | 9–32 | 12 | 33 |
PDI, pharmacodynamic index.
WHAT ABOUT DURATION OF THERAPY?
Therapy duration is one of the major understudied areas of infectious diseases therapeutics. Two of the major goals of therapy are to generate enough antimicrobial activity to allow the patient to have a good clinical outcome of a serious bacterial infection and to do so without amplifying a less-susceptible population of organisms. A related goal, which we do not consider further here, is to avoid concentration-related adverse events with the application of chemotherapy.
Duration of antibiotic exposure was described as a factor in the risk of emergence of resistance in preclinical models in 2003 (18).
The quinolone garenoxacin was studied in the HFIM against a methicillin-susceptible isolate of Staphylococcus aureus (ATCC 25925). An exposure range study was performed, and all pharmacokinetic and pharmacodynamic data were simultaneously analyzed using a set of nonhomogenous differential equations (18). Examination of the time-effect courses of 7 regimens (AUC/MIC ratios of 0 to 604) demonstrated that increasing exposures held the amplification of a less-susceptible population in check for increasing periods of time until suppression was obtained to the end of the experiment, a clinically relevant period of 10 days. A mathematical model was then employed to calculate two regimens of different intensities whereby it was predicted that one regimen would hold the less-susceptible population in check for 5 days but would fail thereafter whereas the other would be able to hold the less-susceptible population in check for the full 10 days. Calculation showed that these regimens represented an AUC/MIC ratio of 100 (failure after 5 days) and an AUC/MIC ratio of 280 (suppression of resistance amplification for 10 days). The results of a prospective validation study are displayed in Fig. 5. In panel A, the total bacterial counts for the no-treatment control and the treatment regimens of AUC/MIC ratios of 100 and 280 are displayed. As can be seen, both regimens drove 5.5 to 6.0 log10 (CFU/ml) cell kill by day 5. The higher-intensity regimen continued to suppress amplification of a less-susceptible population through day 10, while the lower-intensity regimen failed directly after day 5, with both outcomes as predicted by the mathematical model. In panel B, the resistant subpopulation amplification is shown to be the cause of the upturn in colony counts after day 5. It is clear that the duration of antimicrobial therapy has a direct effect on the probability of loss of control over the less-susceptible population. Much of the impact of duration is related to the number of rounds of replication that the organism goes through. As mentioned above, both initial bacterial burden and regimen intensity also influence this. As is discussed below, there are other factors that have an impact, such as the step size of resistance emergence and the type of antimicrobial employed.
FIG 5.
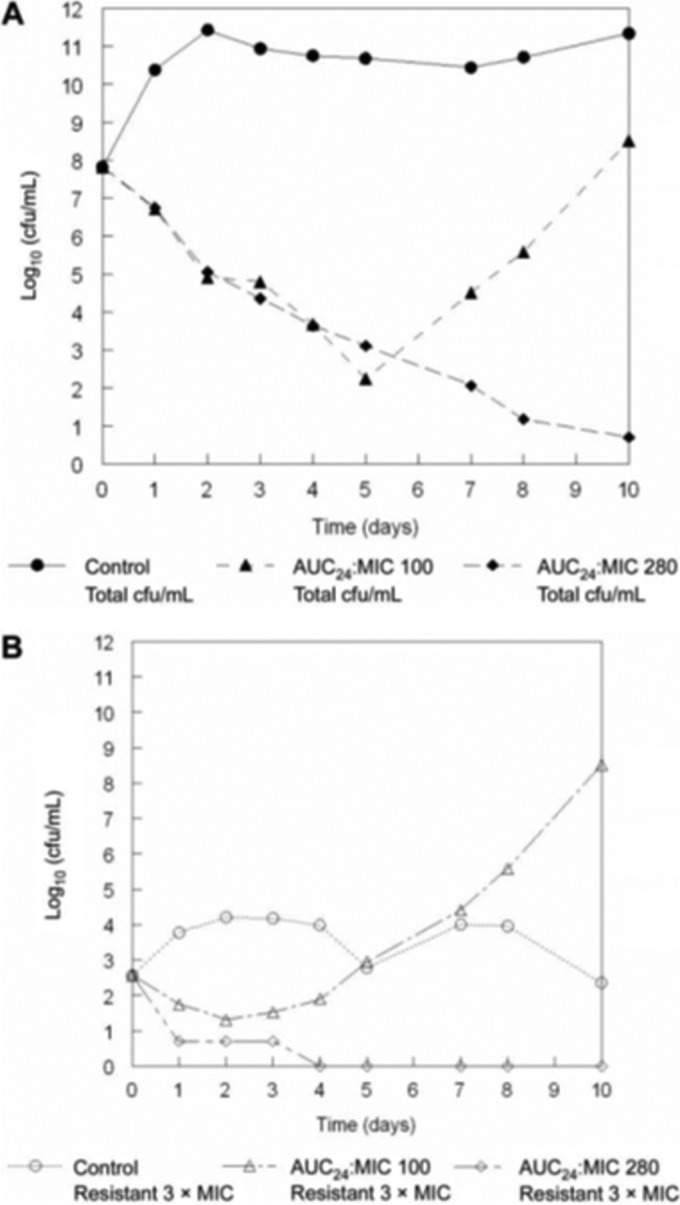
Prospective validation experiment examining the impact of therapy duration on amplification of resistant subpopulations. One exposure (AUC/MIC ratio = 100) was predicted to suppress resistant subpopulations for 5 days, while an AUC/MIC ratio of 280 was predicted to be required for 10 days of suppression. (A) Demonstration that these prospective predictions were validated. (B) Demonstration that the loss of control after day 5 was because of resistant subpopulation amplification.
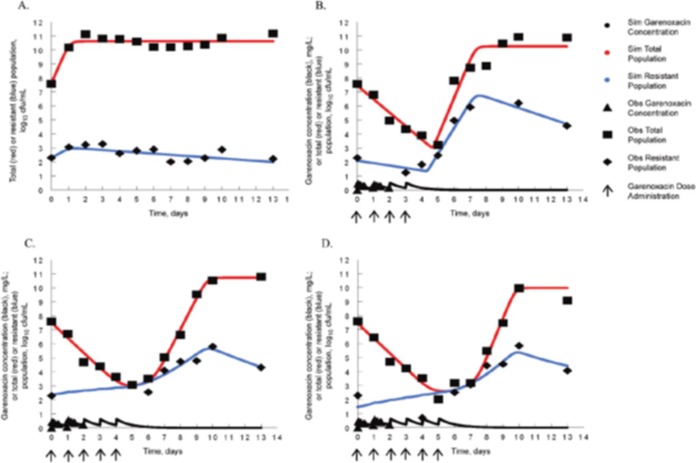
In a separate publication (19), but employing the same strain of Staphylococcus aureus as that described above and the same drug at the same intensity (AUC/MIC ratio of 100), the issue of what happens to organism populations after the selective pressure is removed was examined. In this experiment, 4, 5, and 6 daily doses of garenoxacin were administered in the HFIM, and the total bacterial burden, as well as that of the less-susceptible population, was measured out to day 13. The results are shown in Fig. 6. The reproducibility of the results over the first 4 to 6 days was excellent (see Fig. 3 of reference 18). There was continuing total decline in bacterial burden, but, as described in the preceding paper, the less-susceptible population amplified after day 5. This was expected, as the AUC/MIC ratio employed was 100, as in the previous paper (18). Importantly, the susceptible population outgrew the less-susceptible population after the last dose impact had dissipated, likely due to differences in biofitness. Also of interest, the death rate in the less-susceptible population was increased relative to that in the susceptible population, so that at the end of the experiment, the ratio of less-susceptible to fully susceptible organisms was reestablished at the baseline value. This implies that the critical issue with regard to length of therapy and therapy intensity for the resistant population is that, if it is not possible to administer a fully suppressive regimen because of the possibility of toxicity, then the therapy duration should be short enough so as to not eradicate the fully susceptible population. After therapy end, the susceptible population will have a reasonable likelihood of reestablishing itself. The issue is whether the cell kill obtained was sufficient to drive a good clinical outcome. Getting the bacterial burden below the half-saturation point for granulocytes will have a major role to play with regard to this outcome, as it has been shown that neutrophil cell kill is saturable (47–49).
FIG 6.
Examining the interaction of susceptible and less-susceptible bacterial populations after antimicrobial therapy is stopped. At a therapy intensity inadequate for the duration (AUC/MIC ratio = 100) of use, 4, 5, and 6 days of dosing were examined. By day 6, the susceptible population was almost extinguished. In all instances, the fully and less-susceptible populations reestablished their initial ratios after selective pressure was removed. (A) No-treatment control. (B) 4 drug doses. (C) 5 drug doses. (D) 6 drug doses. Obs, observed; Sim, simulated.
Therapy duration has been shown to have clinical relevance. Chastre and colleagues (50) examined 8 versus 15 days of therapy for ventilator-associated pneumonia. No mortality differences were seen. Recurrences occurred significantly more frequently in the 8-day group, but only for patients infected with nonfermentative Gram-negative bacilli (e.g., P. aeruginosa). However, there was significantly less resistance emergence among patients with recurrence in the 8-day group versus the 15-day group (42.1% versus 62.0%; P = 0.04).
WHAT ARE THE PHARMACODYNAMIC DRIVERS?
A substantial body of work has been performed to delineate the pharmacodynamic driver (e.g., the AUC/MIC ratio, maximum concentration of drug in serum [Cmax]/MIC ratio, and time > MIC or Cmin/MIC ratio) most closely linked to outcome, especially cell kill (51). Little work has gone into evaluation of the linked pharmacodynamic driver for suppression of resistance. One might expect that it would be the same as for bacterial cell kill.
However, there are instances where this is not correct. In several examples, the dynamic driver has been shown to switch. Three examples have the AUC/MIC ratio as the driver for cell kill but switch to the Cmax/MIC ratio for resistance suppression. In a single example, the AUC/MIC ratio as the dynamic driver for cell kill switches to time > MIC for resistance suppression. The examples are rifampin (39) for therapy for cases of Mycobacterium tuberculosis infection, linezolid (28) for Bacillus anthracis therapy, and moxifloxacin (25, 29) for Yersinia pestis and Bacillus anthracis therapy.
Rifampin.
This agent was studied in the HFIM for M. tuberculosis. When a cell kill dose fractionation study was performed, the AUC/MIC ratio was clearly the dynamically linked index (see Fig. 1 of reference 39). However, when the resistant clones and their amplification were examined, it was clear that Cmax/MIC ratio was the driver of suppression (Fig. 7). The reason for the switch may be speculated upon. Rifampin rapidly enters the bacterial cell (39). Its target site is RNA polymerase. It has been demonstrated (52, 53) that binding to the target site is quite rapid and results in a stable, long-lived complex. Consequently, attaining high rifampin concentrations, even if only transiently, may allow target site binding even with the resistant clones. It should be noted (Fig. 7) that substantial resistance suppression takes place only at peak concentrations that are quite suprapharmacological (and that are all free drug values) and likely represents only an in vitro observation. This is because the actual step size of change for the MIC in rpoB mutants is on the order of 32-fold to 128-fold.
FIG 7.
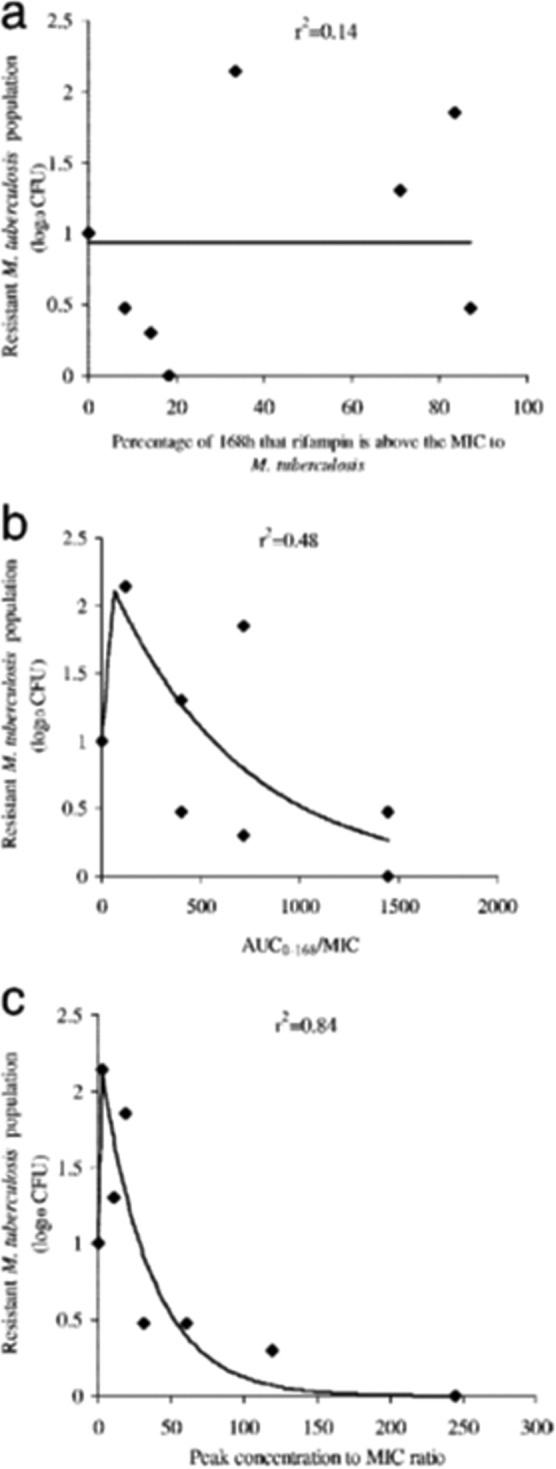
For the M. tuberculosis agent rifampin, the AUC/MIC ratio is the pharmacodynamics driver best linked to cell kill in this hollow-fiber infection model evaluation. In this experiment, the pharmacodynamics index most strongly linked to resistance suppression becomes the ratio of the peak concentration to the MIC (peak/MIC ratio). (A) Percentage of 168 h that rifampin is above the MIC for M. tuberculosis. (B) AUC0–168/MIC ratios. (C) Peak/MIC ratios.
Linezolid.
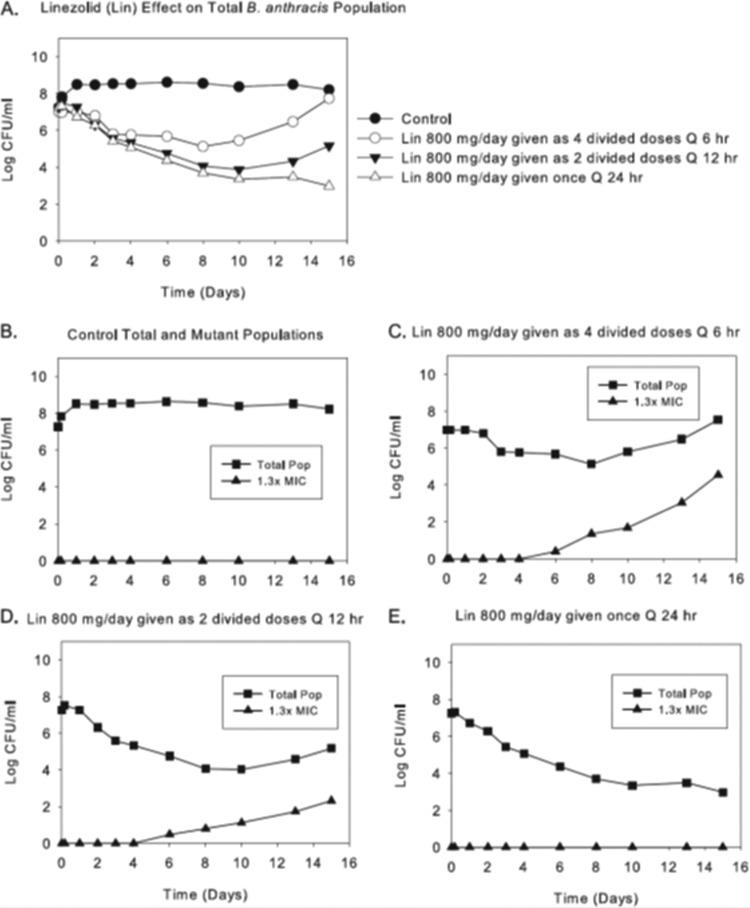
Likewise, in B. anthracis, killing of the susceptible population by linezolid is linked to the AUC/MIC ratio. However, linezolid switches to the Cmax/MIC ratio as the resistance suppression driver (28). In Fig. 8, we see an 800-mg total daily dose fractionated and administered as one dose daily, half the dose every 12 h, and one-quarter of the daily dose every 6 h. Only the once-daily schedule suppresses amplification of less-susceptible organisms. The total burdens are virtually identical among the treatment groups for the first 3 days. They separate as a function of resistance emergence thereafter, with the 12-hourly arm selecting for less resistance than the 6-hourly arm and the once-daily administration completely suppressing resistance emergence.
FIG 8.
Dose fractionation of total daily AUCs generated for linezolid (Lin) at 500 and 600 mg every 24 h (q24h). (A) Effects of each regimen, when given as one, two, or six equally divided doses each day, on the total B. anthracis population (Pop). (B to E) Effects of fractionation of the 600-mg dose of linezolid on total and resistant populations. (E) Effects of linezolid at 800 mg given once daily on these populations. The effects on resistance amplification of fractionating the 24-h AUC exposure generated for linezolid at 500 mg q24h are not shown. (A) The pharmacodynamic index linked to bacterial cell kill of B. anthracis by linezolid (first 4 days) is the AUC/MIC ratio in this hollow-fiber infection model evaluation. (B to E) For resistance suppression, the linked dynamic index switches to the peak/MIC ratio.
The reason for the switch for linezolid is more opaque than that for rifampin. The step size in the change in MIC is on the order of 2-fold. One could speculate that with this change one needs a higher peak concentration to generate sufficient occupancy of the A-site of the peptidyl transferase center of the ribosome to mediate inhibition of the less-susceptible population.
Moxifloxacin.
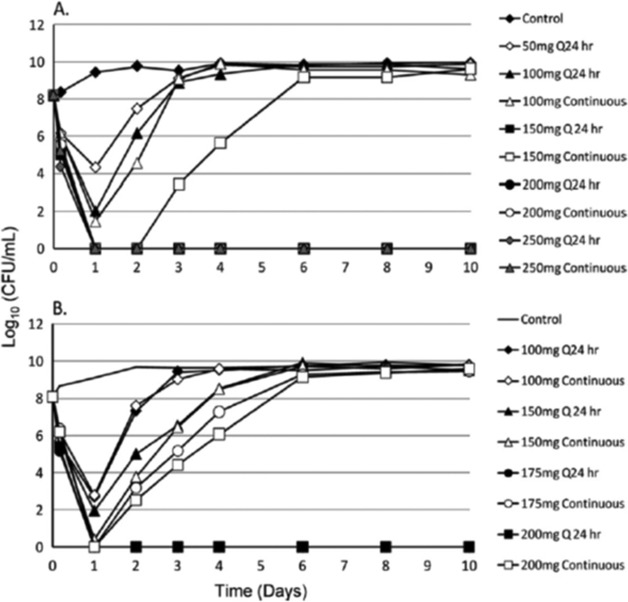
In an evaluation (25) of the fluoroquinolone moxifloxacin against Yersinia pestis, a dose range study was performed in the HFIM, with daily administration being compared to a continuous infusion of the agent (Fig. 9). For contrasts of regimens of 175 and 200 mg per day, the once-daily administration suppressed resistance amplification, whereas the continuous-infusion arm did not, leading to the conclusion that, in this instance, the Cmax/MIC ratio is the driver for resistance suppression for Y. pestis.
FIG 9.
For moxifloxacin, in the hollow-fiber infection model evaluation, the AUC/MIC ratio is the dynamic index most closely linked to bacterial cell kill for Yersinia pestis (see panels A and B, days 1 and 2). For resistance suppression, the index driving resistance suppression switches to the peak/MIC ratio (see panel A, dose of 150 mg per day, and panel B, doses of 150, 175, and 200 mg per day). The regimens selected for fractionation in the second experiment (B) were selected based on the results of the first study (A).
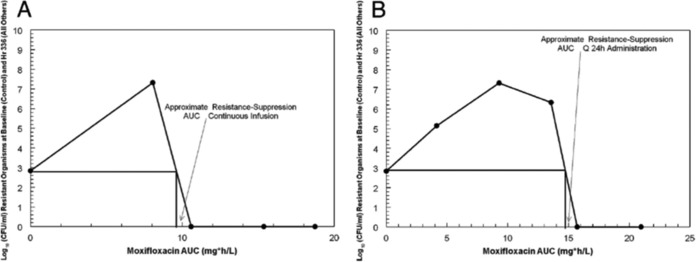
However, when Bacillus anthracis was examined (29), there was a switch in dynamic drivers, but it switched to time > MIC. In Fig. 10, the AUC associated with resistance suppression is shown for continuous administration versus once-daily administration. There is a requirement for a lower AUC administered as a continuous infusion relative to once-daily administration, leading to the conclusion that time > MIC is the best dynamic driver for suppression of less-susceptible organisms for Bacillus anthracis.
FIG 10.
Approximation of the moxifloxacin AUC (in milligrams per hour per liter) that suppresses the amplification of moxifloxacin-resistant subpopulations when the agent is administered as a continuous infusion (A) or once daily (B). For both panels, the number of resistant colonies (total population) at an AUC of zero was determined at time zero. Other colony counts were determined at the end of the experiment. The estimate of the resistance-suppressive AUC value is given by the intersection of the vertical line with the x axis. q24h, every 24 h. For B. anthracis, the AUC/MIC ratio is the dynamic index driving cell kill in this hollow-fiber infection model evaluation. For resistance suppression, the linked index switches to time at >MIC.
These results point to the issue of why the dynamic drivers for resistance suppression may differ across pathogens. The obvious difference between the two pathogens is that B. anthracis has a spore phase, while Y. pestis does not. In reference 29, it was demonstrated that there is a sensor effect in B. anthracis such that the continuous infusion is more easily recognized as a threat by the organism, generating an earlier return to the spore form. The once-daily profile keeps the organism in vegetative phase longer, generating a higher likelihood of resistance emergence and, therefore, a higher drug exposure to counterselect amplification of the less-susceptible population. What is clear is that the dynamic drivers for cell kill and resistance suppression may not be the same, and optimization for outcome of a particular endpoint needs to be explicitly tested.
REFERENCES
- 1.Spellberg B, Guidos R, Gilbert D, Bradley J, Boucher HW, Scheld WM, Bartlett JG, Edwards J Jr, Infectious Diseases Society of America. 2008. The epidemic of antibiotic-resistant infections: a call to action for the medical community from the Infectious Diseases Society of America. Clin Infect Dis 46:155–164. doi: 10.1086/524891. [DOI] [PubMed] [Google Scholar]
- 2.Davies SC. 2013. Infections and the rise of antimicrobial resistance. Annual report of the Chief Medical Officer, vol 2, 2011 Department of Health, London, United Kingdom. [DOI] [PubMed] [Google Scholar]
- 3.Boucher HW, Talbot GH, Bradley JS, Edwards JE, Gilbert D, Rice LB, Scheld M, Spellberg B, Bartlett J. 2009. Bad bugs, no drugs: no ESKAPE! An update from the Infectious Diseases Society of America. Clin Infect Dis 48:1–12. doi: 10.1086/595011. [DOI] [PubMed] [Google Scholar]
- 4.Centers for Disease Control and Prevention National Center for Emerging and Zoonotic Infectious Diseases (NCEZID) Division of Healthcare Quality Promotion (DHQP). 2014. Public health action plan to combat antimicrobial resistance. Centers for Disease Control and Prevention, Atlanta, GA. [Google Scholar]
- 5.Innovative Medicines Initiative. 2010. COMBACTE (Combating Bacterial Resistance in Europe). Innovative Medicines Initiative, Brussels, Belgium: http://www.imi.europa.eu/content/combacte. [Google Scholar]
- 6.Allerberger F, Gareis R, Jindrak V, Struelens MJ. 2009. Antibiotic stewardship implementation in the EU: the way forward. Expert Rev Anti Infect Ther 7:1175–1183. doi: 10.1586/eri.09.96. [DOI] [PubMed] [Google Scholar]
- 7.Tam VH, Louie A, Deziel MR, Liu W, Drusano GL. 2007. The relationship between quinolone exposures and resistance amplification is characterized by an inverted-U: a new paradigm for optimizing pharmacodynamics to counter-select resistance. Antimicrob Agents Chemother 51:744–747. doi: 10.1128/AAC.00334-06. [DOI] [PMC free article] [PubMed] [Google Scholar]
- 8.MacGowan AP, Rogers CA, Holt HA, Bowker KE. 2003. Activities of moxifloxacin against, and emergence of resistance in, Streptococcus pneumoniae and Pseudomonas aeruginosa in an in vitro pharmacokinetic model. Antimicrob Agents Chemother 47:1088–1095. doi: 10.1128/AAC.47.3.1088-1095.2003. [DOI] [PMC free article] [PubMed] [Google Scholar]
- 9.Zhou J, Dong Y, Zhao X, Lee S, Amin A, Ramaswamy S, Domagala J, Musser JM, Drlica K. 2000. Selection of antibiotic-resistant bacterial mutants: allelic diversity among fluoroquinolone-resistant mutants. J Infect Dis 182:517–525. doi: 10.1086/315708. [DOI] [PubMed] [Google Scholar]
- 10.Sindelar G, Zhao X, Liew A, Dong Y, Lu T, Zhou J, Domagala J, Drlica K. 2000. Mutation prevention concentration as a measure of fluoroquinolone potency against mycobacteria. Antimicrob Agents Chemother 44:3337–3343. doi: 10.1128/AAC.44.12.3337-3343.2000. [DOI] [PMC free article] [PubMed] [Google Scholar]
- 11.Jumbe N, Louie A, Leary R, Liu W, Deziel MR, Tam VH, Bachhawat R, Freeman C, Kahn JB, Bush K, Dudley MN, Miller MH, Drusano GL. 2003. Application of a mathematical model to prevent in-vivo amplification of antibiotic-resistant bacterial populations during therapy. J Clin Invest 112:275–285. doi: 10.1172/JCI200316814. [DOI] [PMC free article] [PubMed] [Google Scholar]
- 12.Tam VH, Louie A, Deziel MR, Liu W, Leary R, Drusano GL. 2005. Bacterial population responses to drug selective pressure: examination of garenoxacin against Pseudomonas aeruginosa. J Infect Dis 192:420–428. doi: 10.1086/430611. [DOI] [PubMed] [Google Scholar]
- 13.Andes D, Craig WA. 2002. Pharmacodynamics of the new fluoroquinolone gatifloxacin in murine thigh and lung infection models. Antimicrob Agents Chemother 46:1665–1670. doi: 10.1128/AAC.46.6.1665-1670.2002. [DOI] [PMC free article] [PubMed] [Google Scholar]
- 14.Louie A, Fregeau C, Liu W, Kulawy R, Drusano GL. 2009. Pharmacodynamics of levofloxacin in a murine pneumonia model of Pseudomonas aeruginosa infection: determination of epithelial lining fluid (ELF) targets. Antimicrob Agents Chemother 53:3325–3330. doi: 10.1128/AAC.00006-09. [DOI] [PMC free article] [PubMed] [Google Scholar]
- 15.MacGowan AP, Reynolds R, Noel AR, Bowker KE. 2009. Bacterial strain-to-strain variation in pharmacodynamic index magnitude, a hitherto unconsidered factor in establishing antibiotic clinical breakpoints. Antimicrob Agents Chemother 53:5181–5184. doi: 10.1128/AAC.00118-09. [DOI] [PMC free article] [PubMed] [Google Scholar]
- 16.Zhao X, Drlica K. 2002. Restricting the selection of antibiotic-resistant mutant bacteria: measurement and potential use of the mutant selection window. J Infect Dis 185:561–565. doi: 10.1086/338571. [DOI] [PubMed] [Google Scholar]
- 17.Firsov AA, Vostrov SN, Lubenko IY, Drlica K, Portnoy YA, Zinner SH. 2003. In vitro pharmacodynamics evaluation of the mutant selection window hypothesis using four fluoroquinolones against Staphylococcus aureus. Antimicrob Agents Chemother 47:1604–1613. doi: 10.1128/AAC.47.5.1604-1613.2003. [DOI] [PMC free article] [PubMed] [Google Scholar]
- 18.Tam VH, Louie A, Fritsche TR, Deziel M, Liu W, Brown DL, Deshpande L, Leary R, Jones RN, Drusano GL. 2007. Impact of drug-exposure intensity and duration of therapy on the emergence of Staphylococcus aureus resistance to a quinolone antimicrobial. J Infect Dis 195:1818–1827. doi: 10.1086/518003. [DOI] [PubMed] [Google Scholar]
- 19.Drusano GL, Liu W, Brown DL, Rice LB, Louie A. 2009. Impact of short-course quinolone therapy on susceptible and resistant populations of Staphylococcus aureus. J Infect Dis 199:219–226. doi: 10.1086/595739. [DOI] [PubMed] [Google Scholar]
- 20.Jumbe NL, Louie A, Miller MH, Liu W, Deziel MR, Tam VH, Bachhawat R, Drusano GL. 2006. Quinolone efflux pumps play a central role in emergence of resistance to fluoroquinolones in Streptococcus pneumoniae. Antimicrob Agents Chemother 50:310–317. doi: 10.1128/AAC.50.1.310-317.2006. [DOI] [PMC free article] [PubMed] [Google Scholar]
- 21.Louie A, Brown DL, Liu W, Kulawy RW, Deziel MR, Drusano GL. 2007. In vitro infection model characterizing the effect of efflux pump inhibition on prevention of resistance to levofloxacin and ciprofloxacin in Streptococcus pneumoniae. Antimicrob Agents Chemother 51:3988–4000. doi: 10.1128/AAC.00391-07. [DOI] [PMC free article] [PubMed] [Google Scholar]
- 22.Bowker KE, Garvey MI, Noel AR, Tomaselli SG, MacGowan AP. 2013. Comparative antibacterial effects of moxifloxacin and levofloxacin on Streptococcus pneumoniae strains with defined mechanisms of resistance: impact of bacterial inoculum. J Antimicrob Chemother 68:1130–1138. doi: 10.1093/jac/dks537. [DOI] [PubMed] [Google Scholar]
- 23.Gumbo T, Louie A, Deziel MR, Parsons LM, Salfinger M, Drusano GL. 2004. Selection of a moxifloxacin dose that suppresses Mycobacterium tuberculosis resistance using an in vitro pharmacodynamic infection model and mathematical modeling. J Infect Dis 190:1642–1651. doi: 10.1086/424849. [DOI] [PubMed] [Google Scholar]
- 24.Louie A, Deziel MR, Liu W, Drusano GL. 2007. Impact of resistance selection and mutant growth fitness on the relative efficacies of streptomycin and levofloxacin for plague therapy. Antimicrob Agents Chemother 51:2661–2667. doi: 10.1128/AAC.00073-07. [DOI] [PMC free article] [PubMed] [Google Scholar]
- 25.Louie A, Heine HS, Heine HS, VanScoy B, Eichas A, Files K, Fikes S, Brown DL, Liu W, Kinzig-Schippers M, Sörgel F, Drusano GL. 2011. Use of an in vitro pharmacodynamic model to derive a moxifloxacin regimen that optimizes kill of Yersinia pestis and prevents emergence of resistance. Antimicrob Agents Chemother 55:822–830. doi: 10.1128/AAC.00818-10. [DOI] [PMC free article] [PubMed] [Google Scholar]
- 26.Louie A, Vanscoy B, Liu W, Kulawy R, Brown D, Heine HS, Drusano GL. 2011. Comparative efficacies of candidate antibiotics against Yersinia pestis in an in vitro pharmacodynamic model. Antimicrob Agents Chemother 55:2623–2628. doi: 10.1128/AAC.01374-10. [DOI] [PMC free article] [PubMed] [Google Scholar]
- 27.Deziel M, Heine H, Louie A, Kao M, Byrne WR, Bassett J, Miller L, Bush K, Kelley M, Drusano GL. 2005. Identification of effective antimicrobial regimens for use in humans for the therapy of Bacillus anthracis infections and post-exposure prophylaxis. Antimicrob Agents Chemother 49:5099–5106. doi: 10.1128/AAC.49.12.5099-5106.2005. [DOI] [PMC free article] [PubMed] [Google Scholar]
- 28.Louie A, Heine HS, Kim K, Brown DL, VanScoy B, Liu W, Kinzig-Schippers M, Sörgel F Drusano GL. 2008. Use of an in vitro model of Bacillus anthracis infection to derive a linezolid regimen that optimizes bacterial kill and prevents emergence of resistance. Antimicrob Agents Chemother 52:2486–2496. doi: 10.1128/AAC.01439-07. [DOI] [PMC free article] [PubMed] [Google Scholar]
- 29.Drusano GL, Okusanya OO, Okusanya AO, van Scoy B, Brown DL, Fregeau C, Kulawy R, Kinzig M, Sörgel F, Heine HS, Louie A. 2009. Impact of spore biology on the rate of kill and suppression of resistance in Bacillus anthracis. Antimicrob Agents Chemother 53:4718–4725. doi: 10.1128/AAC.00802-09. [DOI] [PMC free article] [PubMed] [Google Scholar]
- 30.Louie A, Bied A, Fregeau C, Van Scoy B, Brown D, Liu W, Bush K, Queenan AM, Morrow B, Khashab M, Kahn JB, Nicholson S, Kulawy R, Drusano GL. 2010. Impact of different carbapenems and regimens of administration on resistance emergence for three isogenic Pseudomonas aeruginosa strains with differing mechanisms of resistance. Antimicrob Agents Chemother 54:2638–2645. doi: 10.1128/AAC.01721-09. [DOI] [PMC free article] [PubMed] [Google Scholar]
- 31.Drusano GL, Lodise TP, Melnick D, Liu W, Oliver A, Mena A, VanScoy B, Louie A. 2011. Meropenem penetration into epithelial lining fluid in mice and men and delineation of exposure targets. Antimicrob Agents Chemother 55:3406–3412. doi: 10.1128/AAC.01559-10. [DOI] [PMC free article] [PubMed] [Google Scholar]
- 32.Felton T, Goodwin J, O'Connor L, Sharp A, Gregson L, Livermore J, Howard SJ, Neely MN, Hope WW. 2013. Impact of bolus dosing versus continuous infusion of piperacillin and tazobactam on the development of antimicrobial resistance in Pseudomonas aeruginosa. Antimicrob Agents Chemother 57:5811–5819. doi: 10.1128/AAC.00867-13. [DOI] [PMC free article] [PubMed] [Google Scholar]
- 33.Bowker KE, Noel AR, Tomaselli SG, Elliott H, MacGowan AP. 2012. Pharmacodynamics of the antibacterial effect and emergence of resistance to doripenem in Pseudomonas aeruginosa and Acinetobacter baumannii in an in vitro pharmacodynamic model. Antimicrob Agents Chemother 56:5009–5015. doi: 10.1128/AAC.06111-11. [DOI] [PMC free article] [PubMed] [Google Scholar]
- 34.MacGowan AP, Noel AR, Tomaselli S, Bowker KE. 2013. Pharmacodynamics of ceftaroline against Staphylococcus aureus studied in an in vitro pharmacokinetic model of infection. Antimicrob Agents Chemother 57:2451–2456. doi: 10.1128/AAC.01386-12. [DOI] [PMC free article] [PubMed] [Google Scholar]
- 35.MacGowan AP, Bowker KE, Noel AR. 2008. Pharmacodynamics of the antibacterial effect and emergence of resistance to tomopenem, formerly RO4908463/CS-023, in an in vitro pharmacokinetic model of Staphylococcus aureus infection. Antimicrob Agents Chemother 52:1401–1406. doi: 10.1128/AAC.01153-07. [DOI] [PMC free article] [PubMed] [Google Scholar]
- 36.MacGowan AP, Noel AR, Tomaselli S, Elliott HC, Bowker KE. 2011. Pharmacodynamics of razupenem studied in an in vitro pharmacokinetic model of infection. Antimicrob Agents Chemother 55:1436–1442. doi: 10.1128/AAC.00936-10. [DOI] [PMC free article] [PubMed] [Google Scholar]
- 37.Gumbo T, Louie A, Liu W, Ambrose PG, Bhavnani SM, Brown D, Drusano GL. 2007. Isoniazid's bactericidal activity ceases because of the emergence of resistance, not depletion of Mycobacterium tuberculosis in the log phase of growth. J Infect Dis 195:194–201. doi: 10.1086/510247. [DOI] [PubMed] [Google Scholar]
- 38.Gumbo T, Louie A, Brown D, Ambrose PG, Bhavnani SM, Drusano GL. 2007. Isoniazid bactericidal activity and resistance emergence: integrating pharmacodynamics and pharmacogenomics to predict efficacy in different ethnic populations. Antimicrob Agents Chemother 51:2329–2336. doi: 10.1128/AAC.00185-07. [DOI] [PMC free article] [PubMed] [Google Scholar]
- 39.Gumbo T, Louie A, Deziel MR, Liu W, Parsons LM, Salfinger M, Drusano GL. 2007. Concentration-dependent Mycobacterium tuberculosis killing and prevention of resistance by rifampin. Antimicrob Agents Chemother 51:3781–3788. doi: 10.1128/AAC.01533-06. [DOI] [PMC free article] [PubMed] [Google Scholar]
- 40.MacGowan AP, Noel AR, Tomaselli S, Elliott HC, Bowker KE. 2011. Pharmacodynamics of telavancin studied in an in vitro pharmacokinetic model of infection. Antimicrob Agents Chemother 55:867–873. doi: 10.1128/AAC.00933-10. [DOI] [PMC free article] [PubMed] [Google Scholar]
- 41.Bowker KE, Noel AR, MacGowan AP. 2009. Comparative antibacterial effects of daptomycin, vancomycin and teicoplanin studied in an in vitro pharmacokinetic model of infection. J Antimicrob Chemother 64:1044–1051. doi: 10.1093/jac/dkp289. [DOI] [PubMed] [Google Scholar]
- 42.Hansen GT, Metzler K, Drlica K, Blondeau JM. 2003. Mutant prevention concentration of gemifloxacin for clinical isolates of Streptococcus pneumoniae. Antimicrob Agents Chemother 47:440–441. doi: 10.1128/AAC.47.1.440-441.2003. [DOI] [PMC free article] [PubMed] [Google Scholar]
- 43.Drlica K, Malik M. 2003. Fluoroquinolones: action and resistance. Curr Top Med Chem 3:249–282. doi: 10.2174/1568026033452537. [DOI] [PubMed] [Google Scholar]
- 44.Blondeau JM, Zhao X, Hansen G, Drlica K. 2001. Mutant prevention concentrations of fluoroquinolones for clinical isolates of Streptococcus pneumoniae. Antimicrob Agents Chemother 45:433–438. doi: 10.1128/AAC.45.2.433-438.2001. [DOI] [PMC free article] [PubMed] [Google Scholar]
- 45.Firsov AA, Lubenko IY, Smirnova MV, Strukova EN, Zinner SH. 2008. Enrichment of fluoroquinolone-resistant Staphylococcus aureus: oscillating ciprofloxacin concentrations simulated at the upper and lower portions of the mutant selection window. Antimicrob Agents Chemother 52:1924–1928. doi: 10.1128/AAC.01371-07. [DOI] [PMC free article] [PubMed] [Google Scholar]
- 46.Croisier D, Etienne M, Bergoin E, Charles PE, Lequeu C, Piroth L, Portier H, Chavanet P. 2004. Mutant selection window in levofloxacin and moxifloxacin treatments of experimental pneumococcal pneumonia in a rabbit model of human therapy. Antimicrob Agents Chemother 48:1699–1707. doi: 10.1128/AAC.48.5.1699-1707.2004. [DOI] [PMC free article] [PubMed] [Google Scholar]
- 47.Drusano GL, Fregeau C, Liu W, Brown DL, Louie A. 2010. Impact of burden on granulocyte clearance of bacteria in a mouse thigh infection model. Antimicrob Agents Chemother 54:4368–4372. doi: 10.1128/AAC.00133-10. [DOI] [PMC free article] [PubMed] [Google Scholar]
- 48.Drusano GL, Vanscoy B, Liu W, Fikes S, Brown D, Louie A. 2011. Saturability of granulocyte kill of Pseudomonas aeruginosa in a murine model of pneumonia. Antimicrob Agents Chemother 55:2693–2695. doi: 10.1128/AAC.01687-10. [DOI] [PMC free article] [PubMed] [Google Scholar]
- 49.Drusano GL, Liu W, Fikes S, Cirz R, Robbins N, Kurhanewicz S, Rodriquez J, Brown D, Baluya D, Louie A. 2014. Interaction of drug- and granulocyte-mediated killing of Pseudomonas aeruginosa in a murine pneumonia model. J Infect Dis 210:1319–1324. doi: 10.1093/infdis/jiu237. [DOI] [PMC free article] [PubMed] [Google Scholar]
- 50.Chastre J, Wolff M, Fagon JY, Chevret S, Thomas F, Wermert D, Clementi E, Gonzalez J, Jusserand D, Asfar P, Perrin D, Fieux F, Aubas S, PneumA Trial Group . 2003. Comparison of 8 vs 15 days of therapy for patients with ventilator-associated pneumonia in adults: a randomized trial. JAMA 290:2588–2598. doi: 10.1001/jama.290.19.2588. [DOI] [PubMed] [Google Scholar]
- 51.Drusano GL. 2004. Antimicrobial pharmacodynamics: the interactions between bug and drug. Nat Rev Microbiol 2:289–300. doi: 10.1038/nrmicro862. [DOI] [PubMed] [Google Scholar]
- 52.Harshey RM, Ramakirishnan T. 1976. Purification and properties of DNA-dependent RNA polymerase from Mycobacterium tuberculosis H37RV. Biochim Biophys Acta 432:49–59. doi: 10.1016/0005-2787(76)90040-X. [DOI] [PubMed] [Google Scholar]
- 53.Wehrli W, Knüsel F, Schmid K, Staehelin M. 1968. Interaction of rifampin with bacterial RNA polymerase. Proc Natl Acad Sci U S A 61:667–673. doi: 10.1073/pnas.61.2.667. [DOI] [PMC free article] [PubMed] [Google Scholar]


