

Abstract
Replication-competent human immunodeficiency virus (HIV) persists in infected people despite suppressive combination antiretroviral therapy (cART), and it represents a major obstacle to HIV functional cure or eradication. We have developed a model of cART-mediated viral suppression in simian human immunodeficiency virus (SIV) mac239-infected Indian rhesus macaques and evaluated the impact of the histone deacetylase inhibitor (HDACi) romidepsin (RMD) on viremia in vivo. Eight macaques virologically suppressed to clinically relevant levels (<30 viral RNA copies/ml of plasma), using a three-class five-drug cART regimen, received multiple intravenous infusions of either RMD (n = 5) or saline (n = 3) starting 31 to 54 weeks after cART initiation. In vivo RMD treatment resulted in significant transient increases in acetylated histone levels in CD4+ T cells. RMD-treated animals demonstrated plasma viral load measurements for each 2-week treatment cycle that were significantly higher than those in saline control-treated animals during periods of treatment, suggestive of RMD-induced viral reactivation. However, plasma virus rebound was indistinguishable between RMD-treated and control-treated animals for a subset of animals released from cART. These findings suggest that HDACi drugs, such as RMD, can reactivate residual virus in the presence of suppressive antiviral therapy and may be a valuable component of a comprehensive HIV functional cure/eradication strategy.
INTRODUCTION
Although combination antiretroviral therapy (cART) can suppress viral replication in human immunodeficiency virus type 1 (HIV-1)-infected patients to levels below the limits of quantification for standard clinical assays, recrudescent virus emerges upon treatment interruption in virtually all patients who initiate therapy during the chronic phase of infection, even after many years of treatment and virologic suppression (1, 2). A long-lived residual virus pool persists despite apparently effective treatment (3–7). For this reason, current cART does not represent a definitive treatment for HIV infection, and lifelong treatment is required in the vast majority of infected patients. Despite the fact that cART can substantially improve the life expectancy of HIV-1-infected individuals, there are concerns about the development of viral drug resistance and drug-related toxicities in patients with such long-term treatment. In addition, the financial burden of lifelong cART is considerable (8), and recent studies have indicated that well-suppressed patients still have elevated levels of immune activation with increased non-AIDS morbidities and reduced life expectancies compared with those of uninfected people (9–21). These considerations have motivated a substantial scientific research effort to identify treatments that will result in either the eradication of residual virus or in the durable control of viral replication in the absence of cART.
A number of different potential in vivo sources of replication-competent virus that can reemerge upon treatment cessation have been proposed, but at least part of the residual virus pool that persists during suppressive cART is composed of latently infected resting CD4+ T cells, which harbor an integrated but transcriptionally silent viral genome that can later become activated and expressed (5–7). Because latently infected cells do not produce viral gene products, they are not targeted by immune surveillance, nor are they affected by currently available antiretroviral drugs, which can only prevent new rounds of de novo infection. Although other persistent viral reservoirs may also be important, it will be necessary to target latently infected CD4+ T cells to effect a functional cure of HIV-1 infection. Thus, a number of proposed strategies for HIV-1 eradication and/or functional cure involve the identification of adjunctive therapies that can induce the expression of latent viral genomes under the cover of suppressive cART, with the hope that induced cells will be eliminated either through viral lysis or immune-mediated clearance, or with the aid of a therapeutic vaccination or other treatment to target productively infected cells (reviewed in reference 22).
Several different features of the transcriptional environment of resting CD4+ cells may contribute to the transcriptional silencing of latent viral genomes (reviewed in references 23 and 24). In addition to low levels of critical host transcription factors, such as pTEFb (25, 26), the recruitment of histone deacetylases (HDACs) to the viral long terminal repeat (LTR) region and the associated deacetylation of histone tails and inaccessibility of the resulting tightly wrapped chromatin structures appear to represent a mechanism whereby viral genome expression is inhibited and a state of latency is maintained (27, 28). Indeed, histone deacetylase inhibitor (HDACi) compounds have been shown to induce viral transcription and the production of virus in cell line models of HIV-1 latency and in CD4+ T cells treated ex vivo from cART-suppressed patients (29–35). Moreover, although the relationships between dosing strategy, compound pharmacokinetics and pharmacodynamics, and the underlying biology of viral persistence are apparently complicated, in vivo evaluations of HDACi treatment in cART-suppressed HIV-1-infected individuals have suggested that HDACi compounds may be useful for perturbing viral latency in vivo (34, 36–38). The administration of HDACi compounds, such as Vorinostat (suberoylanilide hydroxamic acid [SAHA]) and romidepsin (RMD) lead to increases in cell-associated viral RNA levels in resting CD4+ T cells in a subset of treated patients (34, 37, 38), with RMD treatment reportedly leading to increases in plasma viremia as well (38).
Given uncertainties about the nature, magnitude, and cellular and anatomical distributions of residual virus, and concerns over the risks, tolerability, and effectiveness of proposed strategies to purge the residual virus pool in vivo, particularly in the context of safe and effective standard-of-care cART, relevant animal models of cART-mediated suppression will be critical. Although nonhuman primate (NHP) models of AIDS have proven valuable for examining numerous aspects of AIDS virus transmission, dissemination, pathogenesis, and antiviral immunity in vivo, their use in evaluating viral eradication/functional cure strategies has been limited in part by challenges with achieving clinically relevant levels of cART-mediated virologic suppression in SIV-infected macaques (reviewed in reference 39). Recently, we described the development of a model of cART-mediated suppression in Indian-origin rhesus macaques, in which the suppression of SIVmac239 replication to clinically relevant levels (<30 viral RNA copies/ml of plasma) was achievable with a six-drug cART regimen initiated during the early chronic phase of infection (40). We then utilized this model to evaluate the impact of multiple doses of oral SAHA on the residual virus pool. We noted significant changes in histone acetylation levels and significant increases in the ratio of peripheral blood mononuclear cell (PBMC)-associated viral RNA to viral DNA in SAHA-treated animals; we also noted evidence of sustained modulation of acetylated histone levels and refractoriness following sustained SAHA administration. However, the relationships between dosing, pharmacokinetics, peak pharmacodynamic activity, and virologic changes were complex, not unlike the findings in SAHA-treated HIV-1-infected people (40). Importantly, residual viral RNA and inducible viral genomes persisted in treated animals despite each animal receiving 84 cumulative SAHA doses, and there were no apparent changes in plasma viral load associated with SAHA treatment in humans or in macaques, suggesting that a more potent HDACi may be required to have a more meaningful impact on the residual virus pool (40).
Here, we describe the development of an improved model of cART-mediated suppression in which clinically relevant levels of virologic suppression were achieved in SIVmac239-infected Indian-origin rhesus macaques using fewer antiretroviral drugs with more convenient and consistent administration. Using this improved model, we evaluated the ability of RMD to induce virus in vivo. We show that multiple doses of RMD administered via intravenous infusion results in significantly elevated plasma viral loads (pVLs) in cART-suppressed macaques compared with suppressed animals given saline control infusions.
MATERIALS AND METHODS
Animals, virus inoculations, and drug treatments.
Eight sexually mature rhesus macaques (Macaca mulatta) of Indian origin weighing between 4 and 7.5 kg were housed at the National Institutes of Health (NIH) and cared for in accordance with the Association for the Assessment and Accreditation of Laboratory Animal Care (AAALAC) standards in an AAALAC-accredited facility. At the start of the study, all animals were free of cercopithecine herpesvirus 1, simian immunodeficiency virus (SIV), simian type-D retrovirus, and simian T-lymphotropic virus type 1. Animals were intravenously (i.v.) inoculated via the saphenous vein with SIVmac239 generated in transfected 293T cells (0.4 ng of p27 per animal; 4/6/07 stock, kindly provided by Ronald Desrosiers). Beginning at 4 weeks post-SIV inoculation, each animal received a combination antiretroviral therapy (cART) regimen comprising a coformulated three-drug cocktail (41) containing the reverse transcriptase inhibitors tenofovir (TFV, aka PMPA; 20 mg/kg of body weight), emtricitabine (FTC; 50 mg/kg), and the integrase strand transfer inhibitor dolutegravir (DTG; 2.5 mg/kg) administered by once-daily subcutaneous injection, plus the protease inhibitors darunavir (DRV; 600 mg) and ritonavir (RTV; 100 mg), each given via the oral route twice daily. RTV treatment was discontinued starting at 44, 49, and 16 weeks post-cART initiation for cohorts 1, 2, and 3, respectively. DRV treatment for cohort 2 and 3 animals was temporarily switched from oral administration to administration via once-daily subcutaneous injection for 1 to 3 weeks starting 73 and 39 weeks post-cART administration and then back to twice daily oral DRV by 76 and 42 weeks post-cART initiation for cohorts 2 and 3, respectively.
Romidepsin administration.
Human pharmaceutical-grade romidepsin (Istodax; Celgene) kits, with 10 mg/vial, were obtained from a pharmacy. Each romidepsin (RMD) and saline control infusion was administered intravenously over 4 h at a rate of 15 ml of fluid infused per h using an intravenous infusion pump in conscious restraint chair-trained animals on cART. Immediately prior to each administration, lyophilized RMD was reconstituted to 5 mg/ml in 80% propylene glycol–20% dehydrated alcohol, according to the manufacturer's instructions, and then further diluted in 0.9% injectable NaCl so that the total desired dose (2.5 mg/m2 or 3.75 mg/m2) could be administered in a 60-ml total volume. For saline control infusions, 60 ml of 0.9% injectable NaCl was infused. The animals were provided fruit and other food treats and visual enrichment during infusions. All RMD-treated animals (DCCN, DCT2, DCEG, DCW9, and GRH) received 2 to 4 saline control administrations, while saline control-treated animals (DCHV, DCJB, and G35) received only saline infusions on the same infusion schedule as RMD-treated animals from the same cohort. The timing and doses of RMD in the three animal cohorts are detailed in Fig. 1. To determine if a longer duration on suppressive cART impacted virologic responsiveness to RMD, cohorts 1 and 2 were maintained on cART for 31 to 36 weeks prior to their first infusion, while the cohort 3 animals received their first infusion >1 year after the initiation of cART. The duration of the off-RMD rest phase between infusions 6 and 7 was prolonged for cohort 2 compared with cohort 1 to examine a potential role for sustained modulation of acetylated histone levels or virologic parameters, as we previously observed following treatment with HDACi SAHA treatment (40). Because the RMD-treated animal in cohort 3 experienced more frequent gastrointestinal side effects than the animals in cohorts 1 and 2, the dosing scheme during the on-RMD phase for this group contained additional saline control infusions, an additional infusion at the lower dose of 2.5 mg/m2, and fewer infusions at the higher dose of 3.75 mg/m2.
FIG 1.

Study schema with the duration of each study phase indicated for each of the three study cohorts. Red macaque silhouettes represent RMD-treated animals; blue silhouettes represent saline control-treated animals. Gray regions of the diagram represent study phases in which animals were treated with combination antiretroviral therapy (cART). Infusions are represented by enumerated arrows. Blue arrows represent infusions of saline into all cohort animals. Red and dark red arrows represent infusions of RMD at 2.5 mg/m2 and 3.75 mg/m2, respectively, into RMD-treated animals and saline infusions into saline control-treated animals.
Sample collection and preparation.
Whole blood was collected from animals sedated with ketamine or via intravenous catheters in conscious animals in restraint chairs. For each RMD/saline infusion, blood was collected just prior to infusion, at the end of infusion (4 h postinfusion initiation), 7 days postinfusion, and 14 days postinfusion. For surgical lymph node extraction, animals were sedated with ketamine and isoflurane inhalation anesthesia. Plasma for viral RNA quantification and RMD concentration determination and PBMCs for flow cytometry assays were prepared from blood collected in EDTA Vacutainer tubes (BD). During the RMD treatment portion of the study, whole blood collected in EDTA Vacutainer tubes was immediately placed on ice and maintained at 4°C throughout processing to minimize any changes in histone acetylation during blood transport and PBMC isolation. Following separation from whole blood by centrifugation, plasma aliquots were stored at −80°C. PBMCs were isolated from whole blood by Ficoll-Paque Plus (GE Healthcare) gradient centrifugation. Lymph node mononuclear cells (LNMC) for flow-cytometric assays and ex vivo RMD treatment experiments were prepared by mincing tissues in RPMI supplemented with 10% fetal bovine serum (FBS) and then passing the cell/medium suspension through a 70-μm-pore-size cell strainer (BD). Freshly isolated PBMCs and LNMC were utilized for all flow cytometry-based assays, and portions of isolated PBMCs and LNMC were viably cryopreserved.
Plasma viral load determination.
Plasma SIV RNA viral load determinations were performed, essentially as described previously (40), with the following modifications. For plasma viral load determinations with a lower quantification limit of 10 viral RNA copy equivalents/ml, virion material from two plasma aliquots was combined prior to further processing and analysis. Two previously frozen 750-μl aliquots of plasma were each thawed and diluted with 250 μl of Tris-buffered saline prior to concentrating virions by centrifugation at 21,000 × g and 4°C for 1 h. After removing supernatant from one virion pellet by careful repeat pipetting, 50 μl of lysis/digestion solution (3 M guanidium chloride [GuHCl], 50 mM Tris-HCl [pH 7.6], 1 mM CaCl2, and 1 mg/ml proteinase K) was added to this first pellet, which was then incubated for 15 min at 42°C with periodic vortexing. Following this incubation, supernatant was carefully removed from the second virion pellet, and the lysed virion material plus lysis/digestion solution from the first pellet was added to the second virion pellet. The combined virion material and lysis digestion solution was then incubated for 1 h at 42°C and processed and analyzed, as described previously (40). For control quantitative reverse transcriptase PCRs (qRT-PCRs) run in the absence of reverse transcriptase (i.e., no-RT controls), virions were pelleted, lysed, and combined, as described above, from one to four previously frozen aliquots of plasma from a subset of time points from RMD-treated animals. Nucleic acid extraction was then performed, as described previously (40), with the final nucleic acid sample dissolved in 50 μl of 10 mM Tris-HCl (pH 8.0), with 20 μl split into duplicate qRT-PCR wells, performed as described previously (40), and 20 μl split into duplicate qRT-PCR wells, performed as described previously (40), but without reverse transcriptase enzyme added.
Plasma RMD concentration determinations.
Plasma aliquots of 50 μl were processed by first treating with 200 μl of acetonitrile (ACN) containing an internal standard. After protein precipitation, 75 μl of the resulting supernatant was transferred to a fresh 96-well plate and mixed with 75 μl of water. Known concentrations of RMD were spiked into healthy rhesus macaque plasma to construct a standard recovery curve. An aliquot of 20 μl of this solution was injected onto a HyPurity C18 high-performance liquid chromatography (HPLC) column (30 by 2.1 mm, 5 μm, Thermo Hypersil; Thermo Scientific, San Jose, CA) connected to a TSQ Quantum Ultra LC-MS/MS system. A gradient of ACN was applied to the column using a Cohesive LX-2 multiplex system with two identical Agilent 1100 series binary pumps (P/N G1312A bin pump), according to the following parameters, with a flow rate of 0.5 ml/min used for all steps: sample loading, 90 s/100% mobile phase A/0% mobile phase B; ramp, 150 s/50% mobile phase A/50% mobile phase B; elution, 180 s/0% mobile phase A/100% mobile phase B; and reequilibrium, 120 s/100% mobile phase A/0% mobile phase B. Mobile phase A contained 1% acetonitrile in 10 mM ammonium formate aqueous solution with 1% formic acid. Mobile phase B contained 80% acetonitrile in 10 mM ammonium formate with 1% formic acid. Elution samples were collected using a high-throughput sequencing (HTS) Pal autosampler (Leap Technologies). The HPLC elution samples were analyzed by mass spectrometry on a TSQ Quantum Ultra triple quadrupole mass spectrometer (Thermo Finnigan). The lower limit of quantification for RMD under this HPLC-MS methodology was 1 nM.
Ex vivo viral RNA induction analysis.
Viably cryopreserved LNMC from cohort 1 and 2 animals DCCN, DCT3, DCHV, DCEG, and DCJB (DCW9 was not used due to insufficient LNMC yields) collected 30 to 35 weeks after cART initiation were thawed, and CD4+ T cells were enriched by negative selection using the CD4+ T cell isolation kit, NHP (Miltenyi Biotec). Enriched CD4+ T cells were then cultured in the presence of 1 μM FTC and 100 nM DTG and treated with either dimethyl sulfoxide (DMSO) (vehicle control), 5 nM RMD, or 40 nM RMD at 4 × 10⁶ to 5 × 10⁶ cells per condition for 6 days. One-third of the culture medium volume was removed on day 3 and replaced with fresh medium containing FTC and DTG. The viral RNA content of frozen cell-free culture supernatants collected at days 3 and 6 were determined by first isolating RNA, as described above, for plasma viral load determinations. Total RNA was then suspended in 90 μl of 5 mM Tris-HCl (pH 8.0). SIV RNA copy numbers were determined in a 12-replicate test format, in 384-well plates, in which the lower limit of detection was based on the positive amplification of sample in 1 out of 12 replicates. cDNA was first prepared in a total of 15 μl per reaction mixture and comprised 5 μl of sample and 10 μl of a reverse transcriptase cocktail at the final concentrations described above but containing 20 U of SuperScript II reverse transcriptase (Thermo Fisher/Invitrogen) per reaction mixture. These reaction mixtures were then supplemented with 10 μl of real-time PCR cocktail containing primers, probe, and Taq polymerase at final concentrations as described above for plasma viral load determinations, without the additional preamplification or “nested” protocol. Real-time PCR and assimilation of data were performed on 384-well instrumentation, the ViiA7 or QuantStudio 12K Flex, from Thermo Fisher/Applied Biosystems.
Flow cytometry.
Antibodies and reagents were obtained from BD Biosciences, unless indicated otherwise, and data analysis was performed using FCS Express (De Novo Software). Absolute cell counting was performed on EDTA-anticoagulated whole blood, as previously described (42, 43), using the following immunophenotyping panel: CD45 fluorescein isothiocyanate (FITC) (DO58-1283), CD3 phycoerythrin (PE) (SP34-2), CD4 allophycocyanin (APC) (L200), CD14 APC-Cy7 (M5E2; BioLegend), CD8α PE-Cy7 (SK1), and CD20 Pacific Blue (2H7; BioLegend). The samples were lysed, and approximately 50,000 CD45+ CD3+ cells were acquired for each sample to calculate cell counts, using a BD FACSVerse flow cytometer equipped with a volumetric flow sensor.
Acetylated histone assay.
Acetylated histone levels in PBMCs and/or LNMC following ex vivo and in vivo RMD treatment were determined using a flow-cytometric assay, as previously described (40).
Statistical analyses.
The data in this study were analyzed with longitudinal repeated-measures analysis of variance and linear hierarchical mixed-effects models (44), standard analysis of variance (ANOVA), and regression analysis. Repeated-measures analyses (in which “repeated” measurements are recorded for the same animal on more than one occasion) and mixed-effects models take into consideration the correlation/covariation of responses within the same animal over time. Ac-H3/H4 mean fluorescence intensity (MFI) and vRNA data for five RMD-treated and three control macaques were recorded for various numbers of occasions within four treatment phases. The (total) sums of squares of the factors in the experimental setup: animals, occasions, phases, occasions within phases, and animals crossed with occasions nested within phases, were partitioned into orthogonal components. The expected values of the mean squares were computed, and the correct variance ratios were calculated to test questions of interest, in particular, for differences among phases across time (45). Probability values of <0.05 were considered significant. P values between 0.05 and 0.09 were considered marginally significant.
Study approval.
All study animals were treated according to a protocol approved by the Institutional Animal Care and Use Committee (IACUC) of the National Cancer Institute under the standards of the NIH Guide for the care and use of laboratory animals (63).
RESULTS
cART-mediated suppression of in vivo SIV replication.
To develop an improved NHP model of cART-mediated suppression in the context of highly pathogenic SIV infection, we first intravenously inoculated eight Indian-origin rhesus macaques with SIVmac239 (Fig. 1). The eight study animals were grouped into three study cohorts, with cohorts 1, 2, and 3 composed of 3, 3, and 2 animals, respectively. All eight animals had acute plasma viremia profiles typical of SIVmac239 infection, with peak pVLs between 7.5 × 10⁶ and 1.1 × 10⁸ viral RNA (vRNA) copies/ml by 2 to 3 weeks postinfection (Fig. 2). At 4 weeks postinfection, all eight animals were placed on a five-drug cART regimen comprising a triple-coformulated once-daily subcutaneous injectable containing two reverse transcriptase inhibitors (emtricitabine [FTC] and tenofovir [TFV]) and one integrase strand transfer inhibitor (dolutegravir [DTG]) (41), plus an orally administered protease inhibitor (darunavir [DRV] boosted with ritonavir [RTV]) given twice daily. RTV was withdrawn from the regimen beginning at weeks 44, 49, and 16 post-cART initiation for cohorts 1, 2, and 3, respectively (Fig. 1), with no measurable impact on DRV pharmacokinetic plasma trough concentrations (not shown). The cART regimen was well tolerated, with all animals receiving cART for 56 to 91 weeks in total, including 33 to 56 weeks of cART prior to the first RMD infusions (Fig. 1). The pretreatment pVLs ranged from 2.3 × 10⁴ to 1.1 × 10⁷ vRNA copies/ml and declined by 1.5 to 4 logs within the first 2 weeks of treatment across all three cohorts (Fig. 2). Thereafter, the declines in pVL were more gradual, with pVLs below the assay quantification limit of 30 vRNA copies/ml measured at one or more time points for all animals within 20 weeks on cART and viral loads suppressed below 30 vRNA copies/ml plasma, with occasional vRNA detected between 30 and 100 vRNA copies/ml by 22 to 26 weeks on cART. Within ∼6 months after the initiation of cART, pVLs declined overall by 2.9 to 5.6 logs for animals in all three cohorts.
FIG 2.
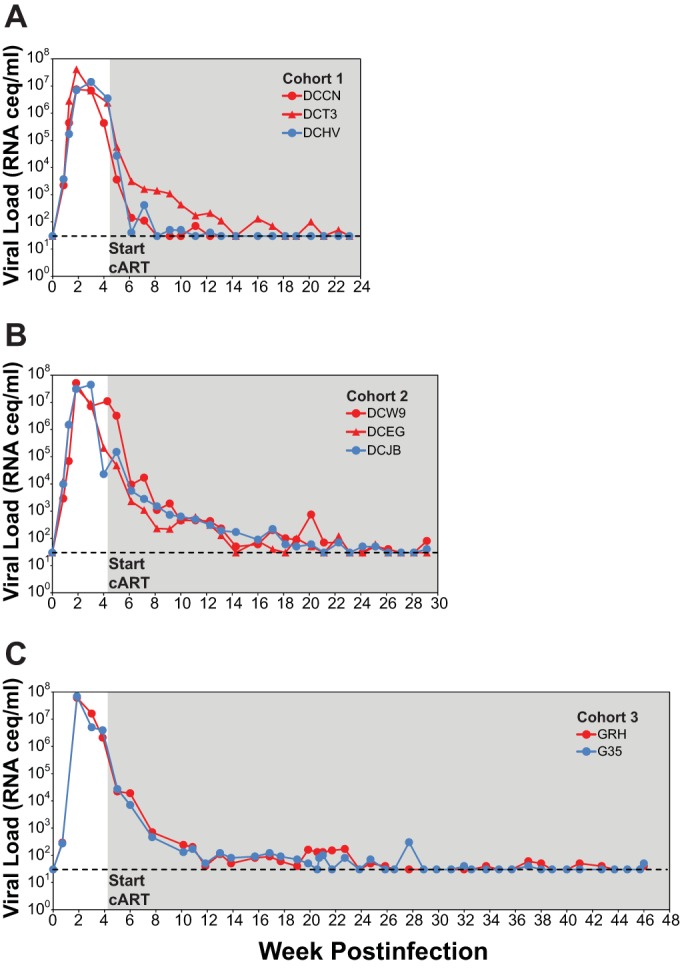
Plasma viral loads in cART-suppressed macaques prior to RMD administration. Longitudinal plasma viral loads for RMD treatment (red symbols) and saline treatment (blue symbols) animals for cohort 1 (A), cohort 2 (B), and cohort 3 (C) animals are shown. All three study cohorts initiated cART at 4 weeks postinfection (gray-shaded region). The dashed lines represent the assay quantification limit of 30 vRNA copies/ml of plasma.
Ex vivo RMD activity.
HDACi treatment, including the use of RMD, has been shown to induce increases in virus transcription and virus production in several in vitro models of latent HIV-1 infection and in ex vivo-treated CD4+ T cells from cART-suppressed HIV-1-infected patients (29–35). We have previously shown that the ex vivo treatment of CD4+ T cells in cART-suppressed macaques with the HDACi SAHA leads to increases in acetylated histone levels and virus release into cell culture supernatants (40). We therefore sought to confirm similar ex vivo pharmacodynamic and viral induction activities for RMD in primary SIV-infected rhesus cells obtained from our cART-suppressed animals prior to administration of the compound in vivo. As shown in Fig. 3A, dose-dependent increases in acetylated histone (H3 and H4) levels were detected by flow cytometry in blood-derived CD4+ T cells within 24 h of ex vivo treatment with 5 nM or 40 nM RMD. Compared with DMSO vehicle control treatment, 5 nM and 40 nM RMD also induced measurable increases in SIV production from lymph node-derived CD4+ T cells obtained from five of the cART-suppressed animals (Fig. 3B). Viral RNA, which could be pelleted by centrifugation from culture supernatants, suggesting that the vRNA was virion associated, was significantly elevated over DMSO-treated cell cultures at 3 days posttreatment for cells treated with 5 nM RMD (P = 0.032) or 40 nM RMD (P = 0.003), and at 6 days posttreatment for cells treated with 40 nM RMD (P = 0.046). Increased supernatant vRNA levels measured for 5 nM RMD over DMSO at day 6 were marginally significant (P = 0.058). Taken together, these findings indicate that RMD treatment increases acetylated histone levels in rhesus macaque CD4+ T cells and has the capacity to increase SIV production from SIV-infected macaque cells.
FIG 3.

Ex vivo treatment of CD4+ T cells from cART-suppressed study animals with romidepsin. (A) Changes in acetylated histone H3 and H4 levels in CD4+ T cells from three study animals measured by flow cytometry 24 h after ex vivo treatment with DMSO or the indicated concentrations of RMD. (B) Quantification by qRT-PCR of virion-associated vRNA in culture supernatants of CD4+ T cells from 5 cART-suppressed study animals at the indicated time points posttreatment with DMSO or the indicated concentrations of RMD. P values for statistical comparisons between vehicle control (DMSO) treatment or the indicated concentrations of RMD are shown.
RMD infusions, pharmacokinetic plasma measurements, complete blood counts, and tolerability.
All animals were maintained on cART throughout the RMD treatment phase of the study. Prior to receiving intravenous infusions of the test agents, all eight animals were first conditioned to the use of restraint chairs for intervals of ≥4 h. Romidepsin or saline control infusions were administered over 4 h in conscious animals in restraint chairs. The dose selections for RMD were based on a previous published study testing a 10-mg/m2 dose administered by intravenous (i.v.) infusion over a 4-h period in healthy rhesus macaques, with observed clinical changes that included anorexia, fatigue, elevation of creatine phosphokinase, and transient leukopenia (46). We further conducted single-i.v.-infusion pharmacokinetic studies at 1 and 5 mg/m2 (data not shown) in healthy animals to determine peak plasma levels, and we compared these levels (on a protein-binding-adjusted basis) to those concentrations necessary to achieve viral RNA expression in vitro from human immune cell cultures derived from HIV-1-positive patients on cART (35). In addition to one or two RMD-treated animals, each of the three study cohorts also included one saline control-treated animal that received saline control infusions only on the same schedule as saline/RMD infusions for the RMD-treated animals of the same cohort.
To examine the impact of the infusion procedure on virologic parameters across all animals, all animals first received a saline control infusion (infusion 1) 31, 36, and 54 weeks after cART initiation for cohorts 1, 2, and 3, respectively. Two weeks after this initial saline infusion, all RMD-treated animals received their first RMD infusion at a dose of 2.5 mg/m2 (infusion 2). RMD-treated animals in cohorts 1 and 2 continued to receive RMD infusions at 2-weeks intervals, with two more at the 2.5 mg/m2 dose (infusions 3 and 4), followed by two at a 50% higher dose of 3.75 mg/m2 (infusions 5 and 6) before an off-RMD rest phase of 8 weeks (cohort 1) or 44 weeks (cohort 2). Following this off-RMD rest phase, all cohort 1 and 2 animals again received a saline control infusion (infusion 7) and then were administered two RMD treatments at 3.75 mg/m2 (infusions 8 and 9) at 2-week intervals. Three to 4 weeks after infusion 9, the cohort 1 animals received one additional RMD infusion at 3.75 mg/m2 (infusion 10), and each animal was then euthanized with tissue collection at 48 h postdose. After their first RMD infusion at 2.5 mg/m2 (infusion 2), cohort 3 animals received another RMD administration at 2.5 mg/m2 (infusion 3), two saline control infusions (infusions 4 and 5), two more RMD infusions at 2.5 mg/m2 (infusions 6 and 7), one final saline control infusion (infusion 8), and then two more infusions at the higher dose of 3.75 mg/m2 (infusions 9 and 10), all at 2-week intervals.
We measured peak plasma RMD drug concentrations immediately following several drug infusions (i.e., at the end of the 4-h infusion period). At the 2.5-mg/m2 dose, peak plasma RMD concentrations ranged from 5.0 to 49.5 nM across animals (mean, 21.1 nM), with up to10-fold variation noted between animals but ≤3-fold variability between doses within a given animal (Fig. 4A). At the 3.75-mg/m2 dose peak, plasma RMD concentrations ranged from 11.6 to 46.3 nM across all animals (mean, 26.9 nM), with up to 4-fold variation between animals and ≤3-fold variability within animals. These results are not surprising given the differences between dose levels of only 50%, coupled with the finding that at a fixed dose of 14 mg/m2 in T cell lymphoma patients (n = 98), there was an ∼3-fold variability in RMD plasma levels at the end the 4-h infusion (47). Plasma RMD levels were generally higher in all animals, except for animal DCCN, following RMD administration at 3.75 mg/m2 (mean, 26.9 nM), compared with RMD levels after administration at 2.5 mg/m2 (mean, 21.1 nM). Peak plasma concentrations at 3.75 mg/m2 were on average dose proportionally higher than 2.5 mg/m2 across all animals (i.e., a 1.5-fold increase in drug exposure was expected and observed). Plasma RMD levels were not detected (lower limit of quantification, 1 nM) following saline infusions in control animals (Fig. 4A).
FIG 4.

Plasma RMD concentrations (A) and changes in leukocyte counts (B) following in vivo RMD administration. (A) Plasma RMD concentrations were measured at 4 h postinfusion initiation for the indicated infusions of RMD at 2.5 mg/m2 (red bars), 3.75 mg/m2 (dark red bars), or saline (blue bars). The dashed line represents the assay quantification limit of 1 nm. (B) CD45+ leukocyte counts in whole blood for all study animals immediately prior to and at 4 h and 7 days postinfusion initiation for all study infusions. Blue plot symbols represent saline control infusions for both saline-treated animals and RMD-treated animals, while red and dark red plot symbols represent RMD infusions at 2.5 mg/m2 and 3.75 mg/m2, respectively.
Common side effects in RMD-treated humans include gastrointestinal side effects, such as nausea, emesis, and loss of appetite, as well as leukopenia (48). Mild-to-moderate gastrointestinal side effects, including emesis and diminished appetite, were occasionally observed in our study macaques following RMD treatment but not following saline control infusions. These side effects, which were not consistently noted for any individual animal or administration cycle, typically resolved within 48 to 72 h of RMD administration. Leukopenia, measured as a decline in the absolute count of CD45+ cells in whole blood, was also noted but with greater consistency following all RMD infusions, but not after saline infusions (Fig. 4B). Compared with whole-blood counts recorded immediately prior to each RMD infusion, CD45+ cell numbers were 11 to 90% lower (mean, 60% lower) at 48 h postinfusion. This decline was similar following infusions at 2.5 mg/m2 (mean, 51%; range, 11 to 78% lower) or at 3.75 mg/m2 (mean, 68%; range, 25 to 90% lower). By 7 days postinfusion, CD45+ leukocyte numbers typically normalized to preinfusion levels (mean, 1% higher), although there was variability in the relative CD45+ leukocyte counts (range, 38% lower to 152% higher than pretreatment). In contrast, changes in CD45+ cell counts following saline infusion were variable and included increases and decreases relative to preinfusion values at both 48 h (range, 66% lower to 99% higher) and 7 days postinfusion (range, 49% lower to 59% higher). However, on average, CD45+ cell counts changed only slightly following saline infusion (mean at 48 h, 9% lower; mean at 7 days, 16% lower).
Histone acetylation changes in vivo.
To confirm that the doses of RMD administered to our cART-suppressed animals modulated histone acetylation in potential SIV target cells in vivo, we longitudinally monitored acetylated histone (H3 and H4) levels in CD4+ T cells by flow cytometry in all 3 study cohorts starting 10 weeks prior to the first saline control infusion (infusion 1). As shown in Fig. 5, acetylated histone levels rapidly increased after each RMD infusion but not after saline infusions administered either to RMD-treated animals or to saline control-treated animals. Acetylated histone levels for RMD-treated animals were compared with those of saline control-treated animals just prior to infusion (i.e., pretreatment) and at 4 h, 48 h, and 7 days postinfusion initiation across all RMD treatment cycles for all study animals. While acetylated histone levels measured at pretreatment time points were not significantly different for RMD-treated animals compared with those of the saline control-treated animals (P = 0.11), the Ac-H3/H4 MFI levels were significantly elevated in the RMD-treated animals at 4 h postinfusion initiation (P = 0.0004) and remained significantly elevated in RMD-treated animals over saline control-treated animals at 48 h (P = 0.0073) and at 7 days (P = 0.029) postinfusion. The highest Ac-H3/H4 levels were measured at 4-h post-RMD infusion initiation (mean Ac-H3/H4 MFI, 960 for RMD versus 223 for saline), with acetylated histone levels progressively declining by 48 h (mean Ac-H3/H4 MFI, 733 for RMD versus 213 for saline) and 7 days (mean Ac-H3/H4 MFI, 364 for RMD versus 188 for saline) before returning essentially to baseline levels by 14 days post-RMD treatment, which often coincided with the pretreatment time point for the subsequent RMD dose (mean Ac-H3/H4 MFI, 247 for RMD versus 188 for saline). Acetylated histone profiles for naive (CD95−/CD28+), central memory (CD95+/CD28+), and effector memory (CD95+/CD28−) CD4+ T-cell subsets were virtually indistinguishable (not shown), consistent with the untargeted nature of RMD treatment.
FIG 5.

Acetylated histone levels in RMD- and saline-treated animals. Longitudinal measures of acetylated histone H3 and H3 (Ac-H3/H4) by flow cytometry in CD4+ T cells are shown for cohort 1 (A), cohort 2 (B), and cohort 3 (C) animals. Red plot symbols and traces represent RMD-treated animals and blue plot symbols and traces represent saline control-treated animals. Infusions for each animal are indicated by colored triangles beneath plots. P values shown are for comparisons of Ac-H3/H4 levels between RMD-treated and saline control-treated animals across the study for various postinfusion time points (see Materials and Methods).
Plasma viral load changes in vivo.
Having established that in vivo RMD treatments resulted in pharmacodynamically active drug exposures, based on rapid transient increases in acetylated histone levels in CD4+ T cells, we next evaluated whether RMD treatment resulted in increases in plasma viremia, indicative of increased virus production from infected cells. Beginning 10 weeks prior to the first saline control infusion, we measured pVLs using a qRT-PCR assay with a sensitivity cutoff between 10 and 30 vRNA copies/ml, depending upon the volume of plasma available to assay. As shown in Fig. 6, pVLs appeared elevated in RMD-treated animals compared with those of saline control-treated animals during and shortly after periods of RMD treatment but not during pre-RMD and off-RMD rest phases. To formally test this, we statistically compared the highest plasma viral load measurement (i.e., “blip”) recorded for each infusion cycle for RMD-treated versus saline control-treated animals. Because RMD infusions were administered once every 2 weeks, we similarly compared the highest pVL measurement for each 2-week interval during off-treatment phases for RMD-treated versus saline control-treated animals. For animal cohorts 1 and 2, the longitudinal pVL data were divided into four study phases: (i) pre-RMD, (ii) on-RMD 1, (iii) off-RMD rest, and (iv) on-RMD 2. The animals in cohort 3 did not have a prolonged off-RMD/no-infusion rest phase, and we therefore we considered these two animals to have only two treatment phases: (i) pretreatment and (ii) on-RMD 1. One RMD-treated animal in cohort 1, DCT3, demonstrated a high plasma viremia blip following the first saline control infusion (Fig. 6A). Despite this fact, there was no significant difference in the maximum biweekly pVL measurements between the RMD-treated and saline control-treated animals across all three cohorts during the pre-RMD phase of the study (Fig. 6; P = 0.094). In contrast, during the on-RMD 1 treatment phase, maximum pVL blips for RMD-treated animals were significantly higher than those measured for the saline control-infused animals (P < 0.001) for all three study cohorts (Fig. 6). For cohorts 1 and 2, during the off-RMD rest phase, the maximum biweekly plasma viral loads for RMD-treated animals were, again, not significantly different from those of the saline control-treated animals (Fig. 6A and B; P = 0.66) but were again significantly elevated over those of the saline control-treated animals during the subsequent on-RMD 2 study phase (Fig. 6A and B; P = 0.014).
FIG 6.

Plasma viral loads in cART-suppressed macaques during RMD treatment phase of the study. Longitudinal plasma viral loads for RMD-treated (red symbols and traces) and saline-treated (blue symbols and traces) animals in cohort 1 (A), cohort 2 (B), and cohort 3 (C) are shown. Viral loads below the limit of quantification are plotted as the assay quantification limit for that time point (10 to 30 vRNA copies/ml, dependent upon available plasma volumes). The infusions for each animal are indicated by colored triangles beneath the plots. The asterisks denote study phases in which biweekly maximum pVL measurements were significantly higher in RMD-treated versus saline control-treated animals (see Materials and Methods).
To evaluate the potential contributions of contaminating viral DNA to plasma viral load measurements, a subset of 20 plasma samples collected during periods of RMD treatment were selected for control qRT-PCRs run in the absence of reverse transcriptase enzyme (i.e., no RT controls). The samples selected for this analysis were those that contained elevated plasma viral load measurements (40 to 2,600 vRNA copies/ml) and for which sufficient residual plasma volume was available. Viral DNA was not detected in any of 20 analyzed samples, while the presence of vRNA was confirmed in all 20 samples (data not shown).
cART release.
Treatment with antiretroviral drugs was discontinued in cohort 2 and 3 animals at 2 and 6 weeks after the final infusion, respectively, with plasma viral load monitoring for the subsequent 17 to 18 weeks. Quantifiable plasma viremia was detected in all three RMD-treated and both saline control-treated animals at the first time point sampled 1 week following cART withdrawal (Fig. 7). Plasma viral loads continued to increase in all five animals during the first 2 to 3 weeks following cART discontinuation before establishing set point viral loads between ∼104 and 106 vRNA copies/ml in four of five animals (three RMD treated and one saline control). The fifth animal (DCJB), the saline control-treated animal from cohort 2, controlled viral replication to levels to <103 vRNA copies/ml.
FIG 7.

Plasma viral loads following cART release. Longitudinal plasma viral loads for RMD-treated (red symbols) and saline-treated (blue symbols) animals in cohort 2 (A) and cohort 3 (B).
DISCUSSION
Much of the field of HIV cure research is focused on identifying adjunctive treatments that can reactivate virus expression in latently infected cells in the setting of suppressive cART that can prevent the reactivated virus from spreading into new target cells. Thus, for the application of NHP models of AIDS to evaluate HIV functional cure and eradication strategies, it is critical to identify and develop cART regimens that can durably suppress SIV replication in macaques to clinically relevant levels (i.e., <the 50-vRNA copy/ml of plasma quantification cutoff used in standard human clinical assays). We previously reported on the development of a three-class six-drug cART regimen that suppressed SIVmac239 replication in Indian-origin rhesus macaques to <30 vRNA copies/ml of plasma in five of six treated animals when therapy was initiated in the early chronic phase of infection (40). This regimen comprised two nucleos(t)ide reverse transcriptase inhibitors (NRTIs) (FTC and TFV) coformulated and administered once daily via the subcutaneous route, and four drugs (integrase strand transfer inhibitors [INSTIs], L-′564 and L-′812; boosted protease inhibitor [PI], DRV/RTV), each given via the oral route twice daily. In the current study, we sought to improve upon this regimen by identifying a cART regimen containing fewer total drugs, with more of the drugs administered via a more controllable and consistent route than oral administration. Recent advances in the development of cART regimens for use in NHP-AIDS models have included the coformulation of >2 drugs for once-daily subcutaneous coadministration and the use of component drugs with superior antiviral activity, such as the INSTI dolutegravir (DTG) (41, 49). We therefore initiated a three-class cART regimen containing five component drugs, three of which (FTC, TFV, and DTG) were coformulated for once-daily coadministration via the subcutaneous route, in eight Indian-origin rhesus macaques starting at 4 weeks postinfection with SIVmac239. The remaining two regimen drugs, DRV and RTV, were given orally twice per day, but RTV was later withdrawn from the regimen, as it had no demonstrable impact on DRV plasma drug levels (not shown) or the degree of virologic suppression (Fig. 2). Twice-daily oral DRV treatment was also briefly switched to administration via once-daily subcutaneous injection in cohort 2 and 3 animals, which resulted in higher and more consistent DRV plasma concentrations (not shown), although again with no measurable differences in the degree of virologic suppression. Although these experiments evaluating the impact of alterations to DRV administration were limited, it is not clear that the addition of DRV to the drug regimen improved the degree of virologic suppression achieved by the coformulated three-drug regimen containing FTC, TFV, and DTG, despite the fact that DRV is active against SIV in rhesus macaques (49). This suggests that a daily injectable three-drug regimen may be sufficient to achieve clinically relevant levels of suppression in SIV-infected rhesus macaques (49). The maintenance of long-term suppressive therapy is critical for a relevant model system in which to evaluate persistent residual virus and the impact of latency-reversing agents in vivo. In total, all macaques in the current study received daily suppressive cART for >1 year, with cohort 2 animals receiving cART for ∼21 months, and with only modest changes in serum inorganic phosphate and creatinine concentrations measured after >8 months of treatment (not shown), consistent with mild TFV-related renal toxicity (50).
Previous studies have shown that the HDACi SAHA can induce an increase in the measurements of viral transcription in cART-suppressed HIV-infected humans (34, 36, 37) and SIV-infected rhesus macaques (40). However, the pharmacodynamic and virologic effects relative to drug dosing were complex. There was evidence for sustained modulation of histone acetylation and viral transcription and refractoriness following extensive dosing schedules, suggesting that the SAHA treatment schedule may be a critical factor in determining the effectiveness of SAHA-mediated perturbations of viral latency. Moreover, SAHA treatment has not been shown to induce significant increases in plasma viremia, whereas RMD treatment has been reported to induce increases in plasma vRNA (38), perhaps reflecting a greater ability of RMD to induce virus activation of a sufficient magnitude to result in virus production or to induce virus from a larger fraction of latently infected cells in vivo. Recent studies evaluating the ability of various HDACi compounds to induce the expression of HIV in in vitro latency models or primary CD4+ T cells from cART-treated HIV-infected patients have found that various HDACi drugs differ in their potency (51), with RMD demonstrating the greatest potency of all evaluated HDACi compounds (35). Although we previously reported that ex vivo SAHA treatment of rhesus macaque CD4+ T cells from cART-suppressed SIV-infected animals could induce the release of cell-free virus (40), similar experiments conducted using human CD4+ T cells from cART-suppressed HIV-infected humans found that SAHA was inconsistent with regard to its capacity to induce virion production ex vivo (35). Conversely, RMD was able to significantly induce virion production across cells from multiple donors (35), suggesting potential key differences in the potency and/or mechanism of action for the two drugs. Similar to RMD treatment of CD4+ T cells from cART-suppressed humans, ex vivo RMD treatment of CD4+ T cells from our cART-suppressed macaques induced a significant increase in the release of virus into culture supernatants, along with associated measurable increases in acetylated histone levels (Fig. 3), indicating activity for RMD in rhesus cells and for the induction of SIV.
Given the superior virus-inducing activity of RMD suggested by in vitro, ex vivo, and in vivo experiments, and its demonstrated activity in SIV-infected rhesus macaque cells, we examined in vivo the impact of multiple doses of RMD on the persistent residual virus pool in our cART-suppressed macaques, specifically evaluating RMD administered via 4-h intravenous infusion, as the drug is typically administered for the treatment of T cell lymphomas in humans. We show for the first time that in vivo administration of an HDACi in SIV-infected macaques on suppressive cART can lead to a significant increase in plasma viremia during periods of treatment (Fig. 6). Marked transient leukopenia 48 h after RMD treatment might suggest massive cell death, thus raising the possibility that the detected increase in plasma viral RNA reflects the detection of contaminating extracellular vDNA released from dead/dying cells. However, the kinetics of leukopenia was rapid, occurring within 24 to 48 h and returning to baseline/pretreatment levels by 7 days postinfusion (Fig. 5), whereas increases in detectable plasma viremia often lasted beyond 48 h through 7 to 14 days postinfusion. Moreover, virus was pelleted out of clarified plasma by centrifugation prior to viral nucleic acid isolation and quantification (see Materials and Methods), and viral DNA was not detected in the subset of pelleted samples with elevated plasma viral loads from which extracted nucleic acid was analyzed by both standard qRT-PCR and control qRT-PCR run without reverse transcriptase enzyme. The increases in plasma viremia measured with RMD treatment thus likely reflect authentic increases in virion production rather than the detection of vDNA released from cells killed by RMD cytotoxicity.
The ability of RMD, unlike SAHA (34, 36–38, 40), to induce increases in plasma viremia may be due to greater drug potency for RMD (35) and/or potential differences in intracellular drug pharmacology (52). The mechanism of HDAC inhibition for RMD, which acts as a prodrug with intracellular reduction of an intramolecular disulfide bond and subsequent binding of the free sulfhydryl groups to a Zn2+ ion in the active site of target HDAC enzymes, is distinct from other HDACi, such as SAHA (52). The apparently superior activity of RMD may also reflect differences in drug pharmacokinetics and cell exposures in a comparison of RMD administered via 4-h intravenous infusion (46, 53) with the potentially short and varied exposures and rapid pharmacokinetics of orally administered SAHA (34, 40, 54, 55). We have previously shown robust upregulation of acetylated histone levels, similar to that measured here for rhesus CD4+ T cells treated with RMD (Fig. 3), following ex vivo treatment of rhesus CD4+ T cells with SAHA using concentrations achievable in plasma following oral dosing (40). However, the magnitude of acetylated histone upregulation in vivo was greater for RMD (mean, ∼4-fold; maximum, ∼16-fold) at 4 h post-RMD infusion initiation than we measured for SAHA (mean, ∼1.5-fold; maximum, ∼5-fold) at 4 h post-oral SAHA dose (40), suggesting that dosing route or scheduling may also affect the magnitude of in vivo drug activity and virologic impact.
There was no difference in the time to off-cART plasma virus rebound between RMD-treated and saline control-treated animals, indicating that RMD treatment-induced viral reactivation did not lead to a substantial reduction in the number of cells harboring replication-competent proviruses (56). Although the in vivo fate of individual cells harboring SIV genomes that were reactivated by RMD is unclear, and we cannot rule out small changes in the residual virus pool that may have been too minor to alter the time to viral recrudescence; these findings are consistent with the view that viral reactivation alone may be insufficient to induce host cell death, either by lytic viral mechanisms or by cytotoxic T lymphocyte (CTL)-mediated clearance (57). Given that the animals studied here were started on cART at only 4 weeks postinfection, the avoidance of CTL-mediated clearance through the accumulation and archival of CTL escape mutations seems unlikely in light of recent findings demonstrating that the proviral genomes in patients who initiated therapy within the first 3 months of infection harbored almost no CTL escape mutations (58). While the vast majority of persistent proviral genomes in HIV-infected patients started on cART during the chronic phase of infection were shown to contain CTL escape mutations (58) in the absence of additional interventions, such as therapeutic vaccination, to boost immune responses concomitantly with virus reactivation, it is possible that reactivated virus may be able to avoid CTL-mediated clearance even without such escape mutations. Although virus production substantial enough to lead to measurable increases in plasma viremia may indicate that RMD was able to reactivate virus from a large portion of the residual virus pool, it is alternatively possible that RMD robustly reactivated virus from a minor subset of infected cells, perhaps with limited subsequent local viral replication. Nevertheless, it is clear that RMD treatment alone did not confer an overall virologic benefit.
On the whole, these findings suggest that HDACi treatments may have the capacity to robustly reactivate residual HIV-1 in the setting of cART and may therefore act as a useful component of a more comprehensive viral reactivation and elimination strategy. Such an approach, which may include additional latency-reversing agents, such as those that synergize with HDACi (59–62), in conjunction with therapeutic vaccination or another immune response-boosting strategy that can result in the clearance of cells that are induced to express viral gene products, may have promise for the reduction in or elimination of the residual replication-competent virus pool and allow for off-treatment viral remission or eradication. The NHP model of cART-suppressed pathogenic SIV infection we have developed should prove useful for evaluations of such approaches.
ACKNOWLEDGMENTS
We thank the animal care staff in the Laboratory Animal Sciences Program, Leidos Biomedical Research, Inc., for expert animal care and support. We also thank Bei Li and Jillian Hattersley, Gilead Sciences, Inc., for preparation of the cART formulation used in this study.
The content of this publication does not necessarily reflect the views or policies of the Department of Health and Human Services, nor does the mention of trade names, commercial products, or organizations imply endorsement by the U.S. Government.
Funding Statement
This work was supported in part with federal funds from the National Cancer Institute, National Institutes of Health, under contract no. HHSN261200800001E.
REFERENCES
- 1.Chun TW, Justement JS, Murray D, Hallahan CW, Maenza J, Collier AC, Sheth PM, Kaul R, Ostrowski M, Moir S, Kovacs C, Fauci AS. 2010. Rebound of plasma viremia following cessation of antiretroviral therapy despite profoundly low levels of HIV reservoir: implications for eradication. AIDS 24:2803–2808. doi: 10.1097/QAD.0b013e328340a239. [DOI] [PMC free article] [PubMed] [Google Scholar]
- 2.Davey RT Jr, Bhat N, Yoder C, Chun TW, Metcalf JA, Dewar R, Natarajan V, Lempicki RA, Adelsberger JW, Miller KD, Kovacs JA, Polis MA, Walker RE, Falloon J, Masur H, Gee D, Baseler M, Dimitrov DS, Fauci AS, Lane HC. 1999. HIV-1 and T cell dynamics after interruption of highly active antiretroviral therapy (HAART) in patients with a history of sustained viral suppression. Proc Natl Acad Sci U S A 96:15109–15114. doi: 10.1073/pnas.96.26.15109. [DOI] [PMC free article] [PubMed] [Google Scholar]
- 3.Chun TW, Stuyver L, Mizell SB, Ehler LA, Mican JA, Baseler M, Lloyd AL, Nowak MA, Fauci AS. 1997. Presence of an inducible HIV-1 latent reservoir during highly active antiretroviral therapy. Proc Natl Acad Sci U S A 94:13193–13197. doi: 10.1073/pnas.94.24.13193. [DOI] [PMC free article] [PubMed] [Google Scholar]
- 4.Chun TW, Finzi D, Margolick J, Chadwick K, Schwartz D, Siliciano RF. 1995. In vivo fate of HIV-1-infected T cells: quantitative analysis of the transition to stable latency. Nat Med 1:1284–1290. doi: 10.1038/nm1295-1284. [DOI] [PubMed] [Google Scholar]
- 5.Finzi D, Blankson J, Siliciano JD, Margolick JB, Chadwick K, Pierson T, Smith K, Lisziewicz J, Lori F, Flexner C, Quinn TC, Chaisson RE, Rosenberg E, Walker B, Gange S, Gallant J, Siliciano RF. 1999. Latent infection of CD4+ T cells provides a mechanism for lifelong persistence of HIV-1, even in patients on effective combination therapy. Nat Med 5:512–517. doi: 10.1038/8394. [DOI] [PubMed] [Google Scholar]
- 6.Wong JK, Hezareh M, Gunthard HF, Havlir DV, Ignacio CC, Spina CA, Richman DD. 1997. Recovery of replication-competent HIV despite prolonged suppression of plasma viremia. Science 278:1291–1295. doi: 10.1126/science.278.5341.1291. [DOI] [PubMed] [Google Scholar]
- 7.Chun TW, Carruth L, Finzi D, Shen X, DiGiuseppe JA, Taylor H, Hermankova M, Chadwick K, Margolick J, Quinn TC, Kuo YH, Brookmeyer R, Zeiger MA, Barditch-Crovo P, Siliciano RF. 1997. Quantification of latent tissue reservoirs and total body viral load in HIV-1 infection. Nature 387:183–188. doi: 10.1038/387183a0. [DOI] [PubMed] [Google Scholar]
- 8.Cleary S, McIntyre D. 2010. Financing equitable access to antiretroviral treatment in South Africa. BMC Health Serv Res 10 (Suppl 1):S2. [DOI] [PMC free article] [PubMed] [Google Scholar]
- 9.Hunt PW. 2012. HIV and inflammation: mechanisms and consequences. Curr HIV/AIDS Rep 9:139–147. doi: 10.1007/s11904-012-0118-8. [DOI] [PubMed] [Google Scholar]
- 10.Vinikoor MJ, Cope A, Gay CL, Ferrari G, McGee KS, Kuruc JD, Lennox JL, Margolis DM, Hicks CB, Eron JJ. 2013. Antiretroviral therapy initiated during acute HIV infection fails to prevent persistent T-cell activation. J Acquir Immune Defic Syndr 62:505–508. doi: 10.1097/QAI.0b013e318285cd33. [DOI] [PMC free article] [PubMed] [Google Scholar]
- 11.Rajasuriar R, Wright E, Lewin SR. 2015. Impact of antiretroviral therapy (ART) timing on chronic immune activation/inflammation and end-organ damage. Curr Opin HIV AIDS 10:35–42. doi: 10.1097/COH.0000000000000118. [DOI] [PMC free article] [PubMed] [Google Scholar]
- 12.Antiretroviral Therapy Cohort Collaboration. 2008. Life expectancy of individuals on combination antiretroviral therapy in high-income countries: a collaborative analysis of 14 cohort studies. Lancet 372:293–299. doi: 10.1016/S0140-6736(08)61113-7. [DOI] [PMC free article] [PubMed] [Google Scholar]
- 13.Bhaskaran K, Hamouda O, Sannes M, Boufassa F, Johnson AM, Lambert PC, Porter K, CASCADE Collaboration. 2008. Changes in the risk of death after HIV seroconversion compared with mortality in the general population. JAMA 300:51–59. doi: 10.1001/jama.300.1.51. [DOI] [PubMed] [Google Scholar]
- 14.Lohse N, Hansen AB, Pedersen G, Kronborg G, Gerstoft J, Sorensen HT, Vaeth M, Obel N. 2007. Survival of persons with and without HIV infection in Denmark, 1995–2005. Ann Intern Med 146:87–95. doi: 10.7326/0003-4819-146-2-200701160-00003. [DOI] [PubMed] [Google Scholar]
- 15.Losina E, Schackman BR, Sadownik SN, Gebo KA, Walensky RP, Chiosi JJ, Weinstein MC, Hicks PL, Aaronson WH, Moore RD, Paltiel AD, Freedberg KA. 2009. Racial and sex disparities in life expectancy losses among HIV-infected persons in the United States: impact of risk behavior, late initiation, and early discontinuation of antiretroviral therapy. Clin Infect Dis 49:1570–1578. doi: 10.1086/644772. [DOI] [PMC free article] [PubMed] [Google Scholar]
- 16.Hunt PW, Martin JN, Sinclair E, Bredt B, Hagos E, Lampiris H, Deeks SG. 2003. T cell activation is associated with lower CD4+ T cell gains in human immunodeficiency virus-infected patients with sustained viral suppression during antiretroviral therapy. J Infect Dis 187:1534–1543. doi: 10.1086/374786. [DOI] [PubMed] [Google Scholar]
- 17.Valdez H, Connick E, Smith KY, Lederman MM, Bosch RJ, Kim RS, St. Clair M, Kuritzkes DR, Kessler H, Fox L, Blanchard-Vargas M, Landay A, AIDS Clinical Trials Group Protocol 375 Team. 2002. Limited immune restoration after 3 years' suppression of HIV-1 replication in patients with moderately advanced disease. AIDS 16:1859–1866. doi: 10.1097/00002030-200209270-00002. [DOI] [PubMed] [Google Scholar]
- 18.Massanella M, Negredo E, Perez-Alvarez N, Puig J, Ruiz-Hernandez R, Bofill M, Clotet B, Blanco J. 2010. CD4 T-cell hyperactivation and susceptibility to cell death determine poor CD4 T-cell recovery during suppressive HAART. AIDS 24:959–968. doi: 10.1097/QAD.0b013e328337b957. [DOI] [PubMed] [Google Scholar]
- 19.Neuhaus J, Jacobs DR Jr, Baker JV, Calmy A, Duprez D, La Rosa A, Kuller LH, Pett SL, Ristola M, Ross MJ, Shlipak MG, Tracy R, Neaton JD. 2010. Markers of inflammation, coagulation, and renal function are elevated in adults with HIV infection. J Infect Dis 201:1788–1795. doi: 10.1086/652749. [DOI] [PMC free article] [PubMed] [Google Scholar]
- 20.Lederman MM, Calabrese L, Funderburg NT, Clagett B, Medvik K, Bonilla H, Gripshover B, Salata RA, Taege A, Lisgaris M, McComsey GA, Kirchner E, Baum J, Shive C, Asaad R, Kalayjian RC, Sieg SF, Rodriguez B. 2011. Immunologic failure despite suppressive antiretroviral therapy is related to activation and turnover of memory CD4 cells. J Infect Dis 204:1217–1226. doi: 10.1093/infdis/jir507. [DOI] [PMC free article] [PubMed] [Google Scholar]
- 21.Jain V, Hartogensis W, Bacchetti P, Hunt PW, Hatano H, Sinclair E, Epling L, Lee TH, Busch MP, McCune JM, Pilcher CD, Hecht FM, Deeks SG. 2013. Antiretroviral therapy initiated within 6 months of HIV infection is associated with lower T-cell activation and smaller HIV reservoir size. J Infect Dis 208:1202–1211. doi: 10.1093/infdis/jit311. [DOI] [PMC free article] [PubMed] [Google Scholar]
- 22.Siliciano JD, Siliciano RF. 2013. HIV-1 eradication strategies: design and assessment. Curr Opin HIV AIDS 8:318–325. [DOI] [PMC free article] [PubMed] [Google Scholar]
- 23.Richman DD, Margolis DM, Delaney M, Greene WC, Hazuda D, Pomerantz RJ. 2009. The challenge of finding a cure for HIV infection. Science 323:1304–1307. doi: 10.1126/science.1165706. [DOI] [PubMed] [Google Scholar]
- 24.Taube R, Peterlin M. 2013. Lost in transcription: molecular mechanisms that control HIV latency. Viruses 5:902–927. doi: 10.3390/v5030902. [DOI] [PMC free article] [PubMed] [Google Scholar]
- 25.Budhiraja S, Famiglietti M, Bosque A, Planelles V, Rice AP. 2013. Cyclin T1 and CDK9 T-loop phosphorylation are downregulated during establishment of HIV-1 latency in primary resting memory CD4+ T cells. J Virol 87:1211–1220. doi: 10.1128/JVI.02413-12. [DOI] [PMC free article] [PubMed] [Google Scholar]
- 26.Tyagi M, Pearson RJ, Karn J. 2010. Establishment of HIV latency in primary CD4+ cells is due to epigenetic transcriptional silencing and P-TEFb restriction. J Virol 84:6425–6437. doi: 10.1128/JVI.01519-09. [DOI] [PMC free article] [PubMed] [Google Scholar]
- 27.Keedy KS, Archin NM, Gates AT, Espeseth A, Hazuda DJ, Margolis DM. 2009. A limited group of class I histone deacetylases acts to repress human immunodeficiency virus type 1 expression. J Virol 83:4749–4756. doi: 10.1128/JVI.02585-08. [DOI] [PMC free article] [PubMed] [Google Scholar]
- 28.Quivy V, De Walque S, Van Lint C. 2007. Chromatin-associated regulation of HIV-1 transcription: implications for the development of therapeutic strategies. Subcell Biochem 41:371–396. [PubMed] [Google Scholar]
- 29.Ylisastigui L, Archin NM, Lehrman G, Bosch RJ, Margolis DM. 2004. Coaxing HIV-1 from resting CD4 T cells: histone deacetylase inhibition allows latent viral expression. AIDS 18:1101–1108. doi: 10.1097/00002030-200405210-00003. [DOI] [PubMed] [Google Scholar]
- 30.Ylisastigui L, Coull JJ, Rucker VC, Melander C, Bosch RJ, Brodie SJ, Corey L, Sodora DL, Dervan PB, Margolis DM. 2004. Polyamides reveal a role for repression in latency within resting T cells of HIV-infected donors. J Infect Dis 190:1429–1437. doi: 10.1086/423822. [DOI] [PubMed] [Google Scholar]
- 31.Contreras X, Schweneker M, Chen CS, McCune JM, Deeks SG, Martin J, Peterlin BM. 2009. Suberoylanilide hydroxamic acid reactivates HIV from latently infected cells. J Biol Chem 284:6782–6789. doi: 10.1074/jbc.M807898200. [DOI] [PMC free article] [PubMed] [Google Scholar]
- 32.Archin NM, Espeseth A, Parker D, Cheema M, Hazuda D, Margolis DM. 2009. Expression of latent HIV induced by the potent HDAC inhibitor suberoylanilide hydroxamic acid. AIDS Res Hum Retroviruses 25:207–212. doi: 10.1089/aid.2008.0191. [DOI] [PMC free article] [PubMed] [Google Scholar]
- 33.Archin NM, Keedy KS, Espeseth A, Dang H, Hazuda DJ, Margolis DM. 2009. Expression of latent human immunodeficiency type 1 is induced by novel and selective histone deacetylase inhibitors. AIDS 23:1799–1806. doi: 10.1097/QAD.0b013e32832ec1dc. [DOI] [PMC free article] [PubMed] [Google Scholar]
- 34.Archin NM, Liberty AL, Kashuba AD, Choudhary SK, Kuruc JD, Crooks AM, Parker DC, Anderson EM, Kearney MF, Strain MC, Richman DD, Hudgens MG, Bosch RJ, Coffin JM, Eron JJ, Hazuda DJ, Margolis DM. 2012. Administration of vorinostat disrupts HIV-1 latency in patients on antiretroviral therapy. Nature 487:482–485. doi: 10.1038/nature11286. [DOI] [PMC free article] [PubMed] [Google Scholar]
- 35.Wei DG, Chiang V, Fyne E, Balakrishnan M, Barnes T, Graupe M, Hesselgesser J, Irrinki A, Murry JP, Stepan G, Stray KM, Tsai A, Yu H, Spindler J, Kearney M, Spina CA, McMahon D, Lalezari J, Sloan D, Mellors J, Geleziunas R, Cihlar T. 2014. Histone deacetylase inhibitor romidepsin induces HIV expression in CD4 T cells from patients on suppressive antiretroviral therapy at concentrations achieved by clinical dosing. PLoS Pathog 10:e1004071. doi: 10.1371/journal.ppat.1004071. [DOI] [PMC free article] [PubMed] [Google Scholar]
- 36.Archin NM, Bateson R, Tripathy M, Crooks AM, Yang KH, Dahl NP, Kearney MF, Anderson EM, Coffin JM, Strain MC, Richman DD, Robertson KR, Kashuba AD, Bosch RJ, Hazuda DJ, Kuruc JD, Eron JJ, Margolis DM. 2014. HIV-1 Expression within resting CD4 T cells after multiple doses of vorinostat. J Infect Dis 210:728–735. [DOI] [PMC free article] [PubMed] [Google Scholar]
- 37.Elliott JH, Wightman F, Solomon A, Ghneim K, Ahlers J, Cameron MJ, Smith MZ, Spelman T, McMahon J, Velayudham P, Brown G, Roney J, Watson J, Prince MH, Hoy JF, Chomont N, Fromentin R, Procopio FA, Zeidan J, Palmer S, Odevall L, Johnstone RW, Martin BP, Sinclair E, Deeks SG, Hazuda DJ, Cameron PU, Sekaly RP, Lewin SR. 2014. Activation of HIV transcription with short-course vorinostat in HIV-infected patients on suppressive antiretroviral therapy. PLoS Pathog 10:e1004473. doi: 10.1371/journal.ppat.1004473. [DOI] [PMC free article] [PubMed] [Google Scholar]
- 38.Søgaard OS, Graversen ME, Leth S, Olesen R, Brinkmann CR, Nissen SK, Kjær AS, Schleimann MH, Denton PW, Hey-Cunningham WJ, Koelsch KK, Pantaleo G, Krogsgaard K, Sommerfelt M, Fromentin R, Chomont N, Rasmussen TA, Østergaard L, Tolstrup M. 2015. The depsipeptide romidepsin reverses HIV-1 latency in vivo. PLoS Pathog 11:e1005142. doi: 10.1371/journal.ppat.1005142. [DOI] [PMC free article] [PubMed] [Google Scholar]
- 39.Del Prete GQ, Lifson JD. 2013. Considerations in the development of nonhuman primate models of combination antiretroviral therapy for studies of AIDS virus suppression, residual virus, and curative strategies. Curr Opin HIV AIDS 8:262–272. [DOI] [PMC free article] [PubMed] [Google Scholar]
- 40.Del Prete GQ, Shoemaker R, Oswald K, Lara A, Trubey CM, Fast R, Schneider DK, Kiser R, Coalter V, Wiles A, Wiles R, Freemire B, Keele BF, Estes JD, Quinones OA, Smedley J, Macallister R, Sanchez RI, Wai JS, Tan CM, Alvord WG, Hazuda DJ, Piatak M Jr, Lifson JD. 2014. Effect of suberoylanilide hydroxamic acid (SAHA) administration on the residual virus pool in a model of combination antiretroviral therapy-mediated suppression in SIVmac239-infected Indian rhesus macaques. Antimicrob Agents Chemother 58:6790–6806. doi: 10.1128/AAC.03746-14. [DOI] [PMC free article] [PubMed] [Google Scholar]
- 41.Whitney JB, Hill AL, Sanisetty S, Penaloza-MacMaster P, Liu J, Shetty M, Parenteau L, Cabral C, Shields J, Blackmore S, Smith JY, Brinkman AL, Peter LE, Mathew SI, Smith KM, Borducchi EN, Rosenbloom DI, Lewis MG, Hattersley J, Li B, Hesselgesser J, Geleziunas R, Robb ML, Kim JH, Michael NL, Barouch DH. 2014. Rapid seeding of the viral reservoir prior to SIV viraemia in rhesus monkeys. Nature 512:74–77. [DOI] [PMC free article] [PubMed] [Google Scholar]
- 42.Del Prete GQ, Kearney MF, Spindler J, Wiegand A, Chertova E, Roser JD, Estes JD, Hao XP, Trubey CM, Lara A, Lee K, Chaipan C, Bess JW Jr, Nagashima K, Keele BF, Macallister R, Smedley J, Pathak VK, Kewalramani VN, Coffin JM, Lifson JD. 2012. Restricted replication of xenotropic murine leukemia virus-related virus in pigtailed macaques. J Virol 86:3152–3166. doi: 10.1128/JVI.06886-11. [DOI] [PMC free article] [PubMed] [Google Scholar]
- 43.Tabb B, Morcock DR, Trubey CM, Quinones OA, Hao XP, Smedley J, Macallister R, Piatak M Jr, Harris LD, Paiardini M, Silvestri G, Brenchley JM, Alvord WG, Lifson JD, Estes JD. 2013. Reduced inflammation and lymphoid tissue immunopathology in rhesus macaques receiving anti-tumor necrosis factor treatment during primary simian immunodeficiency virus infection. J Infect Dis 207:880–892. doi: 10.1093/infdis/jis643. [DOI] [PMC free article] [PubMed] [Google Scholar]
- 44.Pinheiro JC, Bates DM. 2000. Mixed-effects models in S and S-PLUS. Springer-Verlag, New York, NY. [Google Scholar]
- 45.Crowder MJ, Hand DJ. 1990. Analysis of repeated measures, p 27–42. Chapman and Hall, London, United Kingdom. [Google Scholar]
- 46.Berg SL, Stone J, Xiao JJ, Chan KK, Nuchtern J, Dauser R, McGuffey L, Thompson P, Blaney SM. 2004. Plasma and cerebrospinal fluid pharmacokinetics of depsipeptide (FR901228) in nonhuman primates. Cancer Chemother Pharmacol 54:85–88. doi: 10.1007/s00280-004-0766-5. [DOI] [PubMed] [Google Scholar]
- 47.Woo S, Gardner ER, Chen X, Ockers SB, Baum CE, Sissung TM, Price DK, Frye R, Piekarz RL, Bates SE, Figg WD. 2009. Population pharmacokinetics of romidepsin in patients with cutaneous T-cell lymphoma and relapsed peripheral T-cell lymphoma. Clin Cancer Res 15:1496–1503. doi: 10.1158/1078-0432.CCR-08-1215. [DOI] [PMC free article] [PubMed] [Google Scholar]
- 48.Celgene Corporation. Istodax (romidepsin) for injection. Highlights of prescribing information. Celgene Corporation, Summit, NJ. [Google Scholar]
- 49.Del Prete GQ, Smedley J, Macallister R, Jones GS, Li B, Hattersley J, Zheng J, Piatak M Jr, Keele BF, Hesselgesser J, Geleziunas R, Lifson JD. 9 September 2015. Comparative evaluation of coformulated injectable combination antiretroviral therapy regimens in simian immunodeficiency virus-infected rhesus macaques. AIDS Res Hum Retrovir. doi: 10.1089/aid.2015.0130. [DOI] [PMC free article] [PubMed] [Google Scholar]
- 50.Van Rompay KK, Durand-Gasselin L, Brignolo LL, Ray AS, Abel K, Cihlar T, Spinner A, Jerome C, Moore J, Kearney BP, Marthas ML, Reiser H, Bischofberger N. 2008. Chronic administration of tenofovir to rhesus macaques from infancy through adulthood and pregnancy: summary of pharmacokinetics and biological and virological effects. Antimicrob Agents Chemother 52:3144–3160. doi: 10.1128/AAC.00350-08. [DOI] [PMC free article] [PubMed] [Google Scholar]
- 51.Rasmussen TA, Schmeltz Søgaard O, Brinkmann C, Wightman F, Lewin SR, Melchjorsen J, Dinarello C, Østergaard L, Tolstrup M. 2013. Comparison of HDAC inhibitors in clinical development: effect on HIV production in latently infected cells and T-cell activation. Hum Vaccin Immunother 9:993–1001. doi: 10.4161/hv.23800. [DOI] [PMC free article] [PubMed] [Google Scholar]
- 52.Furumai R, Matsuyama A, Kobashi N, Lee KH, Nishiyama M, Nakajima H, Tanaka A, Komatsu Y, Nishino N, Yoshida M, Horinouchi S. 2002. FK228 (depsipeptide) as a natural prodrug that inhibits class I histone deacetylases. Cancer Res 62:4916–4921. [PubMed] [Google Scholar]
- 53.Sandor V, Bakke S, Robey RW, Kang MH, Blagosklonny MV, Bender J, Brooks R, Piekarz RL, Tucker E, Figg WD, Chan KK, Goldspiel B, Fojo AT, Balcerzak SP, Bates SE. 2002. Phase I trial of the histone deacetylase inhibitor, depsipeptide (FR901228, NSC 630176), in patients with refractory neoplasms. Clin Cancer Res 8:718–728. [PubMed] [Google Scholar]
- 54.Rubin EH, Agrawal NG, Friedman EJ, Scott P, Mazina KE, Sun L, Du L, Ricker JL, Frankel SR, Gottesdiener KM, Wagner JA, Iwamoto M. 2006. A study to determine the effects of food and multiple dosing on the pharmacokinetics of vorinostat given orally to patients with advanced cancer. Clin Cancer Res 12:7039–7045. doi: 10.1158/1078-0432.CCR-06-1802. [DOI] [PubMed] [Google Scholar]
- 55.Du L, Musson DG, Wang AQ. 2005. High turbulence liquid chromatography online extraction and tandem mass spectrometry for the simultaneous determination of suberoylanilide hydroxamic acid and its two metabolites in human serum. Rapid Commun Mass Spectrom 19:1779–1787. doi: 10.1002/rcm.1984. [DOI] [PubMed] [Google Scholar]
- 56.Hill AL, Rosenbloom DI, Fu F, Nowak MA, Siliciano RF. 2014. Predicting the outcomes of treatment to eradicate the latent reservoir for HIV-1. Proc Natl Acad Sci U S A 111:13475–13480. doi: 10.1073/pnas.1406663111. [DOI] [PMC free article] [PubMed] [Google Scholar]
- 57.Shan L, Deng K, Shroff NS, Durand CM, Rabi SA, Yang HC, Zhang H, Margolick JB, Blankson JN, Siliciano RF. 2012. Stimulation of HIV-1-specific cytolytic T lymphocytes facilitates elimination of latent viral reservoir after virus reactivation. Immunity 36:491–501. doi: 10.1016/j.immuni.2012.01.014. [DOI] [PMC free article] [PubMed] [Google Scholar]
- 58.Deng K, Pertea M, Rongvaux A, Wang L, Durand CM, Ghiaur G, Lai J, McHugh HL, Hao H, Zhang H, Margolick JB, Gurer C, Murphy AJ, Valenzuela DM, Yancopoulos GD, Deeks SG, Strowig T, Kumar P, Siliciano JD, Salzberg SL, Flavell RA, Shan L, Siliciano RF. 2015. Broad CTL response is required to clear latent HIV-1 due to dominance of escape mutations. Nature 517:381–385. doi: 10.1038/nature14053. [DOI] [PMC free article] [PubMed] [Google Scholar]
- 59.Burnett JC, Lim KI, Calafi A, Rossi JJ, Schaffer DV, Arkin AP. 2010. Combinatorial latency reactivation for HIV-1 subtypes and variants. J Virol 84:5958–5974. doi: 10.1128/JVI.00161-10. [DOI] [PMC free article] [PubMed] [Google Scholar]
- 60.Laird GM, Bullen CK, Rosenbloom DI, Martin AR, Hill AL, Durand CM, Siliciano JD, Siliciano RF. 2015. Ex vivo analysis identifies effective HIV-1 latency-reversing drug combinations. J Clin Invest 125:1901–1912. doi: 10.1172/JCI80142. [DOI] [PMC free article] [PubMed] [Google Scholar]
- 61.Pérez M, de Vinuesa AG, Sanchez-Duffhues G, Marquez N, Bellido ML, Muñoz-Fernandez MA, Moreno S, Castor TP, Calzado MA, Muñoz E. 2010. Bryostatin-1 synergizes with histone deacetylase inhibitors to reactivate HIV-1 from latency. Curr HIV Res 8:418–429. doi: 10.2174/157016210793499312. [DOI] [PubMed] [Google Scholar]
- 62.Reuse S, Calao M, Kabeya K, Guiguen A, Gatot JS, Quivy V, Vanhulle C, Lamine A, Vaira D, Demonte D, Martinelli V, Veithen E, Cherrier T, Avettand V, Poutrel S, Piette J, de Launoit Y, Moutschen M, Burny A, Rouzioux C, De Wit S, Herbein G, Rohr O, Collette Y, Lambotte O, Clumeck N, Van Lint C. 2009. Synergistic activation of HIV-1 expression by deacetylase inhibitors and prostratin: implications for treatment of latent infection. PLoS One 4:e6093. doi: 10.1371/journal.pone.0006093. [DOI] [PMC free article] [PubMed] [Google Scholar]
- 63.National Research Council. 2011. Guide for the care and use of laboratory animals, 8th ed National Academies Press, Washington, DC. [Google Scholar]