

Abstract
In addition to their stem/progenitor properties, mesenchymal stem cells (MSCs) also exhibit potent effector (angiogenic, antiinflammatory, immuno-modulatory) functions that are largely paracrine in nature. It is widely believed that effector functions underlie most of the therapeutic potential of MSCs and are independent of their stem/progenitor properties. Here we demonstrate that stem/progenitor and effector functions are coordinately regulated at the cellular level by the transcription factor Twist1 and specified within populations according to a hierarchical model. We further show that manipulation of Twist1 levels by genetic approaches or by exposure to widely used culture supplements including fibroblast growth factor 2 (Ffg2) and interferon gamma (IFN-gamma) alters MSC efficacy in cell-based and in vivo assays in a predictable manner. Thus, by mechanistically linking stem/progenitor and effector functions our studies provide a unifying framework in the form of an MSC hierarchy that models the functional complexity of populations. Using this framework, we developed a CLinical Indications Prediction (CLIP) scale that predicts how donor-to-donor heterogeneity and culture conditions impact the therapeutic efficacy of MSC populations for different disease indications.
Keywords: Mesenchymal Stem Cells, Mesenchymal Stromal Cells, Twist1, Interferon Gamma, Fibroblast Growth Factor, Immuno-suppression, Angiogenesis, Inflammation, Lung Injury
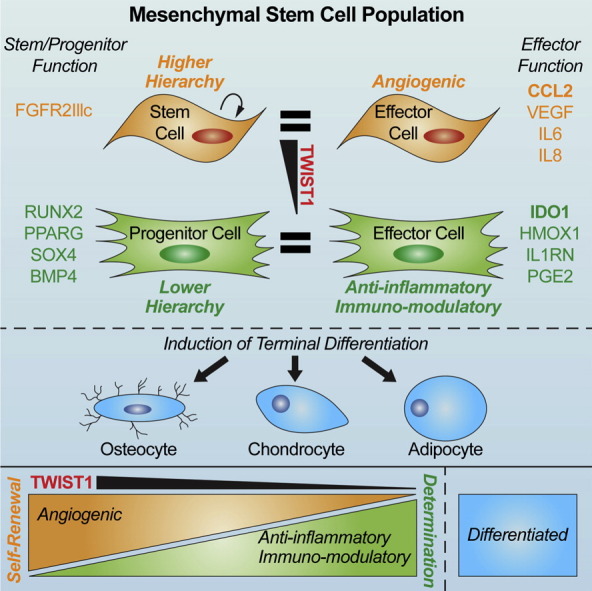
Graphical Abstract
Highlights
-
•
Mesenchymal stem cells exhibit stem/progenitor and effector (angiogenic, anti-inflammatory, immuno-modulatory) functions.
-
•
Twist1 coordinately regulates stem/progenitor and effector functions, which are specified hierarchically in populations.
-
•
Twist1 levels predict inter-population differences in therapeutic efficacy of mesenchymal stem cells for different disease indications.
Mesenchymal stem cells are being evaluated in human clinical trials for treating ischemic, inflammatory, and immunological diseases. However, most completed trials have yielded suboptimal outcomes due to the inability to predict the potency of different donor populations, which are functionally heterogeneous. We demonstrate that clinically relevant biological activities of MSCs are coordinately regulated by the transcription factor Twist1. Furthermore, we showed that TWIST1 levels reliably predict differences in the angiogenic, anti-inflammatory, and immuno-modulatory activity of populations and as such used it to develop a Clinical Indications Prediction (CLIP) scale. By predicting potency of MSC populations for different disease indications the CLIP scale is expected to dramatically improve MSC-based clinical trial outcomes.
1. Introduction
Mesenchymal stem cell (MSC)-based therapies are currently being evaluated in more than 500 clinical trials (https://clinicaltrails.gov) for the treatment of various skeletal and non-skeletal related disorders. Although some patients have benefited significantly by these treatments, many MSC-based clinical trials have yielded suboptimal outcomes or failed to meet their primary endpoints of efficacy (Phinney, D. G., et al., 2013, Lin, Y. and Hogan, W. J., 2011). A limiting factor in the development of efficacious MSC-based therapies is the fact that MSCs are ill-defined based on physical, phenotypic and functional properties. For example, routinely used methods to isolate MSCs from bone marrow yield populations that exhibit significant heterogeneity in terms of morphologic features, growth rate, life span, differentiation potential, and potency in functional-based assays (Phinney, D. G., 2007, Wagner, W. and Ho, A. D., 2007, Zhou, S., et al., 2008, Russell, K. C., et al., 2010, Whitfield, M. J., et al., 2013). Additionally, few if any established surface markers used to characterize MSCs relate phenotype to function thereby making it difficult to determine whether cell preparations used in translational/clinical studies are of similar composition and biological activity. Finally, the prevailing viewpoint that MSCs modulate the immune system and promote tissue regeneration independent of their stem/progenitor properties (Caplan, A. I. and Correa, D., 2011, Bernardo, M. E. and Fibbe, W. E., 2013) has impeded efforts to describe their functional complexity using established principles of stem cell biology.
Here we explored the mechanisms that confer different functional attributes onto MSCs to gain insight at the cellular and molecular level as to how they achieve such broad-based therapeutic effects. Our results establish the transcription factor Twist1 as an intrinsic determinant of intra- and inter-population heterogeneity by regulating multiple pathways affecting cell growth, cell cycle progression, DNA replication, cell surface receptor signaling and survival. Furthermore, we show that Twist1 is a direct target of fibroblast growth factor (Fgf2) and interferon gamma (IFN-gamma) action in MSCs, and that alterations in Twist1 levels mediated by exposure to Fgf2, IFN-gamma or via direct genetic manipulation alters the growth, survival and multi-potency as well as angiogenic, anti-inflammatory and immuno-modulatory activities of cells in predictable ways. These findings demonstrate a direct mechanistic link between stem/progenitor and effector functions in MSCs, and reveal that Twist1-mediated changes in cell function/efficacy can be modeled via a hierarchical process. Using this information we developed a CLinical Indications Prediction (CLIP) scale that predicts the therapeutic efficacy of different human MSC donor populations for a given disease indication based on TWIST1 expression levels, which specifies the positional identity of cells within the established hierarchy.
2. Materials and Methods
2.1. Cell Culture
Human MSCs were obtained from bone marrow as previously described (Russell et al., 2010) and seeded at 500–1000 cells/cm2 in complete culture media (CCM) consisting of α-MEM with 2 mM l-glutamine (GIBCO), 17% FBS (HyClone), 100 U/ml penicillin and 100 μg/ml streptomycin. Colony forming unit-fibroblast (CFU-F) content and multi-lineage differentiation was determined as previously described (Russell et al., 2010). Cell growth was analyzed using the MTT Cell Proliferation Assay Kit (Cayman Chemical Company) or by flow cytometric analysis of carboxyfluorescein succinimidyl ester (CSFE)-labeled cells. Cells were initially seeded at 1000 cells/cm2 for MTT and CSFE assays and analyses were conducted when cells reached ~ 50% confluence to ensure log phase growth. MSCs were transfected with small interfering RNAs (siRNAs) using the inverse transfection protocol (Invitrogen) and collected at 3 days post-transfection for viability measures, cell cycle analysis and to harvest RNA and protein, at 7 days post-transfection for cell proliferation assays, and at 14 days post-transfection for CFU-F assays. Stained cells were analyzed using an LSR II Flow Cytometer System (Beckton Dickinson) and FlowJo software (Tree Star, Inc.).
2.2. Microarray Analysis
An equal amount of RNA was pooled from triplicate experiments and cDNA prepared following the manufacturer's protocols from the WT expression kit (4411973, Affymetrix). Biotin-labeled cDNA was fragmented and hybridized to the Human Gene ST 1.0 microarray (901086, Affymetrix) and data analysis was performed using Expression Console analysis software (Affymetrix). These data have been deposited in NCBI's Gene Expression Omnibus (GEO) and are accessible through GEO Series accession number GSE76158 (http://www.ncbi.nlm.nih.gov/geo/query/acc.cgi?acc=GSE76158). Functional profiling of microarray data was performed using g:Profiler based on hierarchical sorting using the best parent fit (Reimand et al., 2011). Unbiased gene annotation enrichment analysis for the top five functional clusters of Twist1 targets was performed by DAVID analysis using automated functional annotation clustering based on GO Terms of biological processes (GO_BP_FAT). Gene lists were annotated using the gene accession conversion tool to ensure accuracy. The individual genes of these five categories were then curated for enhanced accuracy by systematic search of the GeneCards Compendium (http://www.genecards.org), which validated almost all of the initial genes.
2.3. Mixed Lymphocyte Reactions
Freshly isolated human peripheral blood mono-nuclear cells (PBMNCs) obtained from OneBlood Florida (http://www.oneblood.org) were suspended in RPMI-10 media supplemented with 10% fetal bovine serum (FBS) (Atlanta Biologics), 1 × MEM Vitamin solution, 1 × MEM NEAA solution, 1 × l-Glut, 0.01 M HEPES, 100 U/ml penicillin, 100 U/ml streptomycin, 1 mM Sodium pyruvate (all from Gibco), and 10 ng/ml IL-2 (Biolegend) and co-cultured with pre-plated MSCs at a MSC:PBMNC ratio of 1:20. Dynabeads® Human T-Activator CD3/CD28 (Gibco) were added to the co-culture at a bead/PBMNC ratio of 2:1. Cultures were then incubated at 37 °C in 5% CO2 for 5 days after which the non-adherent PBMNCs were collected and stained using the FITC Mouse Anti-Human Ki-67 Set (556026, BD Pharmingen) according to manufacturer's instructions. Alternatively, Th1/Th2/Th17 cytokines were measured in the conditioned media collected 5 days post-co-culture using the Human Th1/Th2/Th17 CBA Kit (560485, BD Biosciences) according to manufacturer's instructions. Briefly, 50 μl of cytokine standards and samples were mixed with 50 μl of mixed capture beads and phycoerthyrin (PE) detection reagent and incubated for 3 h. Beads were washed, suspended in 300 μl wash buffer and analyzed by flow cytometry. Median intensity of PE fluorescence was used to derive concentration vs. fluorescence standard curves to determine the concentration of each cytokine.
2.4. Chip-PCR
MSCs were cultured in media containing 1% formaldehyde to cross-link protein and DNA and the reaction quenched by adding 1.375 M glycine to the culture media. The cell monolayer was harvested by scraping in 1 × cold PBS, centrifuged at 1500 rpm for 10 min at 4 °C, incubated in cell lysis buffer and then the DNA sheared by sonication. Twist1 bound chromatin was precipitated using an anti-Twist1 antibody (sc-15393, Santa Cruz Biotechnology) and the Dynabeads® Protein G Immuno-precipitation kit (Life Technologies). Eluted DNA was purified using spin columns (Qiagen) and then used as input in real-time PCR reactions using the primers listed in Table S5.
2.5. TWIST1 Cloning
Genomic DNA was purified from human MCS using the Quick-gDNA MiniPrep Kit (Zymo Research) according to manufacturer's directions. TWIST1 was amplified by polymerase chain reaction using the KOD HotStart DNA Polymerase (EMD Millipore) with the forward and reverse primers 5′-GCCTGCACGGAGGTATAAG-3′ and 5′-GAGGAAATCGAGGTGGACTG-3′, respectively. Following amplification, the product was blunt ligated into the EcoRV site of pBlueScript II SK + using T4 DNA Ligase (New England Biolabs). Following sequence and orientation verification, pBlueScript-TWIST1 was digested with XhoI and EcoRI and the product ligated into the XhoI and EcoRI site of pMSCV-PIG (Addgene) to generate a TWIST1 retroviral construct (pMSCV-PIG-Twist1). The latter was co-transfected into HEK-293 cells with pCL-Ampho using Lipofectamine 2000 (Life Technologies) according to manufacturer's directions. At 72 h post-transfection supernatant was collected, passed through a .45 μm syringe filter, and 4 ml of filtered supernatant was combined with 1 ml of fresh MSC media and 4 μg/ml polybrene and added to MSCs plated at a density of 1000 cells/cm2 in a 60 mm dish. MSCs were subsequently sorted for GFP expression by FACS. A pMSCV-PIG vector-only control was generated using the same method.
2.6. In Vivo Treatments
All animal studies conform to the Guide for the Care and Use of Laboratory Animals (The Nationals Academic Press, Eight Edition) and protocols approved by the Institutional Care and Use Committee of Scripps Florida. Institutional review board (IRB) approval was obtained for use of human samples. Bleomycin-induced lung injury was performed as previously described (Ortiz, L. A., et al., 2003, Ortiz, L. A., et al., 2007) except experiments were conducted using immune-deficient mice (B6.CB17-Prkdcscid/SzJ, The Jackson Labs) and animals were administered 5 × 10⁵ human MSCs. Where indicated human MSCs were cultured in Fgf2 (20 ng/ml) supplemented media for 7 days or transfected with a TWIST1-specific siRNA.
2.7. Statistical Analyses
Significance was estimated by unpaired Student's t test in experiments where comparisons between two groups was warranted. Alternatively, significance was determined by one-way analysis of variance (ANOVA) and post-hoc Tukey or Tukey–Kramer tests for equal or unequal sample size, respectively. Cell cycle data was fit using the Watson pragmatic model and correlations were determined using the Pearson's moment correlation coefficient. Differences between treatment groups were considered significant with a p value of ≤ 0.05.
3. Results
3.1. TWIST1 Levels Predict Intrinsic Differences Between MSC Donor Populations
It is well-established that MSC populations derived from different human donors are intrinsically heterogeneous. Therefore, we initially questioned if donor-to-donor heterogeneity of MSC populations is informed by Twist1, a potent epithelial-to-mesenchymal transition inducer, based on recent studies indicating that some proportion of marrow resident MSCs derive from the neural crest (Morikawa et al., 2009). Therefore, we quantified TWIST1 levels in nine human donor populations that during log phase growth exhibited significant differences in viability and growth rate as quantified by MTT assay (Fig. 1a) and cell counting (Fig. 1b), respectively. Colony forming unit-fibroblast (CFU-F) activity, a measure of progenitor cell frequency, also varied significantly between these populations. (Fig. 1c). Expressed levels of 20 different markers commonly used to phenotype MSCs did not predict inter-population differences in these activities (Fig. 1d and Table S1). However, normalized TWIST1 mRNA levels, which varied significantly between populations (Fig. 1e), significantly correlated with measures of cell viability (Fig. 1f), cell growth (Fig. 1g) and CFU-F activity (Fig. 1h). The nature of this correlation was robust since a comparison between TWIST1 raw Ct values and cell viability, growth, and CFU-F activity were also significantly correlated (Fig. Fig. S1a–d).
Fig. 1.

TWIST1 levels predict differences in growth rate and CFU-F activity between human MSC donors.
(a) Viability of nine different human MSC donor populations. MSCs were plated at 1000 cells/cm2, cultured for 7 days to ensure log phase growth, and then analyzed by MTT assay. Plotted data are mean ± SD from experiments performed twice with 8 replicates each.
(b) Growth rate of nine different human MSC donor populations. MSCs were cultured as in (a) and total cell number determined by counting. Plotted data are mean ± SD from experiments performed in triplicate.
(c) CFU-F activity of nine different human MSC donor populations. MSCs (100 cells/55 cm2) were plated in triplicate, cultured for 14 days, then the number of CFU-Fs determined by counting. Plotted data are mean ± SD from experiments performed in triplicate.
(d) Expressed levels of the indicated surface epitopes as determined by flow cytometry in nine human MSC donor populations from (a). MSCs harvested at sub confluent density (< 70%) were used for analysis. Plotted data are mean ± SD.
(e) TWIST1/GAPDH mRNA levels as determined by qPCR in nine different human MSC donor populations from (a). Plotted data are mean ± SD from experiments performed in quadruplicate and repeated twice.
(f) Scatter plot between MSC viability data (a) and TWIST1/GAPDH mRNA levels (e) where (r) is the Pearson's product moment correlation coefficient.
(g) Scatter plot between MSC growth data (b) and TWIST1/GAPDH mRNA levels (e) where (r) is the Pearson's product moment correlation coefficient.
(h) Scatter plot between CFU-F data (c) and TWIST1/GAPDH mRNA levels (e) where (r) is the Pearson's product moment correlation coefficient. *p < 0.05, **p < 0.01 as compared to 99L by one-way ANOVA and Tukey post-hoc analysis for (a–c) and (e).
Supplementary Fig. S1.

Related to Fig. 1, Fig. 2. Twist1 effects on human MSC growth, CFU-F activity, and cell cycle.
(a) TWIST1 Ct values as determined by qPCR in nine different human MSC donor populations from Fig. 1. Plotted data are mean ± SD from experiments performed in quadruplicate. *p < 0.05, **p < 0.01 compared to 99L by ANOVA and post-hoc Tukey test.
(b–d) Scatter plots between cell growth (b), cell viability (c) and CFU-F activity (d) vs. TWIST1 Ct values where (r) is the Pearson's product moment correlation coefficient.
(e) Densitometry of immunoblots from Fig. 2i showing changes in cell cycle regulators.
(f) Densitometry of immunoblots from Fig. 2k showing changes in Rasa4 and Erk levels.
To establish a biological relevance for this correlation, we inhibited TWIST1 expression using a small interfering RNA (siRNA) in a representative donor population that expressed intermediate TWIST1 levels (7089L) (Fig. 2a). Quantitative real-time PCR (qPCR) analysis of siRNA-transfected MSCs indicated that TWIST1 mRNA levels remained repressed up to seven days post-transfection (Fig. 2b). As anticipated based on this result, TWIST1 silencing significantly inhibited cell growth and viability as determined by counting (Fig. 2c), MTT assay (Fig. 2d) and flow cytometric analysis of 6-Carboxyfluorescein succinimidyl ester (CSFE)-labeled cells (Fig. 2e). It also significantly reduced CFU-F activity (Fig. 2f) and residual CFU-Fs that did emerge were smaller in size than those from scrambled siRNA transfected cells (not shown). SiRNA targeting of TWIST1 also increased the percentage of senescent (Fig. 2g) and apoptotic cells (Fig. 2h) in populations. TWIST1 inhibition yielded similar biological responses in multiple donor populations (not shown) whereas siRNA targeting of TWIST2 had no significant effect on cell growth, CFU-F activity, senescence or apoptosis (Fig. 2c–h).
Fig. 2.

SiRNA targeting of TWIST1 negatively impacts MSC growth and survival.
(a) Immunoblot analysis of Twist1 levels in native MSCs (Control) or MSCs transfected with a scrambled (Scr) or TWIST1-specific (TWIST1) siRNA. Data are from cell extracts prepared 3 days post-transfection.
(b) Effect of siRNAs on TWIST1/GAPDH mRNA levels at 3 days and 7 days post-transfection as determined by qPCR. Plotted data are mean ± SD from experiments performed in quadruplicate. (c) Effect of siRNAs on MSC proliferation. MSCs were plated at 1000 cells/cm2, cultured for 7 days after siRNA transfection to ensure log phase growth, then cell number was determined by counting. Plotted data are mean ± SD from experiments performed in triplicate and repeated twice.
(d) Effect of siRNAs on MSC viability. MSCs were cultured as in (c) then analyzed by MTT assay. Plotted data are mean ± SD from experiments repeated twice with six replicates each.
(e) Effect of siRNAs on MSC growth as determined by CSFE-labeling. Assays were conducted as described in (c) except that cells were stained with CSFE prior to transfection then analyzed by flow cytometry.
(f) Effect of siRNAs on CFU-F activity. Following siRNA transfection MSCs were plated at 100 cells/55cm2 and cultured for 14 days. Data are mean ± SD from experiments performed in triplicate and repeated once.
(g) Effect of siRNAs on MSC senescence. Following siRNA transfection MSCs were plated at 5000 cells/cm2 and cultured for 3 days prior to staining for senescence associated β-galactosidase activity. Data are mean ± SD from experiments performed in triplicate.
(h) Effect of siRNAs on cellular apoptosis. Following siRNA transfection MSCs were plated at 1000 cells/cm2, cultured for 3 days prior, then stained with Annexin V and propidium iodide (PI) and analyzed by flow cytometry.
(i) Immunoblot analysis of cell cycle regulators in cell lysates from MSCs plated at 1000 cells/cm2 at 3 days post-transfection with the indicated siRNAs.
(j) Effect of siRNAs on cell cycle status. Following siRNA transfection MSCs were plated at 1000 cells/cm2, expanded 3 days then stained with DAPI and analyzed by flow cytometry.
(k) Immunoblot analysis of RASA4 (upper) and total and phosphor-ERK1/2 (lower) in cell extracts prepared from MSCs at 3 days post-transfection with the indicated siRNAs. Control represents non-transfected native cells.
**p < 0.01, #p < 0.005, ++p < 0.0005 as compared to scrambled by Student's t test for (b–d, f, g).
To identify Twist1 targets responsible for these biological effects we performed micro-array analysis, which identified 216 transcripts up regulated and 544 transcripts down regulated by ≥ 2-fold in MSCs following siRNA targeting of TWIST1 (Table S2). Unbiased analysis of the gene expression data, which was deposited in NCBI's GEO repository [GSE76158] revealed that Twist1 targets mapped to critical nodes within multiple gene regulatory networks (Fig. S2) controlling cell surface receptor-linked signal transduction, cell cycle progression, cell division, DNA metabolic processes, DNA replication, DNA repair, and homeostatic processes (Fig. S3). Consistent with these results, siRNA targeting of TWIST1 resulted in increased P21 and decreased P53, Ccnd3, Cdk2 and Cdk4 protein expression (Fig. 2i and Fig. S1e), which manifested in changes in cell cycle progression. For example, populations' transfected with a TWIST1-specific siRNA contained significantly more cells in G1 phase and fewer cells in S phase as compared to scrambled siRNA transfected or non-transfected populations (Fig. 2j). SiRNA targeting of TWIST1 also induced expression of Rasa4 (Fig. 2k and Fig. S1f), and siRNA targeting of RASA4 resulted in increased Cdk2, Cdk4, and Ccnd3 expression (Fig. 2i and Fig. S1e) and elevated Erk1/2 activation (Fig. 2k and Fig. S1f) consistent with its role as an inhibitor of Ras-Mapk signaling. SiRNA targeting of SPRY4, an inhibitor of Fgf-induced Erk signaling that served as a positive control, also increased p-Erk1/2 levels (Fig. 2k and Fig. S1f).
Supplementary Fig. S2.

Related to Fig. 2. Twist1 targets in human MSCs. Interaction networks were created using g:Profiler (http://biit.cs.ut.ee/gprofiler/index.cgi) based on hierarchical sorting using the best parent fit from microarray data gene lists that included 544 genes down regulated by < 2-fold (A) or 216 genes upregulated by > 2-fold (B). Each circle represents a gene, within which is the symbol for that gene, and red circles denote genes whose expression was altered in MSCs transfected with a TWIST1-specific vs. scrambled siRNA.
Supplementary Fig. S3.

Related to Fig. 2. Functional classification of Twist1-modulated genes.
Represented are the top five functional clusters of Twist1 targets identified by DAVID analysis. Automated identification was based on gene ontology terms of biological processes. Proteins in more than one cluster are cross-referenced with color-coded numbers.
3.2. TWIST1 Levels Correlate with Tri-lineage Differentiation Potential and Maintain Cells in an Uncommitted State
To assess effects on multi-potency we quantified TWIST1 levels in five MSC donor populations that exhibited quantitative differences in tri-lineage differentiation (Fig. 3a) and found that normalized expression levels of this mRNA correlated with adipogenic, chondrogenic and osteogenic potential (Fig. 3b). To assess effects at the single cell level, we generated clonally-derived populations and determined their capacity for tri-lineage differentiation by clone splitting (Russell et al., 2010). As shown in Fig. 3c, normalized TWIST1 mRNA levels were significantly higher in clones capable of tri-lineage differentiation as compared to bi-potent clones. As anticipated based on these results, siRNA targeting of TWIST1 significantly induced expression of key regulators of cell differentiation including RUNX2, PPAR-γ, SOX4, BMP4, and GDF15 (Fig. 3d) (Brun, R. P., et al., 1996, Hammarstedt, A., et al., 2013, Kim, I. S., et al., 1999, Komori, T., et al., 1997, Nissen-Meyer, L. S., et al., 2007), and also significantly augmented that ability of cells to undergo tri-lineage differentiation in response to the appropriate stimuli (Fig. 3e). However, siRNA targeting of TWIST1 did not induce spontaneous differentiation in the absence of stimuli (not shown). These findings implicate Twist1 in maintenance of the multi-progenitor state by simultaneously stimulating cell growth and survival and repressing pathways that induce competence to respond to differentiation inducing stimuli.
Fig. 3.

Twist1 confers multi-potency onto MSCs.
(a) Tri-lineage differentiation potential of five MSC donor populations relative to an un-induced control after normalization to total cell number.
(b) Scatter plots of TWIST1/GAPDH mRNA levels vs. chondrogenic, osteogenic and adipogenic potential of MSCs as determined in (a) where (r) is the Pearson's product moment correlation coefficient.
(c) TWIST1/GAPDH mRNA levels as determined by qPCR in tri-potent clones (N = 10) and bi-potent (N = 6) human MSC clones. *p < 0.05 by Student's t test.
(d) Effect of siRNAs on gene expression as determined by qPCR in MSCs. Values were determined using the relative Ct method with GAPDH as an internal control. Following siRNA transfection MSCs were plated at 5000 cells/cm2 and expanded for 3 days. Data are mean ± SD for experiments performed in quadruplicate.
(e) Effect of siRNAs on tri-lineage differentiation in MSCs at 7 days post-induction for adipogenesis and at least 21 days post-induction for osteogenesis and chondrogenesis. Photomicrographs are of monolayers stained with Nile Red (adipogenesis), Alizarin Red S (osteogenesis) or Toluidine blue (chondrogenesis, false color image). *p < 0.05, **p < 0.01, + p < 0.001, ++p < 0.0005 as compared to scrambled by Student's t test for (d, e).
3.3. TWIST1 is a Target of Fgf2 and Confers a Pro-angiogenic Phenotype Onto MSCs
Previous studies have shown that Fgf2 promotes growth and self-renewal of MSCs (Ahn, H. J., et al., 2009, Tsutsumi, S., et al., 2001, Di Maggio, N., et al., 2012). Consistent with these studies, we found that siRNA targeting of TWIST1 induced expression of FGF2, FGFR1, FGFR3 and FGFR4 but suppressed expression of FGFR2IIIc (Fig. 4a) and that culture of MSCs in Fgf2-supplemented media induced Twist1 protein accumulation (Fig. S4a). We further observed a positive correlation between normalized FGFR2IIIc and TWIST1 mRNA levels in different MSC donor populations (Fig. 4b) and although this correlation did not reach statistical significance the correlation between FGFR2IIIc and TWIST1 Ct values was statistically significant (Fig. 4c). Additionally, normalized FGFR2IIIc mRNA levels significantly correlated with CFU-F activity and growth/viability of different MSC donor populations (Fig. 4d) but we failed to detect any correlation between TWIST1, cell growth or CFU-F activity and FGFR1, FGFR3, FGFR4 or AXL expression (not shown). As anticipated based on this result, siRNA targeting of FGFR2IIIc also significantly decrease FGFR2IIIc and TWIST1 expression in MSCs (Fig. 4e) and significantly inhibited cell viability as determined by MTT assay (Fig. 4f). The fact that siRNA targeting of FGFR2IIIc produced similar effects in MSCs as that of TWIST1 indicates that Twist1 is positively regulated by an Fgf2–Fgfr2IIIc signaling axis.
Fig. 4.

Twist1 is a target of Fgf2 and confers a pro-angiogenic phenotype onto MSCs.
(a) Effect of siRNAs on gene expression as determined by qPCR in MSCs at 3 days post-transfection. Values were determined using the relative Ct method with GAPDH as an internal control.
(b) Scatter plot of FGFR2IIIc/GAPDH vs. TWIST1/GAPDH mRNA levels as determined by PCR where (r) is the Pearson's product moment correlation coefficient. Data are from MSC populations in Fig. 1.
(c) Scatter plot of FGFR2IIIc vs. TWIST1 raw Ct values as determined by qPCR where (r) is the Pearson's product moment correlation coefficient. Data are from MSC donor populations in Fig. 1.
(d) Scatter plot of FGFR2IIIc/GAPDH mRNA levels vs. CFU-F activity (left panel) and cell viability (MTT assay, right panel) where (r) is the Pearson's product moment correlation coefficient. Data are from MSC donor populations in Fig. 1.
(e) FGFR2IIIc and TWIST1 mRNA expression levels as determined by qPCR in MSCs transfected with a scrambled (Scr) or Fgfr2IIIc-specific siRNA. Assays were conducted at 3 days post-transfection.
(f) Effect of siRNAs on MSC viability as measured by MTT assay. MSCs were plated at 1000 cells/cm2 and cultured for 7 days after siRNA transfection to ensure log phase growth. Data are mean ± SD from experiments performed in triplicate and repeated twice.
(g) ELISA showing effect of siRNAs or pre-treatment with Fgf2 (20 ng/ml) or IL-6 (10 ng/ml) on secretion of Ccl2 by MSCs. ELISA was performed on fresh media added 48 h following siRNA transfection or 24 h following mitogen pretreatment. Cells were cultured an additional 48 h before quantification of Ccl2.
(h) Growth of HAECs cultured in HAEC growth media alone or a mixture (1:1) of HAEC growth media and conditioned media from native or fixed MSCs or MSCs transfected with siRNAs or pre-treated with Fgf2 (20 ng/ml), IFN-gamma (50 ng/ml) and IL-6 (10 ng/ml). Plotted data are mean ± SD from experiments performed with six replicates.
(i) Effect of MSC conditioned media on HUVEC tube formation. HUVECs plated on matri-gel were cultured in growth media (GM), serum free media (SFM) or conditioned media from native MSCs and MSCs transfected with siRNAs or pre-treated with Fgf2 (20 ng/ml), IFN-gamma (50 ng/ml) and IL-6 (10 ng/ml) for 12 h. Length of endothelial tubules was then determined using image analysis software. Plotted data are mean ± SD from experiments performed with in triplicate.
*p < 0.05, #p < 0.005, + p < 0.001, ++p < 0.0005 as compared to scrambled by Student's t test for (a, e, f). *p < 0.05, **p < 0.01 compared to control (g), No CM (h) and Scrambled siRNA (i) by on one-way ANOVA and post-hoc Tukey test for (g–i). Bars highlight significant differences between experimental groups.
Supplementary Fig. S4.

Related to Fig. 4. Twist1 is induced by Fgf2 in MSCs and regulates angiogenin expression.
(a) Immunoblot analysis of Twist1 in cell extracts from MSCs cultured in 10% serum supplemented with 20 ng/ml Fgf2. Extracts were prepared 24 h after Fgf2 treatment. Bar graph shows analysis of immunoblot by densitometry.
(b) Scatter plot showing effect of a scrambled vs. TWIST1-specific siRNA on expression of angiogenic and angio-static genes in MSCs as determined by microarray analysis.
(c) Twist1 associates with the CCL2 promoter. Histogram of ChIP PCR data showing significant enrichment of Twist1 protein at the CCL2 promoter. An antibody against RNA Pol II was used as a positive control. ++p < 0.0005 compared to Cont Ab based on Student's t test.
(d) Scatter plot showing effect of Fgf2 (20 ng/ml) pre-treatment on expression of angiogenic and angio-static genes in MSCs as determined by microarray analysis.
(e–g) ELISA of IL-6 (e), Ccl2 (f) and IL-8 (g) secretion by MSCs transfected with a scrambled (Scr) or TWIST1-specific (TWIST1) siRNA and cultured with or without Fgf2 (20 ng/ml). At 3 days post-transfection where indicated cells were treated for 24 h with Fgf2, washed extensively, and red serum free media. Conditioned media collected 24 h later were analyzed by ELISA. Plotted data are mean ± SD from experiments performed in triplicate. *p < 0.05, **p < 0.01, #p < 0.005 compared to scrambled by Student's t test.
Through a process that involves vascular remodeling, MSCs are capable of generating ectopically a miniature bone organ that contains hematopoiesis-competent sinusoids (Friedenstein, A. J., et al., 1968, Sacchetti, B., et al., 2007). Since Twist1 is also implicated in regulating vascularization during development and tumorigenesis (Rodrigues, C. O., et al., 2008, Hu, L., et al., 2008) we questioned if this protein confers a pro-angiogenic phenotype. Interrogation of our micro-array data revealed that siRNA targeting of TWIST1 repressed expression of the pro-angiogenins CLC2, CXCL12, FGF5, VEGFC and CYR61 and induced mRNAs encoding proteins with angio-static activity, such as TIMPs 1–4, ADAMTS2 and CTGF (Fig. S4b). This result is consistent with a previous study demonstrating that Twist1 induces Ccl2 expression in mammary epithelial cells although the mechanism responsible for this effect has not been explored (Li et al., 2003). A bioinformatics searched identified several consensus E-box motifs in the Ccl2 promoter (Table S3) and we confirmed by ChIP that Twist1 was associated with this promoter (Fig. Fig. S4c). Our micro-array data further demonstrated that treatment of MSCs with Fgf2 induced expression of the pro-angiogenins VEGFC, CYR61 and FGF5 and inhibited expression of TIMP1, TIMP2 and CTGF, which block angiogenesis (Fig. S4d). Enzyme-linked immunosorbent assay (ELISA) confirmed that siRNA targeting of TWIST1 and FGFR2IIIc inhibited whereas pre-treatment with Fgf2 stimulated Ccl2 secretion from MSCs (Fig. 4g). Next, we collected conditioned media from native MSCs or MSCs pre-treated with Fgf2 and IL-6 or transfected with a TWIST1-specific and scrambled siRNA, then assayed its ability to support the growth of primary human aortic endothelial cells (HAECs). As shown in Fig. 4h, conditioned media from native MSCs pre-treated with or without IL6 yielded significant increases in HEAC survival as compared to that from fixed MSCs or the cell free control. Moreover, conditioned media from Fgf2 pre-treated MSCs was superior to that of native MSCs in supporting HAEC survival whereas that from MSCs transfected with a TWIST1-specific siRNA or pre-treated with IFN-gamma offered no significant benefit as compared to the cell free control. We also assayed the ability of MSC conditioned media to support tube formation by human umbilical vein endothelial cells (HUVECS) using serum free media (SFM) or growth factor supplemented media (GM) as negative and positive controls, respectively. As shown in Fig. 4i, conditioned media from native MSCs and MSCs transfected with a scrambled siRNA or pre-treated with IL6 were not as effective as GM in supporting tube formation but were significantly better than SFM. Moreover, tube formation was significant greater in conditioned media from Fgf2 pre-treated MSCs and significantly less from TWIST1 siRNA transfected or IFN-gamma pre-treated cells as compared to native MSCs. Collectively, these studies demonstrate that Fgf2 induces a pro-angiogenic phenotype onto MSCs via a Twist1-dependent mechanism.
3.4. TWIST1 Regulates Cytokine and Immuno-modulatory Effector Protein Expression and is a Target of IFN-Gamma
MSCs also exhibit potent anti-inflammatory and immuno-modulatory activities but a role for Twist1 in these processes has not been described. We found that siRNA targeting of TWIST1 significantly induced expression of IL1-α, IL1-β, IL1RN, IL18, TNF and TSG6 but inhibited expression of IL6 (Fig. 5a), consistent with its ability to represses NF-kB activity by binding to RelA (Sosic et al., 2003). However, multi-plex ELISA of MSC conditioned media failed to detect IL-1α, IL-1β, and Tnf indicating that native MSCs do not secrete these pro-inflammatory cytokines. We did detect secreted levels of Il1rn, IL-6 and IL-8. Moreover, siRNA targeting of TWIST1 significantly increased Il1rn and inhibited IL-6 secretion, whereas culture of MSCs in Fgf2 significantly enhanced secretion of all three cytokines (Fig. 5b). Fgf2-mediated increases in IL-6 likely result from increased Twist1 expression since this effect was abolished following siRNA targeting of this gene (Fig. S4e). SiRNA targeting of TWIST1 also abolished Fgf2-induced increases in secretion of Ccl2 (Fig. S4f) consistent with our ChIP data but not that of IL-8 (Fig. S4g). The latter likely results from increased activator protein 1 (AP1) activity since this protein is a target of Fgf2 and stimulates IL-8 transcription (Li et al., 2003).
Fig. 5.

Twist1 modulates cytokine and immuno-modulatory effector protein expression in MSCs.
(a) Effect of siRNAs on gene expression as determined by qPCR in MSCs at 3 days post-transfection. Values were determined by the relative Ct methods using GAPDH as an internal control. Plotted data are mean ± SD from experiments performed in quadruplicate.
(b) Luminex assay showing levels of the indicated cytokines in MSC conditioned media. Plotted data are mean ± SD from experiments performed in triplicate.
(c) Effect of siRNAs on gene expression as determined by qPCR in MSCs at 3 days post-transfection. Plotted data are mean ± SD from experiments performed in quadruplicate.
(d) Effect of siRNAs on Pge2 secretion in MSCs. Plotted data are mean ± SD normalized to total cell number.
(e) Immunoblot assay and corresponding density plot showing effect of siRNAs on Ido1 expression in cell extracts prepared from MSCs at 3 days post-transfection.
(f) ChIP analysis showing pull down of IDO1 promoter sequences using a Twist1 or Pol II (positive control) antibody from cell extracts prepared from MSCs.
(g) Immunoblot analysis of Ido1 and Twist1 levels in cell extracts from MSCs at 24 h post-treatment with IFN-gamma (50 ng/ml) or IL-6 (10 ng/ml).
(h) TWIST1/GAPDH mRNA levels as determined by qPCR in MSCs transduced with an empty retroviral vector or one encoding a full length TWIST1 cDNA (left). Insert represents immunoblot analysis of Twist1 in cell extracts prepared from transfected MSCs. IDO1/GAPDH mRNA levels as determined by qPCR in transduced MSCs at 24 h post-treatment with IFN-gamma (50 ng/ml) (right panel). Plotted data are mean ± SD of experiments performed in triplicate.
(i) Effect of Fgf2 (20 ng/ml), IFN-gamma (50 ng/ml), and IL-6 (10 ng/ml) pre-treatment on MSC growth quantified by flow cytometric analysis of CSFE-stained cells. Plotted data are mean ± SD.
(j) Effect of Fgf2 (20 ng/ml), IFN-gamma (50 ng/ml), and IL-6 (10 ng/ml) pre-treatment on CFU-F activity. Graph illustrates all quantified CFU-Fs and those > 10 mm in diameter after 14 days of culture. Plotted data are mean ± SD of experiments repeated twice and performed in triplicate. **p < 0.01 compared to Fgf2 treatment group by one-way ANOVA and post-hoc Tukey test.
(k) Immunoblot analysis of Rpl23a, Ccnd3, Cdk2, and Cdk4 in cell extracts from MSCs (Cont) or MSCs pre-treated for 24 h with Fgf2 (20 ng/ml), IFN-gamma (50 ng/ml) and IL-6 (10 ng/ml).
(l) Effect of IFN-gamma (50 ng/ml) and the Ido1 inhibitor CAY10581 (100 nM) on MSC viability as determined by MTT assay at 24 h post-treatment. Plotted data are mean ± SD of experiments performed in quadruplicate.
*p < 0.05, **p < 0.01, #p < 0.005, + p < 0.001, ++p < 0.0005 compared to scrambled (a–d), CCM (b, i), Cont Ab (f), vector (h), and DMSO (l) by Student's t test.
We also found that transcripts encoding proteins that contribute to the immuno-modulatory activity of MSCs including indoleamine 2, 3-dioxygenase (Ido1), heme oxygenase 1 (Hmox1), prostaglandin-endoperoxidase synthase 2 (Ptgs2/Cox2), prostaglandin E synthase (Ptges) and colony stimulating factor 1 (Csf1) were also induced following siRNA targeting of TWIST1 (Fig. 5c). Consistent with these results, MSCs transfected with a TWIST1-specific vs. scrambled siRNA secreted significantly higher levels of prostaglandin-E2 (Pge2) (Fig. 5d) and expressed higher levels of Ido1 protein (Fig. 5e). Interrogation of the IDO1 promoter revealed several consensus E-box motifs (Table S3) and ChIP analysis confirmed that Twist1 associated with this promoter (Fig. 5f). Therefore, Twist1 activates CCL2 and represses IDO1 transcription. Difference in Twist1 activity at these promoters is likely influenced by distinct basic region DNA conformations and choice of protein dimerization partners (Kophengnavong et al., 2000). We did not detect binding of Twist1 to the HMOX1 promoter, which lacked E-box motifs, indicating that Twist1 regulates HMOX1 expression indirectly (not shown).
IFN-gamma strongly induces Ido1 in MSCs wherein it functions as a T-cell inhibitory effector pathway (Meisel, R., et al., 2004, Krampera, M., et al., 2006). Therefore, we questioned if IFN-gamma modulates Ido1 expression via Twist1. Western blot confirmed that pre-treatment of MSCs for 24 h with IFN-gamma strongly repressed Twist1 and induced Ido1 expression whereas treatment with IL-6 had little effect on either protein (Fig. 5g). Consistent with these results, the ability of IFN-gamma to induce IDO1 expression was significantly inhibited in MSCs engineered to over express Twist1 by retroviral transduction (Fig. 5h). Moreover, IFN-gamma pre-treatment repressed TWIST1 expression but significantly induced that of PTGS, PTGES, and IL1RN (Fig. S5a). It also suppressed MSC growth (Fig. 5i and Fig. S5b), CFU-F activity (Fig. 5j) and Rpl23a, Cdk2 and Cdk4 expression (Fig. 5k) thereby mimicking effects seen following siRNA targeting of TWIST1. Growth inhibition by IFN-gamma was abrogated in MSCs treated with the Ido1 inhibitor CAY10581 and therefore was dependent upon induced Ido1 activity (Fig. 5l). MSCs treated with IFN-gamma also exhibited significantly reduced angiogenic activity (Fig. 4h and i) while MSCs cultured in Fgf2 exhibited enhanced growth, CFU-F activity, and increased expression of Ccnd3, Cdk2 and Cdk4 (Fig. 5i–k).
Supplementary Fig. S5.

Related to Figs. 5 and 6. Effect of IFN-gamma on gene expression and adipogenic and osteogenic differentiation of MSCs, and role of Ido1 in MSC immuno-suppressive activity.
(a) Effect of IFN-gamma (50 ng/ml) pre-treatment of MSCs on expression of the indicated genes as determined qPCR. Gene expression levels were determined at 24 h post-treatment and normalized to GAPDH using the relative Ct method. Plotted data are mean ± SD of experiments run in quadruplicate. *p < 0.05, #p < 0.005 compared to CCM by Student's t test.
(b) Gating strategy used to determine the percentage of CSFE low cells for data presented in Fig. 5i.
(c, d) MSCs were pre-treated with Fgf2 (20 ng/ml), IFN-gamma (50 ng/ml), or IL-6 (10 ng/ml) and then stimulated to undergo adipogenic (b) or osteogenic differentiation (c) over a 7 day time course. The extent of cellular differentiation was determined by staining the cell monolayers, extracting the stain, and then normalizing the extent of staining to the total number of cells in each culture. Representative photomicrographs of monolayers stained with Adipo Red S (b) or Alizarin Red S (c) prior to extraction illustrate the extent of cellular differentiation. Plotted data are mean ± SD for experiments done in triplicate. #p < 0.005, ++p < 0.0001 compared to control cultures not induced to undergo stimulus driven differentiation by Student's t test.
(e) Mixed lymphocyte reaction showing MSC-mediated suppression of CD3+ T cell proliferation. PBMNCs were stimulated with anti-CD3 and anti-CD28 antibodies then continuously cultured for 4 days in the absence or presence of siRNA-transfected or IFN-gamma (50 ng/ml) pre-treated MSCs. Fixed MSCs and PBMNCs cultured without MSCs (No MSCs) were used as controls. Bar graph illustrates the ratio of Ki67+/Ki67− CD3+ T cells under each condition. The suppressive effect of TWIST1 siRNA transfected or IFN-gamma treated MSCs was largely abrogated when assays were carried out in the presence of the Ido1 inhibitor CAY10581 (100 nM). Plotted data are mean ± SD of experiments run in triplicate. **p < 0.01 by one-way ANOVA and post-hoc Tukey test. Bars represent significant differences between experimental groups.
IFN-gamma and Fgf2 also produced disparate effects on stimulus driven cellular differentiation, which reflects their broader effects on cell signaling pathways and gene expression as compared to Twist1 inhibition alone. For example, IFN-gamma pre-treatment augmented adipogenic and suppressed osteogenic differentiation in response to the appropriate stimuli to significant extents as reported previously (Liu, Y., et al., 2011, Vidal, C., et al., 2012) while Fgf2 pre-treatment inhibited adipogenic differentiation and resulted in a slight increase in matrix mineralization over a time course of osteogenic differentiation (Fig. S5c and d). The latter is consistent with studies indicating that Fgf2 lowers the phosphate threshold for mineralization by directly inducing expression of the calcium binding proteins bone sialoprotein and osteocalcin (Shimizu-Sasaki, E., et al., 2001, Nauman, E. A., et al., 2003, Xiao, G., et al., 2002).
3.5. Perturbation of TWIST1 Levels Yields Predictable Changes in the Therapeutic Efficacy of MSC in Cell-based Assays and In Vivo
We next determined whether perturbation of Twist1 levels altered the ability of MSCs to suppress proliferation of CD3+ T cells following antibody-mediated activation in a mixed lymphocyte reaction in vitro. Addition of fixed or native MSCs significantly stimulated and repressed, respectively, CD3+ T cell proliferation as compared to cultures containing no MSCs (Fig. 6a). Moreover, MSCs transfected with a TWIST1-specific siRNA suppressed T cell proliferation to a significantly greater extent than compared to native or scrambled siRNA transfected cells, and IFN-gamma pre-treated cells inhibited T cell proliferation to an even greater extent than those transfected with a TWIST1-specific siRNA. In separate experiments we showed that MSC mediated inhibition of T cell proliferation following siRNA targeting of TWIST1 or IFN-gamma pre-treatment was largely reversed by the Ido1 inhibitor CAY10581 (Fig. S5e). In contrast, MSCs pre-treated with Fgf2 or IL-6 were no more effective in suppressing T cell proliferation as compared to native MSCs. Next we employed multiplex bead arrays to quantify changes in Th1, Th2, and Th17 cytokine secretion by peripheral blood mononuclear cells (PBMNCs) in these mixed lymphocyte reactions. As shown in Fig. 6b, native MSCs suppressed Tnf and IL-4 and stimulated IL-17A and IL-10 secretion. These changes are reminiscent of those that occur during transition from an acute to chronic inflammatory state (Lawrence and Gilroy, 2007) and may explain why MSCs are therapeutically efficacious in models of acute tissue injury. Alternatively, MSCs pre-treated with IFN-gamma or transfected with a TWIST1-specific siRNA inhibited expression of Th1 cytokines, did not induce IL-17A, and stimulated IL-4 and IL-10 secretion to varying degrees, which is consistent with a Th2 response. Importantly, flow cytometric analysis indicated that siRNA targeting of TWIST1 did not significantly alter the expression of co-stimulatory molecules on MSCs (Table S4). Therefore, down regulation of Twist1 enhances immuno-suppressive activity without affecting the immunogenicity of MSCs.
Fig. 6.

Twist1 levels predict MSC potency in vitro and in vivo.
(a) Dot plots of flow cytometric data showing the proportion of CD3 and Ki67 expressing PBMNCs in mixed lymphocyte reactions. PBMNCs were stimulated with anti-CD3 and anti-CD28 antibodies then continuously cultured for 5 days in the absence or presence of siRNA-transfected or Fgf2 (20 ng/ml), IFN-gamma (50 ng/ml) and IL-6 (10 ng/ml) pre-treated MSCs. Fixed MSCs and PBMNCs cultured without MSCs (cell free) were used as controls. Bar graph illustrates the ratio of Ki67+/Ki67− CD3+ T cells under each condition. **p < 0.01 as compared to scrambled by one-way ANOVA and post-hoc Tukey test. Bars represent significant differences between experimental groups.
(b) Cytometric bead array showing secreted levels of Th1, Th2, and Th17 cytokines by PBMNCs in mixed lymphocyte reactions from (a). *p < 0.05, **p < 0.01 vs. control; + p < 0.05, ++p < 0.01 Fgf2 vs. TWIST1 siRNA, IFN-gamma, and IL-6; #p < 0.05, ##p < 0.01 TWIST1 siRNA vs. IFN-gamma by one-way ANOVA and post-hoc Tukey test.
(c) Change in body weight (%) in mice at 7 days post-treatment for each indicated experimental group (N = 6–10 mice per group repeated twice). BLM, bleomycin.
(d) Total cell counts in BAL at 7 days post-treatment from animals in (c). BLM, bleomycin.
(e) IL6 expression levels as determined by qPCR in lung parenchyma from animals in (c) at 7 days post-treatment. BLM, bleomycin.
(f) TWIST1/GAPDH mRNA levels as determined by q PCR in MSC donor populations 7075L and 7089L. *p < 0.05 by Student's t test.
(g) Change in body weight (%) at 7 days post-treatment for each indicated experimental group (N = 6–10, repeated twice). BLM, bleomycin.
(h) Total cell counts in BAL at 7 days post-treatment for animals in (g). BLM, bleomycin. *p < 0.05, **p < 0.01 vs. saline based on one-way ANOVA and post-hoc Tukey–Kramer test for (c–e, g, h). Bars indicate significant differences between treatment groups.
To ascertain whether perturbation of Twist1 levels alters MSC potency in vivo, we employed a bleomycin (BLM)-induced acute lung injury model based on published studies showing MSCs are highly protective in this model (Ortiz, L. A., et al., 2003, Ortiz, L. A., et al., 2007). This model employs immuno-deficient mice as a means to accommodate human MSC xenografts and therefore evaluates effects on innate immune cell function and inflammation but not adaptive immunity. Herein, intra-tracheal administration of bleomycin induced significant weight loss in mice by 7 days post-treatment as compared to saline treated controls (Fig. 6c), which correlated with a significant increase in the number of infiltrating monocytes and neutrophils in bronchoalveolar lavage (BAL) (Fig. 6d) and significantly elevated IL-6 gene expression in lung parenchyma, which serve as indicators of lung inflammation (O'Mahony et al., 2012) (Fig. 6e). Alternatively, animals infused with naïve MSCs (7089L) at the time of lung injury exhibited only modest weight loss as compared to bleomycin treated animals, which reflected reduced airway inflammation based on significantly lower BAL cell counts and reduced IL-6 expression, while the same MSCs pre-treated with Fgf2 afforded no protection against the injurious effects of bleomycin (Fig. 6c–e). Next, we compared the potency of 7089L to that of 7075L, which expressed significantly higher levels of TWIST1 (Fig. 6f). As anticipated, MSCs from donor 7075L were significantly less effective in protecting mice against bleomycin-induced injury based on the extent of weight loss by 7 days post-treatment (Fig. 6g) and the cellularity of BAL (Fig. 6h). Lastly, we asked whether the potency of donor 7089L could be improved by transfecting cells with a TWIST1-specific siRNA prior to infusion into animals. The transfected cells did not afford significantly enhanced protection to mice based on body weight assessment or BAL cell count but in some cases were more potent in suppressing cytokine gene activation in lung tissue (not shown). Although we did not evaluate the effect of IFN-gamma treated MSCs in this model since it employed immuno-deficient mice, other groups have established that IFN-gamma priming augments the immuno-modulatory activity of MSCs in vivo (Sivanathan et al., 2014), which our data indicate occurs, in part, by repression of Twist1 expression.
4. Discussion
Results presented herein reconcile several critical aspects of MSC biology that existing paradigms have not resolved. For example, our findings establish a direct mechanistic link between stem/progenitor and effector functions in MSCs, which according to current dogma are unrelated. They also extend in a meaningful way the known functions of Twist1, which despite its important role in tumorigenesis is understudied in MSCs. For example, Twist1 has been reported to suppress osteo/chondro differentiation, stimulate adipogenesis, and inhibit cellular senescence via Ezh2-mediated suppression of p16 (Isenmann, S., et al., 2009, Hemming, S., et al., 2013, Cakouros, D., et al., 2012) in MSCs. Our studies indicate that Twist1 is indispensable for MSC maintenance as siRNA targeting of this transcript alters multiple pathways affecting cell growth, replication, survival, multi-potency, and paracrine signaling. Previous groups have interrogated Twist1 function by over expressing the protein in MSCs, which may explain differences between previously published studies and those reported here. Our data also indicate that acquisition by MSCs of different functional traits can be modeled at the population level by a hierarchical process (see Graphic Abstract). For example, we provide evidence that high Twist1 expressing cells are characterized by rapid growth, high CFU-F activity, a low intrinsic level of apoptosis and a pro-angiogenic phenotype, which is consistent with the characterization of naïve MSCs as marrow resident pericytes (Crisan et al., 2008). We further demonstrate that Twist1 down regulation confers onto cells anti-inflammatory and immuno-modulatory activities at the expense of angiogenic activity, and also induces competence to undergo stimulus driven tri-lineage differentiation. These findings expand in a meaningful way the hierarchy of MSC lineage determination proposed by Caplan (1994) and confirmed by others (Muraglia, A., et al., 2000, Sarugaser, R., et al., 2009, Russell, K. C., et al., 2010, Lee, C. C., et al., 2010) by superimposing onto it various effector functions that confer therapeutic potency onto MSCs. Consequently, this revised hierarchy provides a unifying framework to model the functional complexity of populations, predict differences in the therapeutic efficacy between donors, and understand how responses to extrinsic factors alter cell fate and function.
Although hypothesis driven studies that link progenitor and effector functions are lacking, a careful review of the literature provides an implicit link between these processes. For example, most studies that pre-condition MSCs with Fgf2 or Vegf to enhance their angiogenic potential report positive effects on cell growth, survival, and CFU-F activity while studies that employ pre-conditioning to enhance immuno-modulatory activity are devoid of such claims (unpublished data). Moreover, studies have shown that differentiation of MSCs to the osteoblast lineage results in a concomitant up regulation of IFN-gamma-inducible genes (Duque et al., 2009) and activation of the kynurenine pathway (Vidal et al., 2015) while impairing angiogenic activity (Hoch et al., 2012). Our studies advance these findings in a meaningful way by providing a direct mechanistic link between these processes.
Our findings also have important implications with respect to the clinical application of MSCs. For example, Fgf2 supplementation is frequently used to drive MSC expansion to enhance cell yields for clinical therapies but our data indicate this enriches for populations with a pro-angiogenic phenotype. This result predicts such cells are ill suited for treating conditions wherein angiogenesis is detrimental, such as joint repair, or acute and chronic inflammatory conditions as demonstrated herein for bleomycin-induced lung injury. In the latter case, our data suggest that naïve or Fgf2-pretreated MSCs are not “pro-inflammatory” since they do not secrete detectable levels of IL-1α, IL-1β and Tnf. Moreover, we are unaware of any studies that suggest administration of these cells in vivo induces an acute inflammatory response. Alternatively, our data suggest these cells are less potently anti-inflammatory due to elevated expression levels of the angiogenins IL-6, IL-8, and Ccl2, which also exhibit potent chemotactic activity for leukocytes and neutrophils, and lower expression of anti-inflammatory mediators, such as Il1rn. Owing to the fact that Hif-1-alpha is a potent inducer of Twist1 (Yang et al., 2008) our data also provide mechanistic insight into how hypoxic preconditioning potentiates the angiogenic activity of MSCs.
Similarly, our data also provides mechanistic insight into how IFN-gamma licenses the anti-inflammatory and immuno-modulatory activities of MSCs by identifying Twist1 as a target of IFN-gamma action and linking Twist1 down regulation with elevated expression of Ido1, Il1rn, and HMOX1, increased secretion of Pge2, and reduced IL-6 secretion. Importantly, IFN-gamma-mediated Twist1 down regulation also impedes MSC growth and CFU-F activity and enhances cellular senescence and apoptosis. This is consistent with the fact that interferons are known to exhibit growth repressive effects by inhibiting expression of Rpl23a (Jiang et al., 1997), which is also a Twist1 target in MSCs. Indeed, recent studies indicate that IFN-gamma potentiates inflammatory activation of macrophages by translational suppression of repressors of inflammation such as Hes1, a basic helix–loop–helix protein, and down regulation of mTorc1 via Ido1-mediated tryptophan depletion (Su et al., 2015). Similarly, our studies indicate that IFN-gamma-mediated induction of Ido1 in MSCs, which confer immuno-suppressive properties onto cells, occurs via inhibition of Twist1. Whether the latter results from specific translational suppression of this protein or post-translational modifications that affect its stability and/or function are unknown. Nevertheless, careful consideration should be given to how culture supplements and/or pre-conditioning regimens alter the cellular composition of MSC populations and their therapeutic efficacy via effects on Twist1 expression. To facilitate this process, we have developed a CLinical Indications Prediction (CLIP) scale (Fig. 7), which can be used to inform clinical trials by determining the suitability of a given MSC donor population for a specific disease indication and/or to develop improved manufacturing strategies to develop disease-specific cell therapy products.
Fig. 7.

Clinical Indication Prediction (CLIP) scale. Illustrated is a scale that predicts the therapeutic efficacy of a given MSC donor population based on TWIST1 expression levels. MSC donor populations expressing high TWIST1 levels are predicted to be beneficial in treating diseases where angiogenesis is warranted, such as stroke and limb ischemia. In contrast, low TWIST1 expressing populations are predicted to be beneficial in treating inflammatory and immune-related disorders, such as acute tissue or organ injury and graft vs. host disease. Importantly, the therapeutic efficacy of the population can also be altered by manipulating TWIST1 levels through genetic manipulation or exposure of cells to Fgf2 and IFN-gamma. However, these manipulations also significantly impact cell growth, survival and differentiation potential.
In summary, our data suggest that intrinsic differences in TWIST1 levels induce cell fate changes that simultaneously alter the progenitor and effector properties of MSCs in a predictable manner. Therefore, an important area of future study will be to determine the extent by which stochastic and deterministic processes regulate TWIST1 expression at the cellular level to impart heterogeneity. Genomics-based studies conducted in Drosophila have determined that Twist modulates transcriptional regulatory networks with complex logical outputs by binding to over 2000 cis-regulatory elements (Sandmann, T., et al., 2007, Ozdemir, A., et al., 2011). Twist1 targets identified in MSCs also map to critical nodes within multiple gene regulatory networks, which explains in part how changes in its expression reliably predicts donor-to-donor differences in the biological properties of MSC populations. However, the finer points of Twist1 action in MSCs, such as how it represses Ido1 and stimulates Ccl2 transcription by direct promoter binding, remain a fertile area of study. Further scrutiny of Twist1 regulated pathways, protein binding partners, and targets of direct transcriptional regulation will provide additional insight into the mechanisms that drive population heterogeneity, which directly impact therapeutic efficacy, and also reveal other Twist1 surrogates, such as Fgfr2IIIc, that can be used to screen populations pre- and post-manufacturing to determine their suitability for treating a specific disease indication in human patients.
The following are the supplementary data related to this article.
Supplementary material.
Related to Fig. 2. Transcripts up or down regulated by > 2-fold as determined by micro-array analysis of MSCs following siRNA targeting of TWIST1.
Disclosures
The authors report no competing financial interests and no materials used in this study were obtained from external parties under a material transfer agreement.
Author Contributions
Conceptualization, S.V.B. and D.G.P.; Investigation, S.V.B., V.K., C.L.H. and L.A.O.; Validation, S.V.B., V.K., and C.L.H.; Formal analysis, S.V.B., V. K., and D.G.P.; Writing — Original Draft, S.V.B. and D.G.P.; Writing — Review and Editing, S.V.B., L.A.O., and D.G.P.; Supervision, D.G.P.; Funding acquisition, D.G.P.
Acknowledgments
The authors thank Dr. Mark Sundrud for assistance with immunological assays. This work was supported by a grant from the National Institutes of Health to D.G.P. (R24 OD018254) and L.A.O. (R01 HL110344, R01 HL114795). S.V.B. was supported by a Presidential Fellowship from TSRI.
References
- Ahn H.J., Lee W.J., Kwack K., Kwon Y.D. FGF2 stimulates the proliferation of human mesenchymal stem cells through the transient activation of JNK signaling. FEBS Lett. 2009;583:2922–2926. doi: 10.1016/j.febslet.2009.07.056. [DOI] [PubMed] [Google Scholar]
- Bernardo M.E., Fibbe W.E. Mesenchymal stromal cells: sensors and switchers of inflammation. Cell Stem Cell. 2013;13:392–402. doi: 10.1016/j.stem.2013.09.006. [DOI] [PubMed] [Google Scholar]
- Brun R.P., Tontonoz P., Forman B.M., Ellis R., Chen J., Evans R.M., Spiegelman B.M. Differential activation of adipogenesis by multiple PPAR isoforms. Genes Dev. 1996;10:974–984. doi: 10.1101/gad.10.8.974. [DOI] [PubMed] [Google Scholar]
- Cakouros D., Isenmann S., Cooper L., Zannettino A., Anderson P., Glackin C., Gronthos S. Twist-1 induces Ezh2 recruitment regulating histone methylation along the Ink4A/Arf locus in mesenchymal stem cells. Mol. Cell. Biol. 2012;32:1433–1441. doi: 10.1128/MCB.06315-11. [DOI] [PMC free article] [PubMed] [Google Scholar]
- Caplan A.I. The mesengenic process. Clin. Plast. Surg. 1994;21:429–435. [PubMed] [Google Scholar]
- Caplan A.I., Correa D. The MSC: an injury drugstore. Cell Stem Cell. 2011;9:11–15. doi: 10.1016/j.stem.2011.06.008. [DOI] [PMC free article] [PubMed] [Google Scholar]
- Crisan M., Yap S., Casteilla L., Chen C.W., Corselli M., Park T.S., Andriolo G., Sun B., Zheng B., Zhang L., Norotte C., Teng P.N., Traas J., Schugar R., Deasy B.M., Badylak S., Buhring H.J., Giacobino J.P., Lazzari L., Huard J., Peault B. A perivascular origin for mesenchymal stem cells in multiple human organs. Cell Stem Cell. 2008;3:301–313. doi: 10.1016/j.stem.2008.07.003. [DOI] [PubMed] [Google Scholar]
- Di Maggio N., Mehrkens A., Papadimitropoulos A., Schaeren S., Heberer M., Banfi A., Martin I. Fibroblast growth factor-2 maintains a niche-dependent population of self-renewing highly potent non-adherent mesenchymal progenitors through FGFR2c. Stem Cells. 2012;30:1455–1464. doi: 10.1002/stem.1106. [DOI] [PubMed] [Google Scholar]
- Duque G., Huang D.C., Macoritto M., Rivas D., Yang X.F., Ste-Marie L.G., Kremer R. Autocrine regulation of interferon gamma in mesenchymal stem cells plays a role in early osteoblastogenesis. Stem Cells. 2009;27:550–558. doi: 10.1634/stemcells.2008-0886. [DOI] [PubMed] [Google Scholar]
- Friedenstein A.J., Petrakova K.V., Kurolesova A.I., Frolova G.P. Heterotopic of bone marrow. Analysis of precursor cells for osteogenic and hematopoietic tissues. Transplantation. 1968;6:230–247. [PubMed] [Google Scholar]
- Hammarstedt A., Hedjazifar S., Jenndahl L., Gogg S., Grunberg J., Gustafson B., Klimcakova E., Stich V., Langin D., Laakso M., Smith U. WISP2 regulates preadipocyte commitment and PPARgamma activation by BMP4. Proc. Natl. Acad. Sci. U. S. A. 2013;110:2563–2568. doi: 10.1073/pnas.1211255110. [DOI] [PMC free article] [PubMed] [Google Scholar]
- Hemming S., Cakouros D., Isenmann S., Cooper L., Menicanin D., Zannettino A., Gronthos S. EZH2 and KDM6A act as an Epigenetic Switch to Regulate Mesenchymal Stem Cell Lineage Specification. Stem Cells. 2013 doi: 10.1002/stem.1573. [DOI] [PubMed] [Google Scholar]
- Hoch A.I., Binder B.Y., Genetos D.C., Leach J.K. Differentiation-dependent secretion of proangiogenic factors by mesenchymal stem cells. PLoS One. 2012;7 doi: 10.1371/journal.pone.0035579. [DOI] [PMC free article] [PubMed] [Google Scholar]
- Hu L., Roth J.M., Brooks P., Ibrahim S., Karpatkin S. Twist is required for thrombin-induced tumor angiogenesis and growth. Cancer Res. 2008;68:4296–4302. doi: 10.1158/0008-5472.CAN-08-0067. [DOI] [PubMed] [Google Scholar]
- Isenmann S., Arthur A., Zannettino A.C., Turner J.L., Shi S., Glackin C.A., Gronthos S. TWIST family of basic helix–loop–helix transcription factors mediate human mesenchymal stem cell growth and commitment. Stem Cells. 2009;27:2457–2468. doi: 10.1002/stem.181. [DOI] [PubMed] [Google Scholar]
- Jiang H., Lin J.J., Tao J., Fisher P.B. Suppression of human ribosomal protein L23A expression during cell growth inhibition by interferon-beta. Oncogene. 1997;14:473–480. doi: 10.1038/sj.onc.1200858. [DOI] [PubMed] [Google Scholar]
- Kim I.S., Otto F., Zabel B., Mundlos S. Regulation of chondrocyte differentiation by Cbfa1. Mech. Dev. 1999;80:159–170. doi: 10.1016/s0925-4773(98)00210-x. [DOI] [PubMed] [Google Scholar]
- Komori T., Yagi H., Nomura S., Yamaguchi A., Sasaki K., Deguchi K., Shimizu Y., Bronson R.T., Gao Y.H., Inada M., Sato M., Okamoto R., Kitamura Y., Yoshiki S., Kishimoto T. Targeted disruption of Cbfa1 results in a complete lack of bone formation owing to maturational arrest of osteoblasts. Cell. 1997;89:755–764. doi: 10.1016/s0092-8674(00)80258-5. [DOI] [PubMed] [Google Scholar]
- Kophengnavong T., Michnowicz J.E., Blackwell T.K. Establishment of distinct MyoD, E2A, and twist DNA binding specificities by different basic region-DNA conformations. Mol. Cell. Biol. 2000;20:261–272. doi: 10.1128/mcb.20.1.261-272.2000. [DOI] [PMC free article] [PubMed] [Google Scholar]
- Krampera M., Cosmi L., Angeli R., Pasini A., Liotta F., Andreini A., Santarlasci V., Mazzinghi B., Pizzolo G., Vinante F., Romagnani P., Maggi E., Romagnani S., Annunziato F. Role for interferon-gamma in the immunomodulatory activity of human bone marrow mesenchymal stem cells. Stem Cells. 2006;24:386–398. doi: 10.1634/stemcells.2005-0008. [DOI] [PubMed] [Google Scholar]
- Lawrence T., Gilroy D.W. Chronic inflammation: a failure of resolution? Int. J. Exp. Pathol. 2007;88:85–94. doi: 10.1111/j.1365-2613.2006.00507.x. [DOI] [PMC free article] [PubMed] [Google Scholar]
- Lee C.C., Christensen J.E., Yoder M.C., Tarantal A.F. Clonal analysis and hierarchy of human bone marrow mesenchymal stem and progenitor cells. Exp. Hematol. 2010;38:46–54. doi: 10.1016/j.exphem.2009.11.001. [DOI] [PMC free article] [PubMed] [Google Scholar]
- Li L.F., Ouyang B., Choukroun G., Matyal R., Mascarenhas M., Jafari B., Bonventre J.V., Force T., Quinn D.A. Stretch-induced IL-8 depends on c-Jun NH2-terminal and nuclear factor-kappaB-inducing kinases. Am. J. Physiol. Lung Cell Mol. Physiol. 2003;285:L464–L475. doi: 10.1152/ajplung.00031.2003. [DOI] [PubMed] [Google Scholar]
- Lin Y., Hogan W.J. Clinical application of mesenchymal stem cells in the treatment and prevention of graft-versus-host disease. Adv. Hematol. 2011;2011:427863. doi: 10.1155/2011/427863. [DOI] [PMC free article] [PubMed] [Google Scholar]
- Liu Y., Wang L., Kikuiri T., Akiyama K., Chen C., Xu X., Yang R., Chen W., Wang S., Shi S. Mesenchymal Stem Cell-Based Tissue Regeneration is Governed by Recipient T Lymphocytes via IFN-Gamma and TNF-Alpha. Nat. Med. 2011;17:1594–1601. doi: 10.1038/nm.2542. [DOI] [PMC free article] [PubMed] [Google Scholar]
- Meisel R., Zibert A., Laryea M., Gobel U., Daubener W., Dilloo D. Human bone marrow stromal cells inhibit allogeneic T-cell responses by indoleamine 2,3-dioxygenase-mediated tryptophan degradation. Blood. 2004;103:4619–4621. doi: 10.1182/blood-2003-11-3909. [DOI] [PubMed] [Google Scholar]
- Morikawa S., Mabuchi Y., Niibe K., Suzuki S., Nagoshi N., Sunabori T., Shimmura S., Nagai Y., Nakagawa T., Okano H., Matsuzaki Y. Development of mesenchymal stem cells partially originate from the neural crest. Biochem. Biophys. Res. Commun. 2009;379:1114–1119. doi: 10.1016/j.bbrc.2009.01.031. [DOI] [PubMed] [Google Scholar]
- Muraglia A., Cancedda R., Quarto R. Clonal Mesenchymal Progenitors from Human Bone Marrow Differentiate in Vitro According to a Hierarchical Model. J. Cell Sci. 2000;113(Pt 7):1161–1166. doi: 10.1242/jcs.113.7.1161. [DOI] [PubMed] [Google Scholar]
- Nauman E.A., Sakata T., Keaveny T.M., Halloran B.P., Bikle D.D. bFGF administration lowers the phosphate threshold for mineralization in bone marrow stromal cells. Calcif. Tissue Int. 2003;73:147–152. doi: 10.1007/s00223-002-1033-6. [DOI] [PubMed] [Google Scholar]
- Nissen-Meyer L.S., Jemtland R., Gautvik V.T., Pedersen M.E., Paro R., Fortunati D., Pierroz D.D., Stadelmann V.A., Reppe S., Reinholt F.P., Del Fattore A., Rucci N., Teti A., Ferrari S., Gautvik K.M. Osteopenia, decreased bone formation and impaired osteoblast development in Sox4 heterozygous mice. J. Cell Sci. 2007;120:2785–2795. doi: 10.1242/jcs.003855. [DOI] [PubMed] [Google Scholar]
- O'mahony D.S., Glavan B.J., Holden T.D., Fong C., Black R.A., Rona G., Tejera P., Christiani D.C., Wurfel M.M. Inflammation and immune-related candidate gene associations with acute lung injury susceptibility and severity: a validation study. PLoS One. 2012;7 doi: 10.1371/journal.pone.0051104. [DOI] [PMC free article] [PubMed] [Google Scholar]
- Ortiz L.A., Dutreil M., Fattman C., Pandey A.C., Torres G., Go K., Phinney D.G. Interleukin 1 receptor antagonist mediates the antiinflammatory and antifibrotic effect of mesenchymal stem cells during lung injury. Proc. Natl. Acad. Sci. U. S. A. 2007;104:11002–11007. doi: 10.1073/pnas.0704421104. [DOI] [PMC free article] [PubMed] [Google Scholar]
- Ortiz L.A., Gambelli F., Mcbride C., Gaupp D., Baddoo M., Kaminski N., Phinney D.G. Mesenchymal stem cell engraftment in lung is enhanced in response to bleomycin exposure and ameliorates its fibrotic effects. Proc. Natl. Acad. Sci. U. S. A. 2003;100:8407–8411. doi: 10.1073/pnas.1432929100. [DOI] [PMC free article] [PubMed] [Google Scholar]
- Ozdemir A., Fisher-Aylor K.I., Pepke S., Samanta M., Dunipace L., Mccue K., Zeng L., Ogawa N., Wold B.J., Stathopoulos A. High resolution mapping of twist to DNA in Drosophila embryos: efficient functional analysis and evolutionary conservation. Genome Res. 2011;21:566–577. doi: 10.1101/gr.104018.109. [DOI] [PMC free article] [PubMed] [Google Scholar]
- Phinney D.G. Biochemical heterogeneity of mesenchymal stem cell populations: clues to their therapeutic efficacy. Cell Cycle. 2007;6:2884–2889. doi: 10.4161/cc.6.23.5095. [DOI] [PubMed] [Google Scholar]
- Phinney D.G., Galipeau J., Krampera M., Martin I., Shi Y., Sensebe L. MSCs: science and trials. Nat. Med. 2013;19:812. doi: 10.1038/nm.3220. [DOI] [PubMed] [Google Scholar]
- Reimand J., Arak T., Vilo J. g:Profiler—a web server for functional interpretation of gene lists (2011 update) Nucleic Acids Res. 2011;39:W307–W315. doi: 10.1093/nar/gkr378. [DOI] [PMC free article] [PubMed] [Google Scholar]
- Rodrigues C.O., Nerlick S.T., White E.L., Cleveland J.L., King M.L. A Myc-Slug (Snail2)/Twist regulatory circuit directs vascular development. Development. 2008;135:1903–1911. doi: 10.1242/dev.011296. [DOI] [PMC free article] [PubMed] [Google Scholar]
- Russell K.C., Phinney D.G., Lacey M.R., Barrilleaux B.L., Meyertholen K.E., O'connor K.C. In vitro high-capacity assay to quantify the clonal heterogeneity in trilineage potential of mesenchymal stem cells reveals a complex hierarchy of lineage commitment. Stem Cells. 2010;28:788–798. doi: 10.1002/stem.312. [DOI] [PubMed] [Google Scholar]
- Sacchetti B., Funari A., Michienzi S., Di Cesare S., Piersanti S., Saggio I., Tagliafico E., Ferrari S., Robey P.G., Riminucci M., Bianco P. Self-renewing osteoprogenitors in bone marrow sinusoids can organize a hematopoietic microenvironment. Cell. 2007;131:324–336. doi: 10.1016/j.cell.2007.08.025. [DOI] [PubMed] [Google Scholar]
- Sandmann T., Girardot C., Brehme M., Tongprasit W., Stolc V., Furlong E.E. A core transcriptional network for early mesoderm development in Drosophila melanogaster. Genes Dev. 2007;21:436–449. doi: 10.1101/gad.1509007. [DOI] [PMC free article] [PubMed] [Google Scholar]
- Sarugaser R., Hanoun L., Keating A., Stanford W.L., Davies J.E. Human mesenchymal stem cells self-renew and differentiate according to a deterministic hierarchy. PLoS One. 2009;4 doi: 10.1371/journal.pone.0006498. [DOI] [PMC free article] [PubMed] [Google Scholar]
- Shimizu-Sasaki E., Yamazaki M., Furuyama S., Sugiya H., Sodek J., Ogata Y. Identification of a novel response element in the rat bone sialoprotein (BSP) gene promoter that mediates constitutive and fibroblast growth factor 2-induced expression of BSP. J. Biol. Chem. 2001;276:5459–5466. doi: 10.1074/jbc.M008971200. [DOI] [PubMed] [Google Scholar]
- Sivanathan K.N., Gronthos S., Rojas-Canales D., Thierry B., Coates P.T. Interferon-gamma modification of mesenchymal stem cells: implications of autologous and allogeneic mesenchymal stem cell therapy in allotransplantation. Stem Cell Rev. 2014;10:351–375. doi: 10.1007/s12015-014-9495-2. [DOI] [PubMed] [Google Scholar]
- Sosic D., Richardson J.A., Ornitz D.M., Olson E.N. Twist regulates cytokine gene expression through a negative feedback loop that represses NF-kappaB activity. Cell. 2003;112:169–180. doi: 10.1016/s0092-8674(03)00002-3. [DOI] [PubMed] [Google Scholar]
- Su X., Yu Y., Zhong Y., Giannopoulou E.G., Hu X., Liu H., Cross J.R., Ratsch G., Rice C.M., Ivashkiv L.B. Interferon-gamma regulates cellular metabolism and mRNA translation to potentiate macrophage activation. Nat. Immunol. 2015 doi: 10.1038/ni.3205. [DOI] [PMC free article] [PubMed] [Google Scholar]
- Tsutsumi S., Shimazu A., Miyazaki K., Pan H., Koike C., Yoshida E., Takagishi K., Kato Y. Retention of multilineage differentiation potential of mesenchymal cells during proliferation in response to FGF. Biochem. Biophys. Res. Commun. 2001;288:413–419. doi: 10.1006/bbrc.2001.5777. [DOI] [PubMed] [Google Scholar]
- Vidal C., Bermeo S., Li W., Huang D., Kremer R., Duque G. Interferon gamma inhibits adipogenesis in vitro and prevents marrow fat infiltration in oophorectomized mice. Stem Cells. 2012;30:1042–1048. doi: 10.1002/stem.1063. [DOI] [PubMed] [Google Scholar]
- Vidal C., Li W., Santner-Nanan B., Lim C.K., Guillemin G.J., Ball H.J., Hunt N.H., Nanan R., Duque G. The kynurenine pathway of tryptophan degradation is activated during osteoblastogenesis. Stem Cells. 2015;33:111–121. doi: 10.1002/stem.1836. [DOI] [PubMed] [Google Scholar]
- Wagner W., Ho A.D. Mesenchymal stem cell preparations—comparing apples and oranges. Stem Cell Rev. 2007;3:239–248. doi: 10.1007/s12015-007-9001-1. [DOI] [PubMed] [Google Scholar]
- Whitfield M.J., Lee W.C., Van Vliet K.J. Onset of heterogeneity in culture-expanded bone marrow stromal cells. Stem Cell Res. 2013;11:1365–1377. doi: 10.1016/j.scr.2013.09.004. [DOI] [PubMed] [Google Scholar]
- Xiao G., Jiang D., Gopalakrishnan R., Franceschi R.T. Fibroblast growth factor 2 induction of the osteocalcin gene requires MAPK activity and phosphorylation of the osteoblast transcription factor, Cbfa1/Runx2. J. Biol. Chem. 2002;277:36181–36187. doi: 10.1074/jbc.M206057200. [DOI] [PubMed] [Google Scholar]
- Yang M.H., Wu M.Z., Chiou S.H., Chen P.M., Chang S.Y., Liu C.J., Teng S.C., Wu K.J. Direct regulation of TWIST by HIF-1alpha promotes metastasis. Nat. Cell Biol. 2008;10:295–305. doi: 10.1038/ncb1691. [DOI] [PubMed] [Google Scholar]
- Zhou S., Greenberger J.S., Epperly M.W., Goff J.P., Adler C., Leboff M.S., Glowacki J. Age-related intrinsic changes in human bone-marrow-derived mesenchymal stem cells and their differentiation to osteoblasts. Aging Cell. 2008;7:335–343. doi: 10.1111/j.1474-9726.2008.00377.x. [DOI] [PMC free article] [PubMed] [Google Scholar]
Associated Data
This section collects any data citations, data availability statements, or supplementary materials included in this article.
Supplementary Materials
Supplementary material.
Related to Fig. 2. Transcripts up or down regulated by > 2-fold as determined by micro-array analysis of MSCs following siRNA targeting of TWIST1.