Abstract
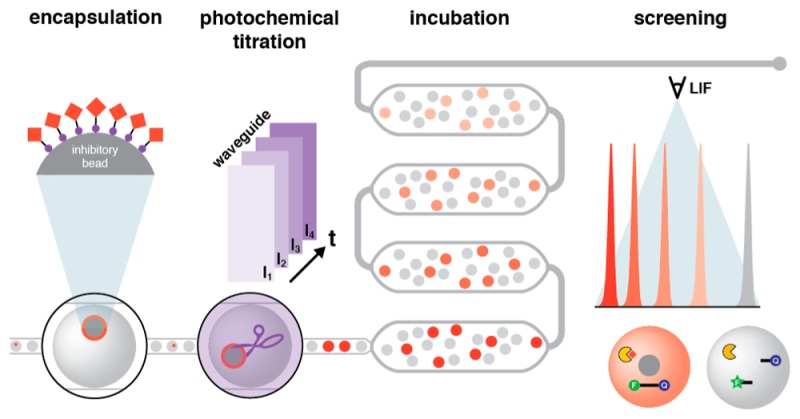
With the potential for each droplet to act as a unique reaction vessel, droplet microfluidics is a powerful tool for high-throughput discovery. Any attempt at compound screening miniaturization must address the significant scaling inefficiencies associated with library handling and distribution. Eschewing microplate-based compound collections for one-bead-one-compound (OBOC) combinatorial libraries, we have developed hνSABR (Light-Induced and -Graduated High-Throughput Screening After Bead Release), a microfluidic architecture that integrates a suspension hopper for compound library bead introduction, droplet generation, microfabricated waveguides to deliver UV light to the droplet flow for photochemical compound dosing, incubation, and laser-induced fluorescence for assay readout. Avobenzone-doped PDMS (0.6% w/w) patterning confines UV exposure to the desired illumination region, generating intradroplet compound concentrations (>10 μM) that are reproducible between devices. Beads displaying photochemically cleavable pepstatin A were distributed into droplets and exposed with five different UV intensities to demonstrate dose–response screening in an HIV-1 protease activity assay. This microfluidic architecture introduces a new analytical approach for OBOC library screening, and represents a key component of a next-generation distributed small molecule discovery platform.
High-throughput small molecule discovery, currently the exclusive province of large industrial and academic high-throughput screening (HTS) facilities, has long been in the sights of microfluidic technology developers. Miniaturizing the many thousands (or millions) of assay reactions and replacing robotic automation with integrated microfluidic handling was to deliver this powerful, unbiased mode of discovery from the cost and infrastructure burdens of big, centralized science. While miniaturization via microfabrication and microfluidics has proven capable of reducing reaction volumes by orders of magnitude,1−4 distributing the massive molecular diversity of an HTS compound library one member at a time into these minute assay volumes has presented a significant engineering challenge.
“Sipping,” or serially sampling compounds from microplate-based libraries is the most common approach to interface a compound library in the macro world with microfluidic circuitry.5,6 However, applying a sipping-based library distribution paradigm to interface large (>105) compound collections with microfluidic droplets is not trivial because it requires: access to a microplate-based library, a robotic sipping mechanism, library reformatting from DMSO stocks, an encoding strategy to preserve compound identity in a droplet population,5 and compound mixing with assay and target.7,8
Alternatively, it is possible to conceive of a screening paradigm that eliminates entirely the need for microfluidic technology to interface with microplate-based HTS, thereby escaping the scaling challenges. Integrating one-bead-one-compound (OBOC) libraries with droplet-scale assays poses such an alternative. Combinatorial OBOC library synthesis is an inexpensive and highly efficient route to large compound collections,9−11 and depositing single library beads into discrete microscale volumes has proven a feasible approach to measure a compound’s biological activity.12−15 Adapting this concept to the droplet scale promised significant gains in handling and throughput, but faced a vexing obstacle in the introduction of rapidly settling OBOC beads into the microfluidic architecture. We previously disclosed the suspension hopper, a key microfluidic circuit component that enables introduction and distribution of hundreds of thousands of synthesis resin beads into picoliter-scale droplets.16 Applying these findings to large OBOC libraries, however, would require reproducible and predictive compound liberation from library beads under high-throughput flow conditions to initiate screening. Here, we present devices fabricated using two-tone soft lithographic patterning with avobenzone-doped PDMS that feature a well-defined droplet illumination region and enable miniaturized droplet-scale, dose-dependent functional screens of OBOC libraries. We call this approach hνSABR, or Light-Induced and -Graduated High-Throughput Screening After Bead Release (LIGHTSABR).
Experimental Section
All reagents were from Sigma-Aldrich (St. Louis, MO) unless otherwise noted. Fmoc-photolabile linker (Advanced ChemTech, Louisville, KY), 1-[(1-(Cyano-2-ethoxy-2-oxoethylideneaminooxy) dimethylaminomorpholino)] uronium hexafluorophosphate (COMU, Acros Organics, Geel, Belgium), N,N-diisopropylethylamine (DIEA, TCI America, Portland, OR), N,N-dimethylformamide (DMF, Thermo Fisher Scientific, Waltham, MA), N,N-diisopropylcarbodiimide (DIC, Thermo Fisher Scientific), dichloromethane (DCM, Thermo Fisher Scientific), dimethyl sulfoxide (DMSO, AMRESCO Inc., Solon, OH), N-α-Fmoc-glycine (Fmoc-Gly-OH, AnaSpec, Inc., Fremont, CA), N-α-Fmoc-glutamic acid t-butyl ester (Fmoc-Glu(OtBu)-OH, AnaSpec, Inc.), Fmoc-3-(2-(2-aminoethoxy)ethoxy)propanoic acid (AnaSpec, Inc.), bovine serum albumin (BSA, Roche Diagnostics, Indianapolis, IN), poly(dimethylsiloxane) (PDMS, Dow Corning, Midland, MI), trimethylsiloxy-terminated PDMS (200 cSt, Gelest Inc., Morrisville, PA), streptavidin-conjugated Brilliant Violet 570 (BV570, BioLegend, San Diego, CA), fluorometric HIV protease activity assay kit (SensoLyte 520, Anaspec, Inc.), and avobenzone (Spectrum Chemical Mfg. Corp., New Brunswick, NJ) were used as provided. Solvents used in solid-phase synthesis were dried over molecular sieves (3 Å, 3.2 mm pellets). All solid-phase synthesis was conducted in a UV-free environment, and all reactions were performed in DMF with rotation (22 rpm) unless otherwise noted. Thrombin cleavage buffer (20 mM Tris-HCl, 150 mM NaCl, 2.5 mM CaCl2, 0.5% w/v BSA, pH 8.4) and HIV-1 protease activity assay buffer (100 mM 4-morpholineethanesulfonic acid, 1 M NaCl, 1 mM EDTA, 2% v/v DMSO, 0.5% w/v BSA, 0.1% Tween-80, pH 6.5) were prepared in DI water and filtered (0.22-μm Steritop, EMD Millipore, Billerica, MA) before use.
Microfluidic Device Fabrication and Operation
Channel structures were fabricated in PDMS using soft lithography.17 Two-tone patterned PDMS devices were fabricated in a two-step process. Avobenzone (34 mg) was dissolved in toluene (200 μL) and mixed into of PDMS prepolymer (5.5 g, 10:1 elastomer base/curing agent). Degassed avobenzone-PDMS prepolymer was loaded into a disposable syringe (3 mL, BD Medical, Franklin Lakes, NJ) and applied over the incubation channel and bead-introduction reservoir regions of the master. After partial curing (80 °C, 12 min), native, degassed PDMS prepolymer (44 g, 10:1) was poured on top of the master and cured to completion (80 °C, 1 h). Fluidic access ports were punched with a biopsy punch (0.75 mm, World Precision Instruments, Inc., Sarasota, FL). Wells for droplet collection were prepared by excising a region (4 mm dia.) from a featureless piece of PDMS (3 mm thick). Patterned PDMS devices and glass microscope backing slides were immersed in an acid hydrolysis solution (5:1:1 DI water/HCl/H2O2, 30 min), rinsed, dried, and immediately bonded together (80 °C, overnight).18 Collection wells were similarly bonded. Channel depths (50 and 150 μm) were measured using a stylus profilometer (DektakXT, Bruker, Billerica, MA). Microbore Tygon tubing (0.01” i.d. × 0.03” o.d., Saint Gobain, Valley Forge, PA) and PTFE tubing (0.018” i.d. × 0.03” o.d., Zeus Industrial Products, Orangeburg, SC) were used to connect the inlet ports on the device to glass syringes (250 and 500 μL, Hamilton, Reno, NV) via blunt-tip Luer-Lok needles (30-gauge, Small Parts, Inc., Miramar, FL). Fluids were driven through the circuit with syringe pumps (Legato 100, KD Scientific, Holliston, MA).
Microsolidic mirrors were fabricated by first priming the mirror channel (3-mercaptopropyltrimethoxysilane). Low-melting temperature solder (51:32.5:16.5 indium/bismuth/tin, Indium Corporation of America, Utica, NY) was melted and pulled through the channel with vacuum while the device was seated on a hot plate (115 °C). The device was then cooled to RT, solidifying the solder.19
Integrated Waveguide Fabrication
One end of a custom optical fiber patch cable (600-μm dia., 0.39 NA, Thorlabs) was coupled to a high-power UV LED (365 nm, Thorlabs), and the other end was inserted into a microfluidic waveguide channel (150 μm deep, expanded further by a biopsy punch) and secured. The channel was filled with optical adhesive (NOA 71, Norland Products, Cranbury, NJ), and cured (3.5 J/cm2, longwave UV light).20 As a final curing step, UV light from the LED (current = 300 mA) was transmitted through the patch cable and into the waveguide for 30 min prior to calibration.
Integrated Circuit Operation
Prior to droplet generation, the incubation channel was backfilled with oil phase (Figure S1, Supporting Information). The oil phase consisted of (20:76:4 w/w/w) silicone oil (DMF-A-6CS, Shin-Etsu, Akron, OH), mineral oil, and surfactant (KF-6038, Shin-Etsu). Aqueous droplets (200–250 pL) in oil were generated at a flow focusing channel intersection.21 Oil (0.9 μL/min) was driven into the circuit through the OIL inlet and aqueous phase (0.5 μL/min total) was driven into the circuit through the AQ1 and AQ2 inlets. For all experiments involving photochemical compound dosing, the outside surface of the suspension hopper was treated with an alcohol-based commercial sunscreen (Banana Boat Clear UltraMist).
Microfluidic Droplet Incubation Analysis
Droplets were generated using one aqueous phase (AQ1) consisting of fluorescein (300 nM) and phycoerythrin (20 μg/mL) in thrombin cleavage buffer and a second aqueous phase (AQ2) consisting of phycoerythrin alone (20 μg/mL). Flow rates were alternated between 0.4 and 0.1 μL/min (AQ1/AQ2) and 0.1 and 0.4 μL/min AQ1/AQ2. A threshold was set in the 520 nm channel to count high-fluorescein droplets (0.4 μL/min AQ1) and a threshold was set in the 570 nm channel to count all droplets. As the two AQ flow rates were switched, data collection was initiated for 35 min (500 Hz). Data were analyzed using a custom LabVIEW program to tally droplet counts and IGOR Pro (WaveMetrics, Lake Oswego, OR) to calculate mean incubation time and transition time.
Waveguide Calibration for Photochemical Compound Dosing
Brilliant Violet 570 streptavidin (BV570, 1 μg/mL in thrombin cleavage buffer) was pumped through the calibration channel (0.5 μL/min). The dye was excited using the integrated waveguide (LED current = 0, 100, 200, 400 mA), and emission was measured in the 570 nm channel (500 Hz). The calibration channel was rinsed with water, dried, and filled with trimethylsiloxy-terminated PDMS. Beads displaying a fluorescein-labeled compound attached to resin with an o-nitrobenzyl photolabile linker (PC-FAM beads) were distributed into droplets (20 μg/mL phycoerythrin in thrombin cleavage buffer, AQ1) via a suspension hopper16 and directed through the UV illumination region for photochemical cleavage. Photochemically cleaved compound fluorescence was detected at turn 4 in the incubation channel (1 kHz). The LED was held at 0 mA (5 or 10 min), then LED current was changed from 0 to 100, 200, 400, and then back to 0 mA in 15 min intervals. The droplet stream was dispensed into PDMS wells prefilled with oil (∼50 μL) and the collected droplets imaged using an inverted epifluorescence microscope (10X, 0.25 NA, Axio Observer A1, Zeiss, Thornwood, NY) equipped with a CCD camera (AxioCam ICm1, Zeiss) to determine droplet volume (ImageJ, NIH, Bethesda, MD).22 Droplet concentration was calibrated by adding a stream of 5(6)-carboxyfluorescein (50 μM) to AQ2 and changing the flow rate ratio of AQ1 and AQ2 to produce droplets containing various concentrations of fluorescein (0, 25, and 50 μM). Data were analyzed using a custom LabVIEW program that calculates the statistical mode for each droplet’s fluorescence profile and IGOR Pro to generate histograms of droplet fluorescence. Mean fluorescence and standard deviation were determined by fitting the histogram peaks to a Gaussian curve. Fluorescence intensity values were used to calculate [FAM] using the calibration curve.
Integrated Droplet-Based HIV-1 Protease Activity Assay
HIV-1 protease was generated immediately prior to each experiment by in vitro transcription/translation (IVTT) as described previously.16 HIV-1 protease IVTT product diluted 5-fold in HIV-1 protease activity assay buffer (AQ2, 0.2 μL/min) and fluorogenic peptide probe (1X) in assay buffer (AQ1, 0.3 μL/min) combine immediately prior to a flow focusing junction to form droplets of HIV-1 protease activity assay. Beads displaying pepstatin A attached to resin with an o-nitrobenzyl photolabile linker (PC-pepstatin A beads, ∼500 beads/μL) were distributed into droplets via a suspension hopper, directed to the illumination region for UV irradiation, then driven through the entire incubation channel. Droplet assay data were acquired via confocal laser-induced fluorescence detection (1 kHz). A second oil stream (OIL2, 0.45 μL/min) was used to space droplets apart immediately prior to detection. HIV-1 protease activity in the presence of inhibitor was determined by switching the IVTT reaction stream to assay buffer such that droplets contained only fluorogenic probe. Data were analyzed using a custom LabVIEW program that calculates the statistical mode for each droplet’s fluorescence profile and IGOR Pro to generate histograms of droplet fluorescence. Mean fluorescence and standard deviation were determined by fitting the histogram peaks to a Gaussian curve and used to calculate Z-factor23 between populations of empty and 1-bead droplets.
Results and Discussion
Delivery and Containment of UV Light in a PDMS Circuit
Three circuit components (waveguide, serpentine, and mirror) collectively define the “illumination region,” which lies directly downstream of the droplet generation junction and upstream of the incubation channel (Figure 1). Photochemical cleavage of library compound from the bead into the droplet requires precise droplet irradiation with UV light, which enters the integrated circuit via a microfabricated waveguide consisting of an optical adhesive core (NOA 71, n = 1.56)20 with borosilicate glass and PDMS cladding (n = 1.47 and 1.41, respectively). The illuminating face of the waveguide (150 μm high × 1 mm wide) sits adjacent a 9-pass serpentine channel and opposite a metal microsolidic mirror.24 The eight additional passes in the serpentine increase UV exposure ∼480% and the mirror reflects unabsorbed light from the waveguide back into the serpentine, further increasing UV exposure ∼50% for a single-pass channel (Figure S2).
Figure 1.
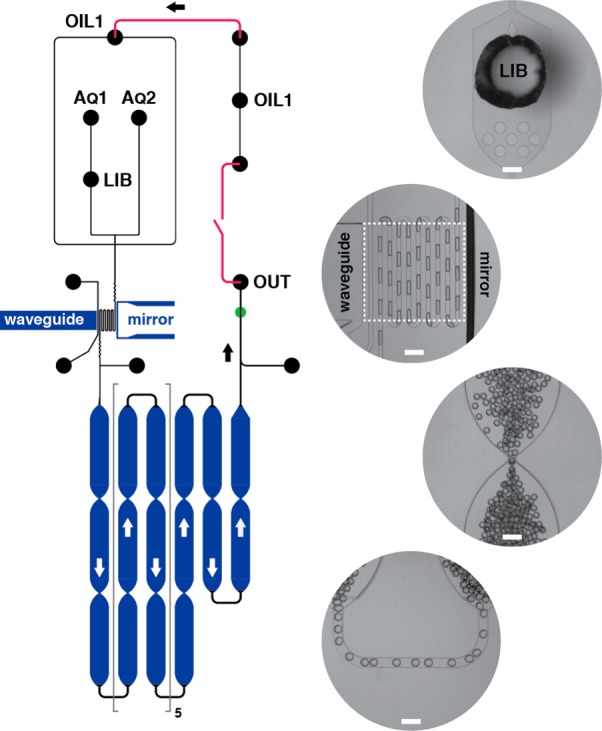
Circuit schematic. Oil, aqueous phase components, and compound library beads enter at input ports OIL1, AQ1 & AQ2, and LIB, respectively. A flow-focusing junction generates droplets that encapsulate the library beads and immediately flow through a serpentine channel bounded by an integrated optical waveguide and a microsolidic mirror (“illumination region”, white box in the micrograph inset). UV irradiation photochemically cleaves compound from the library beads, establishing a UV dose-dependent compound concentration within the droplet. Compound-dosed droplets then feed into a 20 cm-long incubation channel toward the OUT output port. Color-coded features designate microbore Tygon tubing connectors (magenta), 50-μm channel depth (black), 150-μm channel depth (blue), and the LIF detection point (green). Micrographs (inset) illustrate suspension hopper input (LIB) for library bead introduction, UV illumination region, and incubation channel constrictions and turns (top to bottom). Scale =200 μm.
It is critical to confine library bead exposure with UV light strictly to the illumination region. If stray radiation induces compound cleavage prior to encapsulation, then droplets will contain a mixture of compounds from hundreds—if not thousands—of library beads. Furthermore, if encapsulated beads experience continued exposure during incubation, the compound concentration during assay would be variable. Incorporating avobenzone, a common UV-absorbent ingredient in sunscreens, into the PDMS seemed a straightforward method to intercept stray 365 nm light outside the illumination region. However, if avobenzone were present within the illumination region, it would counterproductively attenuate UV intensity at the point of photochemical compound cleavage. Furthermore, we observed avobenzone readily leaching from doped PDMS into the continuous phase, necessitating a strategy to minimize contact with droplet flow upstream of the illumination region.
We devised a two-step mold fabrication protocol for selectively patterning avobenzone-doped PDMS only in regions that required UV screening, which includes bead introduction (LIB, Figure 1), incubation (blue circuit segments, Figure 1), and detection regions (green, Figure 1). Selective patterning of these regions on the SU-8 master with avobenzone-doped PDMS prepolymer (Figure 2A,B), partial curing, and further encasing within native PDMS following the partial cure produced a two-tone PDMS mold. Doped prepolymer (20 mM avobenzone, ∼ 0.6% w/w) exhibited necessary and sufficient absorbance at λ < 400 nm (Figure 2C) in photochemical dosing experiments that compared the dosing behavior of droplets containing PC-FAM beads (Figure S3) in circuits with and without avobenzone-doped PDMS patterning. The device with avobenzone-doped PDMS features sharp, stepwise transitions in photochemical dosing, correlating with programmed stepwise changes in LED intensity. The device without avobenzone-dosed PDMS yielded a fluorescence profile that lacked well-defined correlation with LED intensity, instead producing gradual transitions suggestive of continuous UV exposure (Figure S4).
Figure 2.
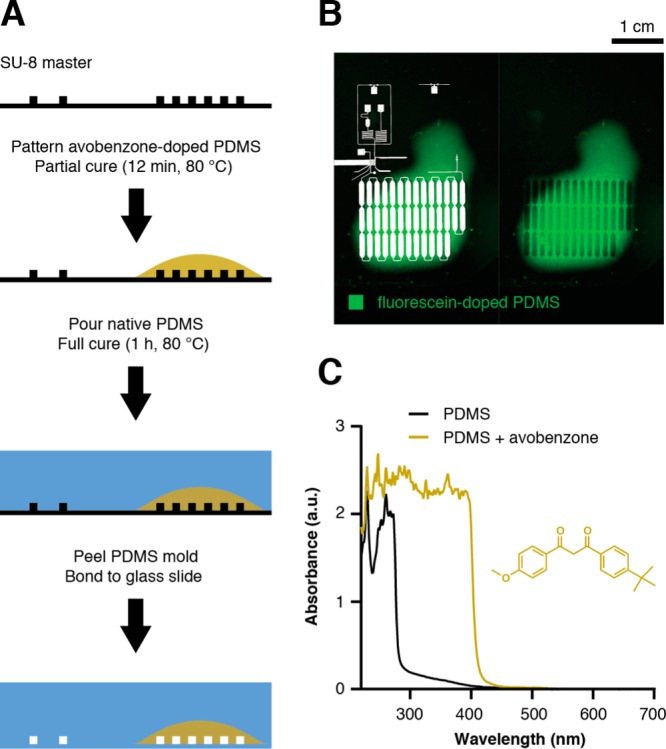
PDMS device patterning with avobenzone-doped PDMS. (A) Patterning involves two sequential applications of PDMS on the SU-8/silicon master. Avobenzone-doped PDMS prepolymer (gold) is applied to the desired regions and partially cured prior to addition of native PDMS prepolymer. The PDMS mold is fully cured, peeled from the master, and bonded to a glass microscope slide. (B) A micrograph demonstrates patterning of the device using fluorescein-doped PDMS (green) for visualization. The circuit (white overlay) illustrates registration of avobenzone-doped PDMS with the incubation channel to prevent stray radiation from continuously dosing compound downstream of the UV illumination region. (C) UV–vis absorbance spectra of both native PDMS (black trace) and doped PDMS (20 mM avobenzone, gold trace, structure inset) confirmed attenuation of 365 nm illumination using avobenzone.
A previous strategy to prevent UV scattering in PDMS devices involved synthesizing fluorescent dapoxyl-labeled silica nanoparticles and incorporating them into the PDMS prepolymer.25 However, the dapoxyl dye is expensive (∼$27/mg) and the fluorescence generated by the dye-labeled nanoparticles will interfere with LIF detection. Previous work that did not require synthesis described mixing a dye solution into the PDMS prepolymer to produce devices with integrated long-pass optical filters,26 analogous to our need for UV-filtering PDMS. We chose avobenzone as our dopant because it effectively and selectively absorbs long-wave UV light, does not fluoresce, and is cheap (<$0.02/mg).
Waveguide Calibration
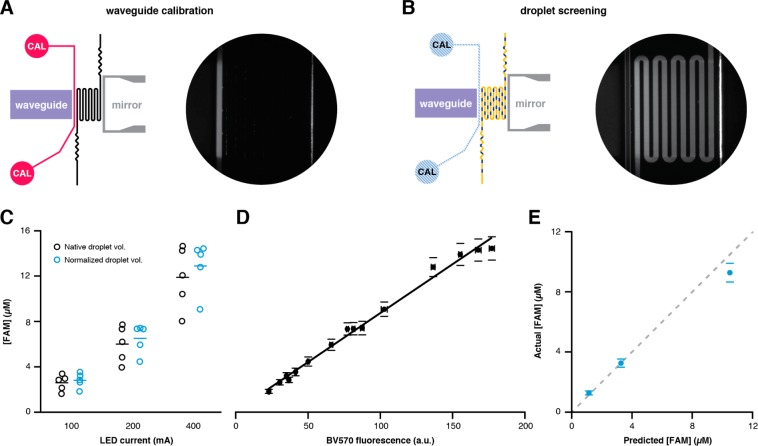
UV exposure in the illumination region is heavily dependent on the quality of the patch cable/NOA waveguide coupling, which can vary significantly between devices for the same LED intensity and requires calibration. Waveguide calibration entails exciting a solution of BV570 fluorescent dye (λex and λem = 405/570 nm, respectively) flowing through a calibration channel (Figure 3A) with the LED via the waveguide and measuring emission at 570 nm. After recording steady-state BV570 fluorescence for each desired LED intensity, the calibration channel is filled with PDMS to make the channel optically transparent for “screening mode” operation (Figure 3B). Encapsulated PC-FAM beads are exposed with UV light at the same LED intensities used during calibration in order to demonstrate controlled photochemical cleavage and concomitant increase in droplet fluorescence measured in the incubation channel. Dosing response varied as much as 110% for the same LED intensity over a set of five different experiments (Figure 3C), and normalization for droplet volume only marginally reduced the noise. Thus, patch cable/waveguide coupling variability during device fabrication is likely the source of experimental noise. Nonetheless, plotting normalized intradroplet [FAM] as a function of BV570 fluorescence intensity (Figure 3D) yielded a linear relationship (r2 = 0.99), allowing direct comparison of experiments performed on different devices and predictive photochemical compound dosing in droplets. Using the calibration curve, we calculated BV570 emission intensities predicted to yield 1, 3, and 10 μM fluorescein-labeled photochemical cleavage product, and identified LED intensities to produce those values. Subsequent photochemical droplet dosing experimental data agreed well with predicted values (Figure 3E).
Figure 3.
Integrated waveguide calibration. (A) The calibration channel (magenta) is filled with calibrant dye (BV570) and excited with UV light from the integrated waveguide (purple). BV570 fluorescence emission (micrograph inset) is measured at different UV intensities (LED current =100, 200, 400 mA). (B) After waveguide calibration, the calibration channel is filled with PDMS (blue hatch) and droplets containing PC-FAM beads are irradiated in the serpentine channel between the waveguide and the mirror (gray). UV illumination of the dye-filled dosing channel reveals the light transmission from the waveguide through the serpentine (micrograph inset). (C) The concentration of fluorescein-labeled photochemical cleavage product exhibited significant variance (n = 5 devices and days), either as absolute concentrations (black circles) or normalized droplet concentrations (blue circles, volume normalized to 200 pL). Error bars for each measurement have been removed for clarity. (D) Normalized concentration data were plotted as a function of BV570 fluorescence intensity during calibration. (E) The observed intradroplet [FAM] correlated well with predicted concentrations for [FAM] = 1, 3, and 10 μM based on calibration data. The dashed line slope =1.
While attempting waveguide calibration by flowing BV570 through the serpentine, we discovered that a dedicated calibration channel is necessary because prolonged exposure to 365 nm light in an aqueous environment significantly disrupts subsequent droplet formation. This effect is most likely due to PDMS surface oxidation with polar silanol groups as long-wave UV exposure depletes surface —CH3 groups and replaces them with silanol groups, albeit with slow kinetics.27 The presence of aqueous media during calibration likely increased the kinetics, as subsequent droplet generation was not disrupted when an empty channel was similarly exposed to UV light.
Droplet Incubation
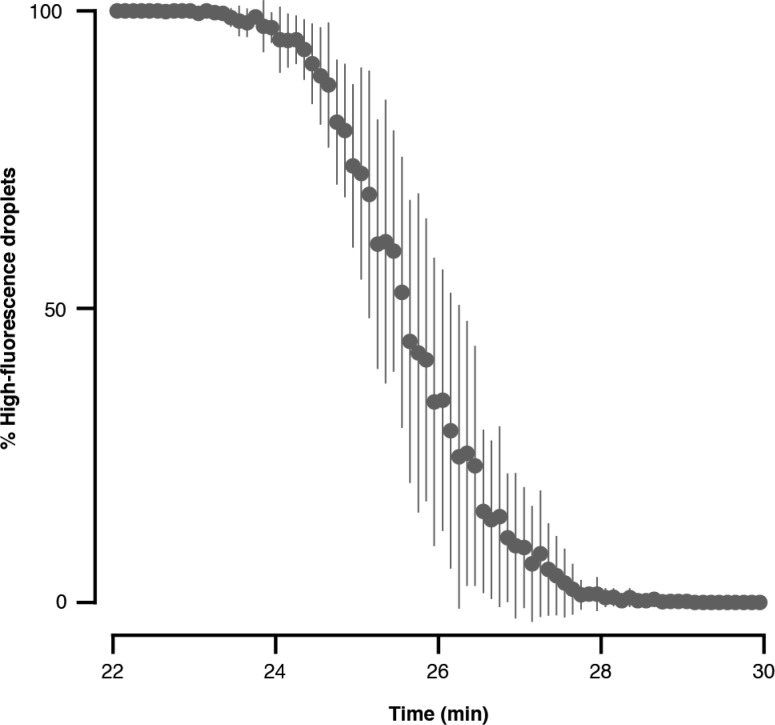
After UV exposure establishes a desired intradroplet compound concentration, droplets are driven through the incubation channel prior to detection. The incubation channel (20 cm long, 1 mm wide, 150 μm deep) contains constriction points that randomize droplet position horizontally in the channel to minimize parabolic flow-induced dispersion.28 Furthermore, droplets separate into two vertical layers while flowing through the 150-μm-deep channel segments. Tapered turns are 50 μm deep and act as constriction points that randomize droplets between the two layers. Droplet incubation times were determined by exchanging the flow rates of AQ1 (fluorescein) and AQ2 (buffer) and detecting the transition between populations of droplets with “high” and “low” fluorescence, which fits to a Gaussian cumulative distribution function (Figure 4). The mean incubation time (50% high-fluorescence droplets) is 25.5 ± 0.6 min for 4 identical runs. Another important parameter for incubation is the dispersion ratio (quotient of transition time and incubation time).28 We define the transition as 6σ. The average dispersion ratio for our circuit is 13.4 ± 1.5%, which does not impair droplet assay progression or readout.
Figure 4.
Online droplet incubation. Droplet incubation time in the integrated circuit was determined by exchanging the flow rates of AQ1 (fluorescein, 0.4 μL/min) and AQ2 (buffer, 0.1 μL/min) and keeping the total flow rate constant (0.5 μL/min). AQ1/AQ2 exchange generates a transition from high-fluorescence droplets to low-fluorescence droplets, or vice versa. Incubation times for droplets in the 20 cm-long incubation channel with AQ and OIL flow rates of 0.5 and 0.9 μL/min, respectively, are 25.5 ± 0.6 min (n = 4).
Droplet-Based HIV-1 Protease Activity Assay
The integrated circuit was used to perform an HIV-1 protease activity assay. PC-pepstatin A beads (Figure S5) served as the positive control. Droplets combining protease, fluorogenic peptide substrate and inhibitor beads were exposed with UV light (0.95 J/cm2) in the illumination region, incubated (∼25 min), and detected using confocal LIF. A histogram analysis of ∼240 000 droplets over 90 min (Figure 5A) revealed the presence of several distinct populations. Empty droplets (no beads, brown) exhibited the highest fluorescence due to uninhibited proteolysis of the fluorogenic substrate while droplets with 1 bead (red), 2 beads (blue), and 3+ beads (yellow) exhibited diminished fluorescence as larger doses of pepstatin A resulted in increased inhibition of HIV-1 protease activity. Histogram analysis confirmed the stochastic nature of bead distribution.16 Histograms of 3 min windows of data were integrated to determine the total number of droplets in each population (empty, 1-bead, etc.) and the average beads/droplet for each time point in order to compare the observed bead distribution with the expected Poisson distribution (Figure 5B). Bead distribution for PC-pepstatin A beads exhibits consistent deviation from Poisson; there is an abundance of empty and multibead droplets accompanied by a dearth in 1-bead droplets throughout the experiment.
Figure 5.
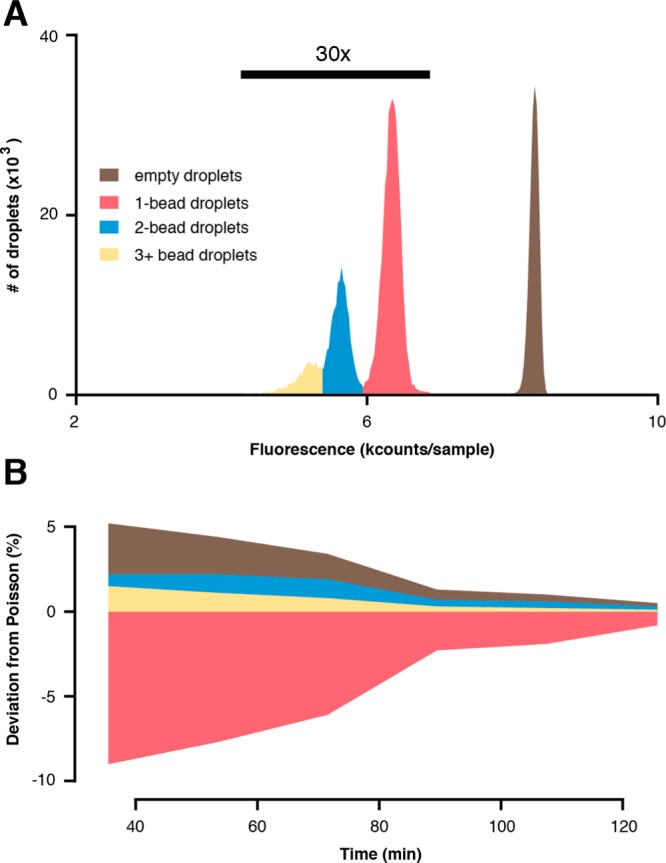
Droplet-based HIV-1 protease activity assay. (A) Histogram analysis of the droplet assay distribution included ∼240 000 droplets, which were irradiated with UV light (0.95 J/cm2) and incubated (∼25 min) prior to detection. Empty droplet fluorescence intensities (brown) differ significantly from fluorescence of droplets occupied with 1 (red), 2 (blue), or 3+ (yellow) PC-pepstatin A inhibitor beads. Histogram data derived from occupied droplets were magnified (30-fold) for display. (B) The initial encounter probabilities deviate from the Poisson distribution. Deviations decrease over the course of the experiment as the bead introduction rate slows.
Deviations from the Poisson distribution are likely attributed to the nature of the PC-pepstatin A beads. We observed that hydrophobic PC-pepstatin A beads form large clumps (25+ beads) as they sediment within the suspension hopper, only breaking up in shear flow after entering the microfluidic circuit. This produces periods of time with sparse bead introduction interspersed with short bursts of high-volume bead introduction, producing the observed effect. The presence of 0.1% Tween-80 in the aqueous phase slightly abated bead clumping. However, every bead displayed the same hydrophobic compound, which is a highly artificial scenario. This clumping behavior is not observed with hydrophilic PC-FAM beads. Furthermore, OBOC libraries feature >105 different compounds, each displayed on 10-μm resin with large, polyanionic DNA-encoding tags,29 which will not likely exhibit the same bead clumping behavior seen here.
Dose-Dependent Droplet Screening
By modifying the intensity of the LED, we were able to identify in a dose-dependent fashion conditions that would be acceptable for a high-throughput HIV-1 protease activity assay-based compound library screen. Increasing the LED intensity incrementally generated slugs of droplets containing increasing doses of pepstatin A. Histogram analyses (Figure 6) of droplet slugs that experienced one of five different UV exposures exhibited dose-dependent inhibition of proteolytic activity in all droplet-bead populations. Absent UV exposure, the droplet fluorescence distribution clusters as a single peak that corresponds to uninhibited protease activity (top red trace, > 8000 counts/sample). When the UV exposure is 0.02 J/cm2, the fluorescence profiles of bead-occupied droplets begin to differentiate from those of empty droplets. At a UV exposure of 0.60 J/cm2, HIV-1 protease activity in 1-bead droplets has decreased ∼30%, resulting in a Z-factor of 0.83. This assay performance easily exceeds the threshold (Z factor = 0.5) designating an assay’s ability to identify compounds at least as active as the positive control. At higher doses, protease activity falls to approximately half compared to the uninhibited enzyme, while Z-factor remains relatively constant.
Figure 6.
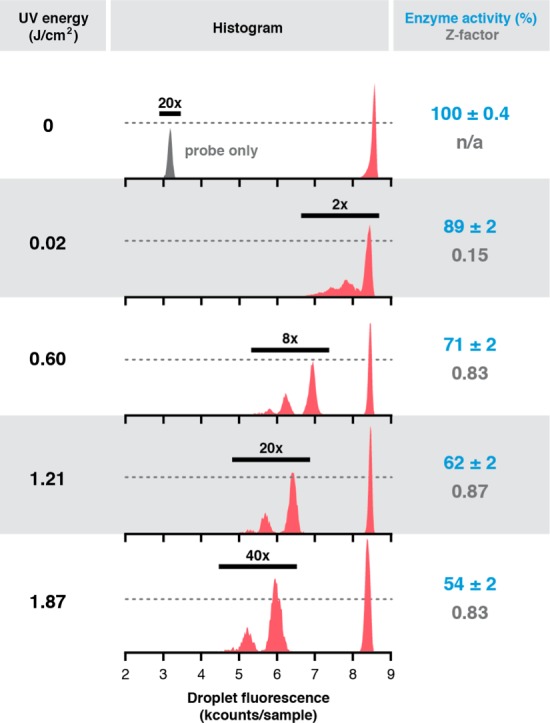
Online dose–response analysis of assay droplet populations. Photochemical pepstatin A dosing in an HIV-1 protease biochemical activity assay results in a UV dose-dependent decrease in % enzyme activity (blue) and a rapid increase and plateau of Z-factor (gray). Z-factor is robust for screening (>0.5) and unchanging for all doses >0.02 J/cm2, defining the window of appropriate dose–response screening conditions for the device. The histograms compile raw data for >34 000 total droplets at each dose. Enzyme activity and Z-factor were calculated only for 1-bead droplets. The vertical position of the dashed line in each histogram represents 4000 droplets.
The peak corresponding to empty droplets does not drift as a function of both time and UV exposure, demonstrating assay stability in a high-throughput droplet-based screen. With automated and graduated UV exposure, screening thousands of droplets enables high-throughput assay development since concentration-dependent Z-factors can be calculated to assess positive control efficacy and enzyme activity. This system creates a “plug-and-play” approach to assay development and compound library analysis. For instance, with PC-pepstatin A beads in hand, we can quickly evaluate droplet-based assays for other aspartyl proteases, including cathepsin D (breast cancer), β-secretase (Alzheimer’s disease), and plasmepsin (malaria). With any such qualified assay, microfluidic hνSABR can be used to perform a preliminary hit rate analysis to determine the most advantageous chemical space for high-resolution photochemical dose–response screening using a droplet sorting device30 and structure elucidation.29
Conclusions
Combinatorial synthesis can generate large compound libraries, but screening focuses on target binding and introduces its own significant analytical challenges. Conventional combinatorial OBOC library screening entails incubating the library with fluorescently labeled target, isolating fluorescent beads, and elucidating hit structures. All downstream hit validation, such as determination of binding affinity and functional assays, is predicated on identification of authentic binders during the primary surface-binding screen. However, high false positive rates plague solid-phase binding assays,31,32 which has driven the development of strategies that reduce surface ligand density to mitigate avidity-based enhancement of binding,32,33 challenge putative hits to exhibit reproducible binding to replicate compound beads in a redundant library,34 or validate in microanalytical fluorescence polarization assay.35 The importance of hit authenticity cannot be overstated because secondary assays almost always require cost- and labor-intensive resynthesis. Investigating false positives wastes significant effort that would otherwise be utilized investigating whether the authentic primary binding events translate to function (e.g., enzyme inhibition, receptor agonism).36
Directly screening a library for desired function with hνSABR circumvents many OBOC library screening challenges while creating new opportunities for small molecule discovery. While our assay involved enzyme inhibition, a common functional screening mode, integrating recent advances in droplet-scale fluorescence polarization detection technology37 should yield more robust off-bead screening for high-affinity binding interactions. Furthermore, UV dose-dependent compound release has the potential to recapitulate dose-dependent “quantitative” high-throughput screening,38 which evaluates compounds on potency and efficacy instead of a single end point. The increased number of assays per compound required to generate such powerful whole-library structure–activity relationship (SAR) data drives up cost and limits library size when conducted in microplates. The miniaturization afforded by picoliter-scale droplets should enable screening campaigns that identify trends in whole-library SAR for large compound collections (>105 members). By integrating controllable and reproducible compound dosing (0.1—10 μM) with incubation and LIF detection, hνSABR represents a key technological advance toward a sustainable next-generation HTS platform.
Acknowledgments
We thank Prof. Bruce Torbett (TSRI) for a gift of plasmid encoding an autolysis-resistant HIV-1 protease mutant. We thank Mr. Christopher Fish (Instrumentation & Design Lab, TSRI) for fabricating custom components for the confocal laser detection system. We thank Mr. Ron Jackson (Kansas State University) for the gift of custom stages for the confocal laser detection system. B.M.P. gratefully acknowledges the support of a NIH Director’s New Innovator Award (OD008535) and the DARPA Fold F(X) Program (N66001-14-2-4057).
Supporting Information Available
The Supporting Information is available free of charge on the ACS Publications website at DOI: 10.1021/acs.analchem.5b04811.
Experimental details and additional results (PDF)
The authors declare no competing financial interest.
Supplementary Material
References
- Hadd A. G.; Raymond D. E.; Halliwell J. W.; Jacobson S. C.; Ramsey J. M. Anal. Chem. 1997, 69, 3407–3412. 10.1021/ac970192p. [DOI] [PubMed] [Google Scholar]
- Song H.; Ismagilov R. F. J. Am. Chem. Soc. 2003, 125, 14613–14619. 10.1021/ja0354566. [DOI] [PMC free article] [PubMed] [Google Scholar]
- Thorsen T.; Maerkl S. J.; Quake S. R. Science 2002, 298, 580–584. 10.1126/science.1076996. [DOI] [PubMed] [Google Scholar]
- Leamon J. H.; Lee W. L.; Tartaro K. R.; Lanza J. R.; Sarkis G. J.; deWinter A. D.; Berka J.; Lohman K. L. Electrophoresis 2003, 24, 3769–3777. 10.1002/elps.200305646. [DOI] [PubMed] [Google Scholar]
- Brouzes E.; Medkova M.; Savenelli N.; Marran D.; Twardowski M.; Hutchison J. B.; Rothberg J. M.; Link D. R.; Perrimon N.; Samuels M. L. Proc. Natl. Acad. Sci. U. S. A. 2009, 106, 14195–14200. 10.1073/pnas.0903542106. [DOI] [PMC free article] [PubMed] [Google Scholar]
- Sun S.; Slaney T. R.; Kennedy R. T. Anal. Chem. 2012, 84, 5794–5800. 10.1021/ac3011389. [DOI] [PubMed] [Google Scholar]
- Abate A. R.; Hung T.; Mary P.; Agresti J. J.; Weitz D. A. Proc. Natl. Acad. Sci. U. S. A. 2010, 107, 19163–19166. 10.1073/pnas.1006888107. [DOI] [PMC free article] [PubMed] [Google Scholar]
- Chabert M.; Dorfman K. D.; Viovy J. L. Electrophoresis 2005, 26, 3706–3715. 10.1002/elps.200500109. [DOI] [PubMed] [Google Scholar]
- Furka Á.; Sebestyen F.; Asgedom M.; Dibo G. Int. J. Pept. Protein Res. 1991, 37, 487–493. 10.1111/j.1399-3011.1991.tb00765.x. [DOI] [PubMed] [Google Scholar]
- Lam K. S.; Salmon S. E.; Hersh E. M.; Hruby V. J.; Kazmierski W. M.; Knapp R. J. Nature 1991, 354, 82–84. 10.1038/354082a0. [DOI] [PubMed] [Google Scholar]
- Houghten R. A. Proc. Natl. Acad. Sci. U. S. A. 1985, 82, 5131–5135. 10.1073/pnas.82.15.5131. [DOI] [PMC free article] [PubMed] [Google Scholar]
- Schullek J. R.; Butler J. H.; Ni Z.-J.; Chen D.; Yuan Z. Anal. Biochem. 1997, 246, 20–29. 10.1006/abio.1996.9958. [DOI] [PubMed] [Google Scholar]
- You A. J.; Jackman R. J.; Whitesides G. M.; Schreiber S. L. Chem. Biol. 1997, 4, 969–975. 10.1016/S1074-5521(97)90305-7. [DOI] [PubMed] [Google Scholar]
- Borchardt A.; Liberles S.; Biggar S.; Crabtree G.; Schreiber S. Chem. Biol. 1997, 4, 961–968. 10.1016/S1074-5521(97)90304-5. [DOI] [PubMed] [Google Scholar]
- Upert G.; Merten C. A.; Wennemers H. Chem. Commun. 2010, 46, 2209–2211. 10.1039/b927017e. [DOI] [PubMed] [Google Scholar]
- Price A. K.; MacConnell A. B.; Paegel B. M. Anal. Chem. 2014, 86, 5039–5044. 10.1021/ac500693r. [DOI] [PMC free article] [PubMed] [Google Scholar]
- Duffy D. C.; McDonald J. C.; Schueller O. J. A.; Whitesides G. M. Anal. Chem. 1998, 70, 4974–4984. 10.1021/ac980656z. [DOI] [PubMed] [Google Scholar]
- Sui G.; Wang J.; Lee C.-C.; Lu W.; Lee S. P.; Leyton J. V.; Wu A. M.; Tseng H.-R. Anal. Chem. 2006, 78, 5543–5551. 10.1021/ac060605z. [DOI] [PubMed] [Google Scholar]
- Siegel A. C.; Bruzewicz D. A.; Weibel D. B.; Whitesides G. M. Adv. Mater. 2007, 19, 727–733. 10.1002/adma.200601787. [DOI] [Google Scholar]
- Lee K. S.; Lee H. L. T.; Ram R. J. Lab Chip 2007, 7, 1539–1545. 10.1039/b709885p. [DOI] [PubMed] [Google Scholar]
- Anna S. L.; Bontoux N.; Stone H. A. Appl. Phys. Lett. 2003, 82, 364. 10.1063/1.1537519. [DOI] [Google Scholar]
- Schneider C. A.; Rasband W. S.; Eliceiri K. W. Nat. Methods 2012, 9, 671–675. 10.1038/nmeth.2089. [DOI] [PMC free article] [PubMed] [Google Scholar]
- Zhang J.; Chung T.; Oldenburg K. J. Biomol. Screening 1999, 4, 67–73. 10.1177/108705719900400206. [DOI] [PubMed] [Google Scholar]
- Bule R. G.; Cervera R. B.; Hsiao C.-M.; Perez-Castillejos R. Emerging Mater. Res. 2013, 2, 181–185. 10.1680/emr.13.00008. [DOI] [Google Scholar]
- Seiffert S.; Dubbert J.; Richtering W.; Weitz D. A. Lab Chip 2011, 11, 966–968. 10.1039/c0lc00594k. [DOI] [PubMed] [Google Scholar]
- Hofmann O.; Wang X.; Cornwell A.; Beecher S.; Raja A.; Bradley D. D. C.; deMello A. J.; Demello J. C. Lab Chip 2006, 6, 981–987. 10.1039/b603678c. [DOI] [PubMed] [Google Scholar]
- Ye H. K.; Gu Z. Y.; Gracias D. H. Langmuir 2006, 22, 1863–1868. 10.1021/la052030r. [DOI] [PubMed] [Google Scholar]
- Frenz L.; Blank K.; Brouzes E.; Griffiths A. D. Lab Chip 2009, 9, 1344–1348. 10.1039/B816049J. [DOI] [PMC free article] [PubMed] [Google Scholar]
- MacConnell A. B.; McEnaney P. J.; Cavett V. J.; Paegel B. M. ACS Comb. Sci. 2015, 17, 518–534. 10.1021/acscombsci.5b00106. [DOI] [PMC free article] [PubMed] [Google Scholar]
- Ahn K.; Kerbage C.; Hunt T. P.; Westervelt R. M.; Link D. R.; Weitz D. A. Appl. Phys. Lett. 2006, 88, 024104. 10.1063/1.2164911. [DOI] [Google Scholar]
- Alluri P. G.; Reddy M. M.; Bachhawat-Sikder K.; Olivos H. J.; Kodadek T. J. Am. Chem. Soc. 2003, 125, 13995–14004. 10.1021/ja036417x. [DOI] [PubMed] [Google Scholar]
- Chen X.; Tan P. H.; Zhang Y.; Pei D. J. Comb. Chem. 2009, 11, 604–611. 10.1021/cc9000168. [DOI] [PMC free article] [PubMed] [Google Scholar]
- Wang X.; Peng L.; Liu R.; Xu B.; Lam K. S. J. Pept. Res. 2005, 65, 130–138. 10.1111/j.1399-3011.2005.00192.x. [DOI] [PubMed] [Google Scholar]
- Doran T. M.; Gao Y.; Mendes K.; Dean S.; Simanski S.; Kodadek T. ACS Comb. Sci. 2014, 16, 259–270. 10.1021/co500030f. [DOI] [PMC free article] [PubMed] [Google Scholar]
- Hintersteiner M.; Kimmerlin T.; Kalthoff F.; Stoeckli M.; Garavel G.; Seifert J.-M.; Meisner N.-C.; Uhl V.; Buehler C.; Weidemann T.; Auer M. Chem. Biol. 2009, 16, 724–735. 10.1016/j.chembiol.2009.06.011. [DOI] [PubMed] [Google Scholar]
- Udugamasooriya D. G.; Dineen S. P.; Brekken R. A.; Kodadek T. J. Am. Chem. Soc. 2008, 130, 5744–5752. 10.1021/ja711193x. [DOI] [PubMed] [Google Scholar]
- Choi J.-W.; Kang D.-K.; Park H.; deMello A. J.; Chang S.-I. Anal. Chem. 2012, 84, 3849–3854. 10.1021/ac300414g. [DOI] [PubMed] [Google Scholar]
- Inglese J.; Auld D. S.; Jadhav A.; Johnson R. L.; Simeonov A.; Yasgar A.; Zheng W.; Austin C. P. Proc. Natl. Acad. Sci. U. S. A. 2006, 103, 11473–11478. 10.1073/pnas.0604348103. [DOI] [PMC free article] [PubMed] [Google Scholar]
Associated Data
This section collects any data citations, data availability statements, or supplementary materials included in this article.


