

Abstract
With burgeoning population and diminishing availability of freshwater resources, the world continues to expand the use of alternative water resources for drinking, and the quality of these sources has been a great concern for the public as well as public health professionals. In vitro bioassays are increasingly being used to enable rapid, relatively inexpensive toxicity screening that can be used in conjunction with analytical chemistry data to evaluate water quality and the effectiveness of water treatment. In this study, a comprehensive bioassay battery consisting of 36 bioassays covering 18 biological endpoints was applied to screen the bioactivity of waters of varying qualities with parallel treatments. Samples include wastewater effluent, ultraviolet light (UV) and/or ozone advanced oxidation processed (AOP) recycled water, and infiltrated recycled groundwater. Based on assay sensitivity and detection frequency in the samples, several endpoints were highlighted in the battery, including assays for genotoxicity, mutagenicity, estrogenic activity, glucocorticoid activity, aryl hydrocarbon receptor activity, oxidative stress response, and cytotoxicity. Attenuation of bioactivity was found to be dependent on the treatment process and bioassay endpoint. For instance, ozone technology significantly removed oxidative stress activity, while UV based technologies were most efficient for the attenuation of glucocorticoid activity. Chlorination partially attenuated genotoxicity and greatly decreased herbicidal activity, while groundwater infiltration efficiently attenuated most of the evaluated bioactivity with the exception of genotoxicity. In some cases, bioactivity (e.g., mutagenicity, genotoxicity, and arylhydrocarbon receptor) increased following water treatment, indicating that transformation products of water treatment may be a concern. Furthermore, several types of bioassays with the same endpoint were compared in this study, which could help guide the selection of optimized methods in future studies. Overall, this research indicates that a battery of bioassays can be used to support decision-making on the application of advanced water treatment processes for removal of bioactivity.
Keywords: Bioassay, in vitro, water treatment, advanced oxidation process, toxicity, recycled water
Graphical abstract
1. Introduction
Global concerns have been raised regarding the impact of complex mixtures of pollutants in water on environmental safety and public health (Schwarzenbach et al., 2006). Despite the rapid development of environmental chemistry analysis methods such as modern mass spectrometry analyses, it remains infeasible to track every pollutant potentially present in water because of limitations in analytical capacity, cost, and time. Many environmental chemicals are not readily identified because of their trace concentration, unknown structure/reaction pathway, or lack of sample preparation and detection methods. Moreover, conventional chemical monitoring cannot provide information about health impacts or account for cumulative effects from complex mixtures of environmental contaminants. Complementary techniques such as in vitro bioassays can provide a high throughput measurement of the potential toxicity of individual chemicals or chemical mixtures and can also indicate the presence of unknown toxic chemicals and have therefore been increasingly applied to water quality assessment over the past two decades (Escher and Leusch, 2012; Liu and Zhang, 2014; Pan et al., 2014; Yang and Zhang, 2014; Yang et al., 2014). Specifically, bioassays can provide measures of the cumulative effects of chemicals that exhibit the same mode of toxic action (MOA) and thus concentration-additive effects (Escher and Hermens, 2002). Bioassays can also be used as a complement to chemical analyses in toxicity identification evaluation (TIE) schemes to address complex environmental problems. Such research has been successfully applied in the exploration of several important environmental pollutants, including polyaromatic hydrocarbons (Khim et al., 1999; Qiao et al., 2006) and estrogenic compounds (Furuichi et al., 2004; Snyder et al., 2001).
Due to the exceeding complexity of environmental samples, no single bioassay could represent all potential pathways of bioactivities in these mixtures. Therefore, government agencies such as the Environmental Protection Agency (EPA) and the Food and Drug Administration (FDA) as well as other professionals have devised programs to push forward the development of bioanalytical technology needed to screen thousands of chemicals for potential toxicity, and to develop cost-effective approaches for prioritizing thousands of chemicals targeted for toxicity evaluation (Collins et al., 2008; Hartung and Daston, 2009; Kavlock and Dix, 2010; NRC, 2007; Shukla et al., 2010; Snyder, 2014). Traditional in vivo bioassays have a number of drawbacks such as loss of animal lives, high biological variability, cost, complexity, and long durations, making them particularly poorly suited for routine environmental monitoring. Consequently, there has been a shift toward development of batteries of more rapid, less expensive and relatively simple in vitro bioassays for water quality screening (Escher et al., 2014; Leusch et al., 2014).
Furthermore, environmental waters are a “cocktail” of chemicals, containing a potentially vast number of natural or synthetic contaminants that could persist through conventional wastewater treatment and ultimately enter surface waters via effluent discharges. Increasingly, water providers are considering alternative water resources, such as recycled water for potable reuse applications (Asano and Levine, 1996; Leverenz et al., 2011; Solley et al., 2010). Water reuse often utilize advanced oxidation processes (AOPs), including ultraviolet light (UV) with hydrogen peroxide and ozone-based technologies. While AOPs have been proven to effectively break down many organic contaminants in water (Gerrity et al., 2011; Martijn and Kruithof, 2012; Pisarenko et al., 2012; Rosario-Ortiz et al., 2010), several studies have also shown that those technologies typically cannot completely remove contaminants and may also produce transformation products of generally unknown structure and toxicity. Therefore, additional information is still needed about the efficiency for each of these processes for attenuating bioactivity and possible toxic effects of transformation products generated by these oxidative technologies. To evaluate the potential toxicity of mixtures of micropollutants in water, an integrated assessment using a battery of in vitro bioassays with various endpoints is necessary. The result of the integrated bioassay battery could also help to identify the presence of groups of chemicals with various MOAs, thus providing information that can improve risk assessment methods and inform future water reclamation and management options. In this study, representative water samples were evaluated, including two wastewater treatment plant (WWTP) effluents, five parallel AOP-treated reclaimed water samples, and two groundwater samples supplied by infiltration of wastewater effluents. These water samples were subjected to a battery of 36 in vitro bioassays covering a wide range of MOAs, including xenobiotic metabolism, specific receptor-mediated effects, reactive toxicity and adaptive stress responses, as well as general cytotoxicity. The efficacy of bioactivity attenuation was compared between different water recycling methods. Furthermore, the performance such as the sensitivity of several different assays with the same endpoint was also compared. The results provide an overview of the mixture effects of micropollutants and their removal during treatment representing the most commonly employed water recycling systems in the USA. The methods developed and optimized also serve as a guide for future water quality screening efforts and for assessment of new water treatment technologies.
2. Experimental Section
2.1. Sample preparation
Nine grab samples (4 L) were collected between February and April 2012 from two WWTPs in Pima County, Arizona, US. Both of the municipal wastewater treatment plants consist mainly of clarifiers, biological treatment and chlorination as shown in Fig. 1. Green Valley WWTP secondary effluent (“GV Sec”) served as the source water for an AOP pilot plant (Xylem Inc., Germany) at a flow rate of 2,000 L/h. Grab samples were collected from the pilot plant at the end of each of the four treatment units, including UV (500 mJ/cm2; “UV”), ozone (3.0 mg/L, “O3”), ozone/UV (3.0 mg/L O3 followed by 500 mJ/cm2 UV; “O3/UV”), and UV/H2O2 (UV 500 mJ/cm2, 10 mg/L H2O2; “UV/H2O2”). The WWTP secondary effluent after chlorination (10 mg/L Cl2 with 2 h contact time, “Cl2”) was also collected (Fig. 1). To evaluate the bioactivity of municipal wastewater effluent that is subsequently infiltrated using soil aquifer treatment (SAT), effluent was also collected from the Roger Road Wastewater Reclamation Facility (“RR Eff”), and from two monitoring wells after infiltration (“TW1”, which was located after a few weeks of travel time, and “TW2” which is very close to initial zone of infiltration). A MilliQ water field blank (“FB”) was also collected alongside the samples.
Fig 1.
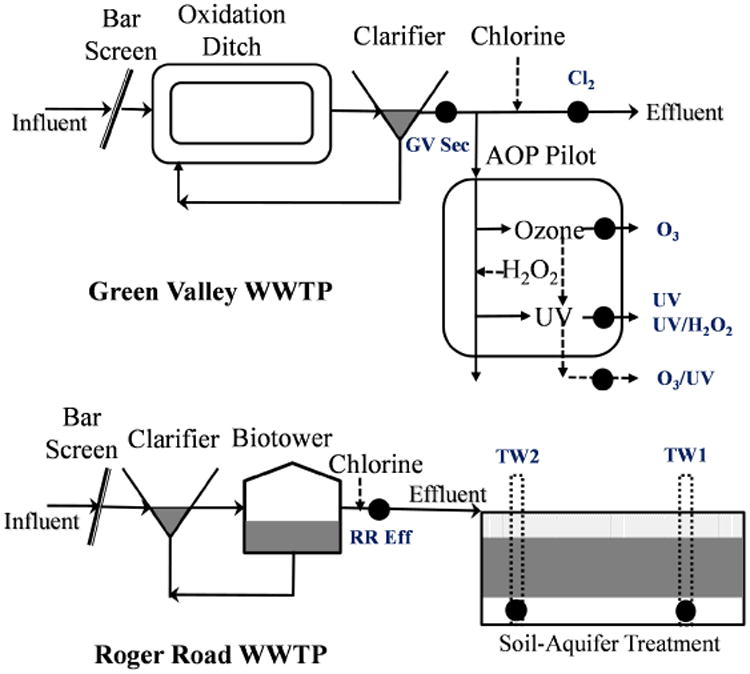
Treatment process and sampling point at two WWTPs, Tucson, US. (Black dots indicate where the grab samples were collected)
Upon collection, samples containing chlorine (i.e., Cl2 and RR Eff) were quenched immediately with sodium thiosulfate (50 mg/L). Every water sample was treated with sodium azide (1 g/L) as a preservative to inhibit microbial activity (Vanderford et al., 2011) and then stored at 4 °C until extraction (within one week). Solid phase extraction (SPE) was performed according to a previously published method (Leusch et al., 2014). In brief, after filtration (GF/A, Whatman), 1 L of each sample was passed through two tandem solid phase cartridges, Oasis HLB (500mg/6cc, Waters) followed by coconut charcoal (2g/6cc, Supelco), which were both preconditioned with 10 mL of acetone:hexane (1:1, v/v), 10 mL of methanol and 10 mL of MilliQ water. After rinsing with 10 mL of MilliQ water, the cartridges were dried under vacuum for 2 h and individually eluted with 10 mL of methanol and 10 mL of acetone:hexane (1:1, v/v). Eluates from the two SPE cartridges were then combined and evaporated under a gentle stream of nitrogen. Finally, evaporated eluates were reconstituted to 1 mL with methanol and shared among the collaborating laboratories. An aliquot each sample was further concentrated and the solvent changed to DMSO, depending on each particular assay's requirements.
2.2. Selection of bioassay battery
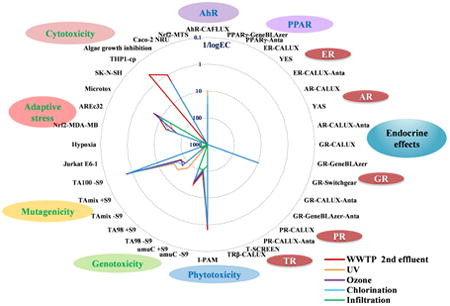
In total, 36 different bioassays were conducted in this study (Table 1). The bioassay battery encompassed five MOA classes (Escher and Leusch, 2012) and were selected based on fully or partially validated for water quality assessments, or to explore new pathways of potential human health concern. The battery included in vitro bioassays based on mammalian, bacteria, and yeast cells. Reporter gene assays were most abundantly used because of their higher throughput, greater sensitivity, and specificity in MOA. Specifically, the peroxisome proliferator-activated receptor (PPARγ), which regulates glucose and lipid metabolism, and arylhydrocarbon receptor (AhR), where the cytochrome P450 monooxygenase (CYP) metabolic enzymes were activated by dioxin-like compounds, were selected as bioassays indicative of toxicokinetic processes (xenobiotic metabolism). Assays specific to estrogenic, androgenic, glucocorticoid, progesterone and thyroid activity were included in both agonistic and antagonistic modes to evaluate potential endocrine activity. Cell-based nuclear reporter gene assays were conducted alongside traditional yeast two-hybrid assay (i.e., ER-CALUX vs YES, AR-CALUX vs YAS) and cell proliferation assay (i.e., TR-CALUX vs T-SCREEN) with the same endpoint as a comparison on their sensitivity and selectivity. Activation and detection of adaptive stress response pathways were assessed through oxygen depletion (hypoxia response), oxidative stress (Nrf2-Keap-ARE32 pathway), and an osmotic stress assay (Jurkat cell line). Mutagenicity and genotoxicity were evaluated using AmesII and umuC assays, respectively. Finally, non-specific cell toxicity (cytotoxicity) was measured by assessing cell growth/survival within various assay endpoints, including neutral red uptake (NRU), other common cell viability test (i.e., MTS), and bacteria bioluminescence inhibition (Microtox). Toxicity at the system level was also assessed to a limited extent by determining cytotoxicity in neuroblastoma cells (SK-N-SH) as an indication of neurotoxicity and cytokine production in a monocyte cell line (THP1) as an indication of immunotoxicity. All experiments were performed as described in (Escher et al, 2014) and in the references given in Table 1.
Table 1.
Bioassay evaluation and summary of active water samples.
| Endpoint | Bioassay | Method reference | Reference chemical | Assay evaluation by reference chemical | EC50 value in literature | Assay response within samples | Number of samples showed positive response in 2 WWTP effluents | Number of samples showed positive response in 7 treated samples |
|---|---|---|---|---|---|---|---|---|
| Xenobiotic metabolism | ||||||||
| AhR receptor | AhR CAFLUX | (Jin et al., 2013; Nagy et al., 2002) | TCDD | EC10 (0.65 pM); EC50 (8.0 pM) | 24.8 pM (Macova et al., 2010) | + | 2 | 5 |
| Peroxisome | PPARγ-GeneBLAzer | (US EPA, 2012) | Rosiglitazone | EC10 (0.33 nM); EC50 (3.9 nM) | 3.7 nM (Invitrogen, 2007b) | - | 0 | 0 |
| PPARγ-GeneBLAzer-Anta | (Huang et al., 2011; US EPA, 2012) | GW9662 | ECSR0.2 (3.0 nM); ECSR0.5 (8.4 nM) | 3.5 nM (Invitrogen, 2007b) | - | 0 | 0 | |
| Specific modes of action | ||||||||
| Estrogenic effects | ER-CALUX | (Van der Linden et al., 2008) | 17β-Estradiol | EC10 (0.75 pM); EC50 (6.0 pM) | 6 pM (Legler et al., 1999), 2 pM (Leusch et al., 2010) | - | 0 | 0 |
| YES | (Escher et al., 2008b; Routledge and Sumpter, 1996) | Ethinylestradiol | EC10 (480 pM); EC50 (1700 pM) | 800 pM (Conroy et al., 2007), 370 pM (Leusch et al., 2010) | + | 1 | 0 | |
| ER-CALUX-Anta | (Leusch et al., 2014) | Tamoxifen | ECSR0.2 (1.5 nM); ECSR0.5 (3.7 nM) | n/a | - | 0 | 0 | |
| Androgenic effects | AR-CALUX | (Van der Linden et al., 2008) | Dihydrotestosterone | EC10 (0.1 nM); EC50 (1.0 nM) | 0.13 nM (Sonneveld et al., 2005) | - | 0 | 0 |
| YAS | (Sohoni and Sumpter, 1998; Thomas et al., 2002) | Testosterone | EC10 (4.1 nM); EC50 (9.6 nM) | 3 nM (Conroy et al., 2007) | - | 0 | 0 | |
| AR-CALUX-Anta | (Leusch et al., 2014) | Flutamide | ECSR0.2 (1.1 μM); ECSR0.5 (3.6 μM) | 0.45 μM (van der Burg et al., 2010) | - | 0 | 0 | |
| Glucocorticoid effects | GR-CALUX | (Van der Linden et al., 2008) | Dexamethasone | EC10 (0.8 nM); EC50 (3.7 nM) | 0.37 nM (Sonneveld et al., 2005) | - | 0 | 0 |
| GR-GeneBLAzer | (Huang et al., 2011; US EPA, 2012) | Dexamethasone | EC10 (0.6 nM); EC50 (2.5 nM) | 1.8 nM (Invitrogen, 2007a) | - | 0 | 0 | |
| GR-Switchgear | (Switchgear, 2010a) | Dexamethasone | EC10 (0.5 nM); EC50 (2.6 nM) | n/a | + | 2 | 2 | |
| GR-CALUX-Anta | (Van der Linden et al., 2008) | Mifepristone | ECSR0.2 (2.9 nM); ECSR0.5 (6.0 nM) | n/a | - | 0 | 0 | |
| GR-GeneBLAzer-Anta | (Escher et al., 2014) | Mifepristone | ECSR0.2 (0.1 nM); ECSR0.5 (0.4 nM) | 0.16 nM (Invitrogen, 2007a) | - | 0 | 0 | |
| Progestagenic effects | PR-CALUX | (Van der Linden et al., 2008) | Levonorgestrel | EC10 (0.3 nM); EC50 (5.7 nM) | n/a | - | 0 | 0 |
| PR-CALUX-Anta | (Sonneveld et al., 2005) | Mifepristone | ECSR0.2 (20 pM); ECSR0.5 (78 pM) | n/a | - | 0 | 0 | |
| Thyroid effects | T-SCREEN | (Gutleb et al., 2005) | Triiodothyronine | EC10 (280 pM); EC50 (740 pM) | 191 pM (Gutleb et al., 2005) | - | 0 | 0 |
| TRβ-CALUX | (Leusch et al., 2014) | Triiodothyronine | EC10 (8.6 pM); EC50 (86 pM) | n/a | - | 0 | 0 | |
| Phytotoxicity (photosynthesis inhibition) | I-PAM | (Escher et al., 2008a) | Diuron | EC10 (2.3 nM); EC50 (6 nM) | 68.6 nM (Macova et al., 2010), 12.8 nM (Escher et al., 2008a) | + | 2 | 7 |
| Reactive modes of action | ||||||||
| Genotoxicity | umuC -S9 | (ISO13828, 1999; Oda et al., 1985) | 4-NQO | ECIR1.5 (63.5 nM) | n/a | + | 2 | 7 |
| umuC +S9 | (ISO13828, 1999; Oda et al., 1985) | 2-Aminoanthracene | ECIR1.5 (0.29 μM) | n/a | + | 2 | 7 | |
| Mutagenicity | TA98 -S9 | (Heringa et al., 2011; Umbuzeiro et al., 2010) | 4-NQO | ECRR1.5 (n/a)* | n/a | + | 1 | 0 |
| TAmix -S9 | (Heringa et al., 2011) | 4-NQO | ECRR1.5 (n/a)* | n/a | + | 1 | 1 | |
| TA98 +S9 | (Heringa et al., 2011; Umbuzeiro et al., 2010) | 2-Aminoanthracene | ECRR1.5 (n/a)* | n/a | + | 2 | 5 | |
| TAmix +S9 | (Heringa et al., 2011) | 2-Aminoanthracene | ECRR1.5 (n/a)* | n/a | + | 2 | 5 | |
| TA100 -S9 | (Reifferscheid et al., 2012) | 2-Nitrofluorene | ECRR1.5 (66 μM) | n/a | + | 2 | 6 | |
| Induction of adaptive stress response pathways | ||||||||
| Osmotic stress | Jurkat E6-1 | (Escher et al., 2014) | PMA | EC10 (3 nM); EC50 (20 nM) | n/a | + | 1 | 0 |
| Adaptive stress | Hypoxia-Switchgear | (Switchgear, 2010b) | Desferrioxamine | ECIR1.5 (7.5 μM) | n/a | - | 0 | 0 |
| Oxidative stress | Nrf2-MDA-MB | (Wang et al., 2008; Zhang, 2006) | tBHQ | ECIR1.5 (33 μM) | n/a | - | 0 | 0 |
| AREc32 | (Escher et al., 2012; Wang et al., 2006) | tBHQ | ECIR1.5 (1.7 μM) | 1.32 μM (Escher et al., 2012) | + | 2 | 5 | |
| General cytotoxicity and modes of system response | ||||||||
| Bacterial cytotoxicity | Microtox | (Tang et al., 2013) | Phenol | n/a | n/a | + | 2 | 7 |
| Neurotoxicity | SK-N-SH | (Manger et al., 2003) | DMSO | EC10 (0.11 M); EC50 (0.38 M) | n/a | - | 0 | 0 |
| Immunotoxicity | THP1-cp | (Leusch et al., 2014) | Dexamethasone | EC10 (2.1 nM); EC50 (45 nM) | 2.7 nM (Leusch et al., 2014) | + | 1 | 1 |
| Algae growth inhibition | Algae Growth Inhibition | (Escher et al., 2008a) | Diuron | EC10 (7 nM); EC50 (25 nM) | 135 nM (Escher et al., 2008a) | + | 2 | 7 |
| Human cellular Cytotoxicity | Caco-2 NRU | (Leusch et al., 2014) | Methanol | EC10 (0.4 M); EC50 (2.3 M) | n/a | - | 0 | 0 |
| Nrf2-MTS | (Escher et al., 2012) | tBHQ | EC10 (103 μM); EC50 (178 μM) | 46 μM (Escher et al., 2012) | - | 0 | 0 | |
Abbreviations used: TCDD = 2,3,7,8-TCDD; 4-NQO = 4-Nitroquinoline N-oxide; PMA = Phorbol-12-myristate-13-acetate; tBHQ = tert-Butylhydroquinone; DMSO = Dimethylsulfoxide. n/a = Data not available.
the data was not available in TA98 and TAmix mutagenicity assay in this study, because only 2 dose points of positive control were applied in each plate due to operatical limit.
2.3. Data evaluation
Data processing was described in detail in a recent study (Escher et al., 2014), and more details are also provided in the supplementary data. In brief, the concentrations of samples were expressed as relative enrichment factors (REF), which can be derived by the enrichment factor of the sample extraction multiplied by the dilution factor of the extract in each of the assay.
The bioactivity as %effect was obtained by dividing the sample response by the maximum response at the same experimental day after subtracting background signal (control) (Eq-1). The control signal refers to unexposed cells, or, if samples were dosed in solvents, the solvent control.
| (1) |
EC10 was defined as the sample REF causing 10% effect and it can be calculated from the nonlinear regression fit if a full concentration-effect curve was observed. Alternatively, if there is no full concentration-effect curve, the EC10 was calculated from the slope of the linear range of the sample concentration-effect curve (up to 25% of maximum effect) (Eq-2).
| (2) |
In antagonist mode, the effect was expressed as suppression ratio (SR):
| (3) |
ECSR0.2 was defined as the sample REF causing 20% of effect suppression, and similar with EC10, it is calculated directly according to 50% effect concentration (ECSR0.5) and the hill slope (s) if a full concentration-effect curve exists (Eq-4), or from the slope of the linear regression (up to 0.3 of suppression) if no full concentration-effect curve can be obtained (Eq-5).
| (4) |
| (5) |
The induction ratio (IR) was used as a measure of effect in those bioassays where no maximum response could be obtained (i.e., umuC, Nrf2-MDA-MB and AREc32). The IR is the ratio of the measured signal, e.g., absorbance, relative fluorescence unit (RLU), or relative light unit (RFU), to its control value (Eq-6), and the ECIR1.5 (Eq-7) is the sample REF causing an induction ratio of 1.5, which was derived from the linear concentration-effect curve up to an IR of 5, i.e., the linear range of the concentration-effect curve (Escher et al, 2014).
| (6) |
| (7) |
Detailed data transformation is also provided in the supplementary data.
In this study, the ECIR1.5 evaluation was used in the mutagenicity assay, genotoxicity assay, and oxidative stress response assay. For AmesII mutagenicity test, the numbers of revertant were used for calculation thus ECRR1.5 was utilized as the expression, where RR is the revertant ratio.
Bioanalytical equivalent concentrations (BEQ) were calculated from the EC10 or ECIR1.5 of the assay-specific reference compound divided by the EC values from the sample (in unit of REF) using the following equation (Eq-8):
| (8) |
Known highly potent bioactive compounds were selected as positive controls as well as reference compounds in each assay. For Caco-2 and SK-N-SH cytotoxicity test, the carrier solvents (MeOH for Caco-2 and DMSO for SK-N-SH) were used as the positive control. The cell viability test of Nrf2-MDA-MB (Nrf2-MTS) was conducted alongside the assay, and thus the same reference compound as the assay was used which was similar to a previous process (Escher et al., 2012).
The efficiency of treatment was then evaluated according to the sample BEQ, which can simply derived from the EC values before and after treatment (Eq-9):
| (9) |
If EC(after treatment) was higher than EC(before treatment), the sample bioactivity decreased during treatment, and the BEQ reduction is a positive value (i.e., removal of bioactive chemicals); in contrast, if the value was negative, BEQ increased, EC decreased, and more toxic transformation byproducts may have been formed after treatment.
3. Results and Discussion
3.1. Performance of the bioassay battery
The detailed assay evaluation and detection results are provided in Table 1 as well as Table S1 in the supplementary data. In most assays in the battery, the effect concentrations (EC10, ECSR0.2, ECIR1.5 or ECRR1.5) of the reference compounds were in nanomolar concentrations or less, which indicate good sensitivity and make them plausible to be applied in environmental water samples where most compounds occur at trace levels. The EC50 concentrations of reference compounds were comparable with previous reported data for all bioassays, suggesting the robustness of in vitro assays (Table 1). For the same endpoint, the sensitivity was dependent on specific cell lines. For example, the sensitivity of GR-CALUX assay was comparable with the GR-Switchgear and GR-GeneBLAzer assays. However, the sensitivity of the human cell line nuclear receptor assay was much higher than yeast based assay (ER-CALUX vs YES, AR-CALUX vs YAS), which was also consistent with a previous study (Leusch et al., 2010). The result suggests human cell-based assays may be a more preferable choice in the future where sensitivity is critical, such as in drinking and recycled water monitoring. For oxidative stress, the Nrf2-MDA-MB assay (ECIR1.5: 33 μM) was one order of magnitude less sensitive than the AREc32 (ECIR1.5: 1.7 μM). Also, the sensitivity of T-SCREEN and TRβ-CALUX varied by one to two orders of magnitude. Overall, this study showed that the sensitivity between different bioassays varied largely and the result of this inter-assay comparison could guide future studies in bioassay selection. Different assays may be suitable under different conditions and drivers depending on their characteristics. For example, yeast-based assays, while less sensitive, are significantly easier and cheaper to run than mammalian-based assays (Leusch et al., 2010), and may be more suitable to high throughput testing of secondary treated wastewater, while the higher sensitivity of mammalian-based assays make them preferable for monitoring high quality water samples, such as drinking or recycled water. However, it should be noted that different assays were conducted in different laboratories, which inherently includes some inter-laboratory variability. It also should be noted that the sample activity is determined not only by the assay's intrinsic sensitivity, but also by the concentration of chemicals in a given sample and how much they were enriched by sample pretreatment (such as SPE). When testing highly treated water samples, efforts should also be made to achieve the highest sample enrichment possible (i.e., highest REF), while ensuring that there is no cytotoxicity from the solvent and the sample. Depending on cell type, the maximum allowable solvent exposed to the cells is generally 0.1% of methanol or 5% of DMSO.
3.2. Effects detected in water samples
Of the 36 bioassays applied, 16 showed response in at least one of the nine water samples tested (Table 1 and Table S1). No significant responses were detected in laboratory or field blanks (Table S1). Eight different endpoints including AhR receptor (AhR-CAFLUX), glucocorticoid effects (GR-Switchgear), algae photosynthesis inhibition (I-PAM), genotoxicity (umuC), mutagenicity (TAmix, TA100, and TA98), oxidative stress (AREc32), and bacteria/algae cytotoxicity (Microtox and algae growth inhibition) showed responses in both of the effluents from municipal wastewater treatment plants (Fig. S1). These results are consistent with a previous study of three Australian WWTPs (Escher et al., 2014; Tang et al., 2014). After different water treatment processes, biological activity was still present in at least 5 out of 7 samples except GR activity (2 out of 7), suggesting current treatment cannot completely remove the chemicals responsible for these biological effects. Detailed EC values and the BEQ reduction in different treatments are compiled in Table 2.
Table 2.
Summary of sample effect concentration (EC, expressed as relative enrichment factor REF) and BEQ reduction/increase values (%) compared to the influent (“GV Sec” or “RR Eff”) in all tested treatments in the subset of bioassays that showed activity in one or more samples (for description of sampling sites see Figure 1).
| Bioassay | FB a | GV Sec | UV | UV/H2O2 | O3 | O3/UV | Cl2 | RR Eff | Infiltration | ||
|---|---|---|---|---|---|---|---|---|---|---|---|
| TW1 | TW2 | ||||||||||
| AhR CAFLUX | EC (REF) | >100 | 31 | 10 | 31 | 32 | 51 | 16 | 6.1 | >100 | >100 |
| BEQ reduction | (198) b | 0 | 3 | 39 | (94) | >94 c | >94 | ||||
| YES | EC (REF) | >200 | >200 | >200 | >200 | >200 | >200 | >200 | 82 | >200 | >200 |
| BEQ reduction | >59 | >59 | |||||||||
| GR-Switchgear | EC (REF) | >20 | 10 | >20 | >20 | 12 | >20 | 9.5 | 8.1 | >20 | >20 |
| BEQ reduction | >50 | >50 | 17 | 50 | (6) | >59 | >59 | ||||
| I-PAM | EC (REF) | >333 | 0.65 | 1.0 | 0.4 | 1.0 | 0.7 | 1.0 | 2.0 | 150 | 170 |
| BEQ reduction | 35 | (63) | 35 | 7 | 35 | >99 | >99 | ||||
| umuC -S9 | EC (REF) | >139 | 100 | 75 | 60 | 90 | 42 | 120 | 50 | 105 | 110 |
| BEQ reduction | (35) | (68) | (12) | (140) | 16 | 52 | 55 | ||||
| umuC +S9 | EC (REF) | >139 | 31 | 23 | 13 | 27 | 22 | 42 | 105 | 110 | 130 |
| BEQ reduction | (35) | (138) | (15) | (41) | 26 | 5 | 19 | ||||
| TA98 -S9 | EC (REF) | >100 | >100 | >100 | >100 | >100 | >100 | >100 | 30 | >100 | >100 |
| BEQ reduction | >70 | >70 | |||||||||
| TA98 +S9 | EC (REF) | >100 | >100 | 72 | >100 | >100 | >100 | >100 | 3.5 | >100 | >100 |
| BEQ reduction | >(39) | >97 | >97 | ||||||||
| TAmix -S9 | EC (REF) | >100 | 83 | 35 | 69 | 59 | 48 | 69 | 8.5 | >100 | >100 |
| BEQ reduction | (137) | (20) | (41) | (73) | (20) | >92 | >92 | ||||
| TAmix +S9 | EC (REF) | >100 | 66 | 36 | >100 | 75 | 55 | 48 | 29 | >100 | 84 |
| BEQ reduction | (83) | >34 | 12 | (20) | (38) | >71 | 65 | ||||
| TA100 -S9 | EC (REF) | >20 | 0.6 | 0.8 | 0.5 | 0.7 | 0.5 | 0.7 | 2.7 | >20 | 4.8 |
| BEQ reduction | 25 | (20) | 14 | (20) | 14 | >87 | 44 | ||||
| AREc32 | EC (REF) | >160 | 22 | 43 | 30 | 60 | 67 | 30 | 12 | >160 | >160 |
| BEQ reduction | 49 | 27 | 63 | 67 | 27 | >93 | >93 | ||||
| Microtox | EC (REF) | 54 | 7.1 | 25 | 47 | 4.7 | 9.0 | 9.7 | 4.1 | 9.6 | 12 |
| BEQ reduction | 71 | 85 | (51) | 21 | 27 | 57 | 67 | ||||
| Algae growth inhibition | EC (REF) | >333 | 1.0 | 2.1 | 7.0 | 2.0 | 0.7 | 2.0 | 3.2 | >333 | >333 |
| BEQ reduction | 52 | 86 | 50 | (43) | 50 | >99 | >99 | ||||
FB = Field Blank.
(), negative value, which indicate the BEQ increased after treatment.
>, the BEQ reduction was calculated based on the maximum applied REF where no bioactivity was observed, indicating the minimum BEQ reduction the treatment can achieve.
3.2.1. Xenobiotic metabolism
The PPARγ-GeneBLAzer assay showed no response in either agonist or antagonist mode, while the AhR-CAFLUX assay showed positive response in all samples except infiltrated groundwater samples (TW1 and TW2) with EC10 values ranging from 6.1 to 51 REF (Table 2 and Table S1). RR Eff had the highest activity (EC10 of 6.1 REF) among all of the test samples. In contrast, TW1 and TW2 did not yield any positive responses at an REF up to 100, indicating infiltration processes were able to significantly reduce the AhR activity (>94%). Similarly, EC values between GV Sec and the AOP treated samples suggested that UV, oxidation and chlorination had limited effect on AhR removal (<39%). TCDD equivalent in the two effluents was 6.8 and 34 pg/L and ranged from 4.1 to 21 pg/L in subsequent AOP-treated samples (Table S1), which demonstrates limited attenuation through the treatment processes. The AhR activity in this research was slightly lower than the activity reported in municipal wastewater effluent in Australia (TCDD-EQ 0.59-0.98 ng/L) (Macova et al., 2010); however, the EC10 concentrations were comparable with a recent Australia study (Escher et al., 2014). The BEQs were comparable with Chinese WWTP effluents (<14 pg/L TCDD-EQ) (Ma et al., 2005). A slight increase in activity was observed after chlorination and UV treatment, which likely was caused by transformation products formed during treatment. For instance, it has been reported that the commonly used antimicrobial triclosan can form dioxin-like structures during chlorination (Buth et al., 2011). The Ah receptor is not only activated by known polycyclic aromatic hydrocarbon (PAHs) and polychlorinated biphenyls (PCBs), but also a big range of structurally divergent chemicals including numerous waterborne chemicals (Denison and Nagy, 2003; Martin et al., 2010), which have potential for carcinogenicity (Nagy et al., 2002). The results in this study show that future assessment for AhR activity change during water treatment is warranted.
3.2.2. Specific modes of action
Of the five endocrine nuclear receptors evaluated, only the estrogen and the glucocorticoid receptors were activated by some of the water samples in some of the assays. Only one sample (RR Eff) was found to be estrogenic using the YES assay, with an EC10 value of 82 REF. This translates into an EE2-EQ concentration of 1.7 ng/L. In comparison, the ER-CALUX assay did not detect estrogenicity in any of the samples (including that particular sample), which would suggest an EEQ of <0.2 ng/L. This is below a recently derived safe bioassay threshold concentration of 0.2 ng/L (Jarošová et al., 2014; Jarosova et al., 2014), suggesting that all water samples are unlikely to induce negative ecological effects if discharged. It is unclear why the YES result for the RR Eff sample is so high, although previous studies have shown the yeast assays to be particularly sensitive to alkylphenols (Leusch et al., 2010), which are commonly found in wastewater samples (Soares et al., 2008). It is therefore possible that the higher response in the YES assay is due to the presence of alkylphenols in these wastewater effluent samples.
The ER-CALUX samples were tested at a maximum REF of 1 due to conservative consideration of solvent toxicity in the assay (which limited how much sample could be added). This comparatively low REF somewhat limited the overall sensitivity of the method and future work should identify if higher solvent concentration can be used in the CALUX assay, which would improve the overall method detection limit.
It should be mentioned that this study also applied the E-SCREEN assay, and it reported positive responses in 4 out of the 9 samples evaluated. Due to high variability, the results had to be excluded from this paper as they failed quality control. It is interesting to note, however, that the E-SCREEN results showed the same tendencies as the ER-CALUX results. Estrogenicity has been studied in aquatic system for the past two decades, and it has been reported in WWTP effluents worldwide. Despite the low frequency of detection in this study, it remains a highly relevant endpoint and should always be considered in water quality assessment.
Glucocorticoid activity was detected by only one of the three GR cellular assays (GR-Switchgear). Considering their similar sensitivity for the reference compound dexamethasone (Table 1), it is most likely that the difference in detection is due to the comparatively low REF applied for operational reasons in GR-CALUX and GR-GeneBLAzer compared with GR-Switchgear (Table S1). In the GR-Switchgear assay, four out of nine tested samples showed glucocorticoid-activity including GV Sec, O3, Cl2 and RR Eff, with the EC10 ranging from 8.1 to 12 REF, and dexamethasone equivalent (Dex-EQ) concentrations ranging from 16-24 ng/L. UV-based technology (including O3/UV and UV/H2O2) and infiltration appeared to be the most efficacious treatment for GR activity attenuation with no activity detected after these treatments. Several glucocorticoid compounds have been detected in municipal wastewater effluents in China (Chang et al., 2007) and the Netherlands (Schriks et al., 2010; Van der Linden et al., 2008), with concentrations of 0.13-1.9 ng/L and 14 ng/L, respectively. Glucocorticoid activity was also reported within hospital wastewater, industry wastewater, WWTP effluent and surface waters (Escher et al., 2014; Schriks et al., 2010; Stavreva et al., 2012) with Dex-EQ reported as 38 ng/L in WWTP effluent through the GR-CALUX assay (Schriks et al., 2010). There are still far fewer studies on the occurrence and impact of glucocorticoid-active substances in the environment compare with estrogenic effects.
Other hormone pathways including androgen, progesterone, and thyroid effects were not observed in any of the water samples, which might be partly due to the low REF used (maximum REF of 1). In contrast, several recent studies have observed a strong anti-androgen effect of the effluent from WWTPs and several possible targeted compounds have been identified using effect-directed analysis (Rostkowski et al., 2011), and progesterone activity has been reported in Australian treated sewage (Leusch et al., 2014). To observe these effects, changes to the sample dosing in the bioassay protocols may be needed to concentrate the samples further, and further sample cleanup prior to dosing might also be necessary to avoid masking by cytotoxicity.
In all of the test samples, the EC10 of algae photosynthesis inhibition effect (I-PAM) was between 0.4 (UV/H2O2) and 170 REF (TW2), with the diuron-EQ ranging from 0.003 μg/L (TW2) to 1.3 μg/L (UV/H2O2). No treatment method except infiltration in this study significantly reduced I-PAM activity. Herbicides are already well-known to impact algae photosynthesis (Muller et al., 2008), and many of them are listed in the US EPA “list of contaminants and their maximum contaminant level” for drinking water regulations (USEPA, 2009). Mixture experiments have also indicated that in water samples the herbicides typically dominate the algal photosynthesis inhibition even if non-specifically acting organic compounds can also trigger those effects (Tang and Escher, 2014). These data show that I-PAM activity can be a useful tool for system phytotoxicity.
3.2.3. Reactive modes of action
Both the mutagenicity and genotoxicity assays rely upon Salmonella typhimurium bacteria strains; however, the umuC assay is related to DNA damage repair (Oda et al., 1985) and the Ames test to mutations (Ames et al., 1975). Three different strains were used with the AmesII assay, including TA98 (frameshift mutation), TA100 (base-pair substitution), and TAmix (a 6-strain mixture from TA7001 to TA7006, indicating different location of base-pair substitution). The bacteria strain TA1535 [pSK1002] was used for the umu/SOS reaction. In addition, rat liver metabolic enzyme S9 fractions were applied for umuC, TA98, and TA mixture assays to compare the sample toxicity before and after metabolic activation of organic contaminants present within water extracts.
No positive results were observed in most of the test samples except RR Eff and UV for TA98 assay with and without the addition of S9 fraction (Table 2). The ECRR1.5 in RR Eff was 30 with TA98 without S9 and decreased to 3.5 with S9 activation, suggesting some of the compounds have higher toxicity after metabolic activation. Mutagenic responses were prevalently found in both of TA100 and TAmix strains, which target different location of base-pair substitution. The ECRR1.5 of TA100 was much lower than TAmix, suggesting that TA100 has a higher sensitivity than TAmix in detecting mutagenicity for environmental samples, and this is possibly due to a diluted strain density of TAmix compared with pure strain TA100. With TA100 without S9, all test samples except TW1 showed mutagenicity at very low REF from 0.5 to 4.8, while in TAmix the ECRR1.5 ranged from 8.5 to 83 REF. The results suggest that TA100 may be a useful strain for base-pair substitution detection in the future mutagenicity test. The results in TA100 and TAmix also suggested that providing enough retention time in SAT would help for mutagenicity removal, when we were comparing the results in TW2 which was more close to the infiltration start point with TW1, where water had gone through four recharge basins (Table 2).
All tested samples showed umuC response with the ECIR1.5 value ranged from 42-120 and 13-130 REF in the absence or presence of S9, respectively. The role of in vitro S9 metabolic activation appeared to be sample/site dependent in the mutagenicity and genotoxicity test. An increase of genotoxicity was generally observed in all samples originating from GV with the addition of S9; while for RR Eff and its downstream infiltrated TW1 and TW2, samples showed more genotoxicity without the S9 activation (Fig. 2b). While in TAmix mutagenicity test, fewer effects were observed for S9 bioactivation (Fig. 2a). These differences point to a different chemical composition of water samples as well as the different targeting chemicals in these two assays which requires future chemical verification.
Fig 2.
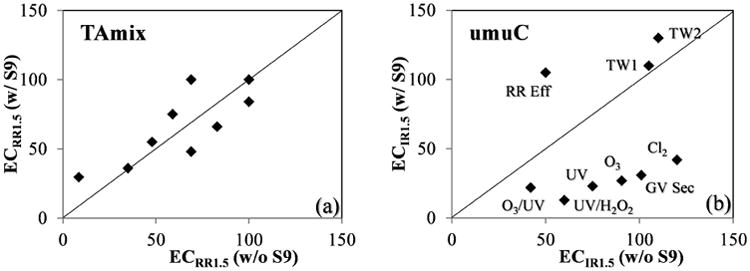
Comparison of the effect of S9 metabolic activation in mutagenicity and genotoxicity tests. (a) in AmesII TAmix strain. (b) in umuC TA1535 strain.
The result also showed that few treatment methods except infiltration could effectively remove mutagenicity and genotoxicity. For example, the genotoxic equivalent concentration in two effluents reached 120 and 240 ng/L 4-NQO-EQ in GV Sec and RR Eff, respectively, in the umuC without S9 test (Table S1). High 4-NQO-EQ resulted after AOP treatment (130-290 ng/L) suggest that AOPs using ozone and UV were ineffective in reducing genotoxicity and rather produced reactive intermediates. A similar result was also observed in the mutagenicity test (Table 2 and Table S1). In all cases, infiltration appeared to be able to partially attenuate the effects especially in all of the mutagenicity tests (44%- >97%) and in the umuC with the absence of S9 (52-55%) (Table 2). Both of the tests should be conducted in drinking water system in the future, particularly when considering that both mutagenicity and genotoxicity can induce DNA damage and ultimately lead to the formation of cancerous tumors.
3.2.4. Induction of adaptive stress response pathways
Both osmotic stress and hypoxia induction were negative in all of the samples. In the oxidative stress response, the AREc32 assay showed positive response in 7 out of the 9 samples except the two infiltrated samples; while no activity was found in Nrf2-MDA-MB cell line, which was probably due to the relatively low applied REF and sensitivity in the Nrf2 assay (Table 1 and Table S1).
The ECIR1.5 in AREc32 assay ranged from 12 (RR Eff) to 67 (O3/UV) REF, and the EC of the treated samples were all higher than that of the untreated water GV Sec (Table 2), suggesting that the treatment process partially removed the chemicals that cause oxidative stress in water. The tBHQ-EQ of two effluents were 13 and 23 μg/L for GV Sec and RR Eff, respectively, which were in a similar range of the value reported in Australia (tBHQ-EQ 41-52 μg/L) for similar treatment processes (Escher et al., 2012). The Nrf2-Keap-ARE pathway plays a central role in the protection of cells against oxidative and xenobiotic damage and a very wide range of chemicals have been reported to induce this pathway. Thus, AREc32 may represent a promising indicator of water treatment efficacy, although the health significance of the oxidative stress concentrations detected in these water samples is currently unclear.
3.2.5. General cytotoxicity and models for system response
Cytotoxicity/cell viability serves as a sum parameter for overall toxicity but was also used to assist the validity of induction assays. In this study, if the cytotoxicity (cell viability inhibition) was larger than 10%, the induction data were not included in the concentration-response assessment. In the literature, some in vitro cytotoxicity results were shown to correlate with in vivo toxicity tests, for example, EC50 values in the Caco2-NRU assay are significantly correlated with rat LD50 (Konsoula and Barile, 2005; Payne et al., 2014). Although there are significant uncertainties in extrapolating cytotoxicity results with human health outcomes, the in vitro result can still reflect the baseline toxicity of all chemicals in the sample (Escher and Leusch, 2012). No effects were observed in the assay indicative of neurotoxicity. A minimal effect was detected in the immunotoxicity assay with one of the effluent samples (EC10 of 0.4 REF in GV Sec; Table S1), but all subsequent treatment removed the effect to below detection limit (>1 REF). In contrast, the bacterial bioluminescence inhibition (Microtox) and algae growth inhibition assays showed detectable responses (Table 2 and Table S1). The relatively low EC values in the Microtox assay confirmed that this assay may be suitable assays for screening the overall cytotoxicity and can be considered in the assessment of environmental water system (Farré et al., 2002; Guzzella et al., 2004). In contrast, algae growth inhibition is strongly influenced by herbicides and this endpoint is therefore likely to not be non-specific although it also responds to baseline toxicants (Tang and Escher, 2014).
3.2.6. Removal efficacy and indicator bioassay
The BEQ reduction/increase during the treatment, which indicates the treatment efficacy, was visualized as a heatmap (Fig. 3). The similarity and correlations of in vitro response fingerprints between different water samples as well different assays was characterized by hierarchical clustering. Overall, water treatment efficiently eliminated part of the activity, although this depended both on treatment and individual bioassays. The closest similarity existed between O3 and O3/UV, while UV and UV/H2O2 are further away in hierarchy distance. Groundwater infiltration appeared to be the most efficient treatment step and removed most of the in vitro responses except genotoxicity. Ozone technology was able to significantly remove the oxidative stress assay activity (AREc32); while UV and UV based technology (including UV/H2O2 and O3/UV) appeared to be most efficacious for attenuation of glucocorticoid activity. Conversely, chlorination had fewer effects on most of the assays, but it could partially attenuate genotoxicity and largely decreased algal toxicity. It should also be noted that some of the activity did not change, and in fact even increased after the treatment, such as AhR activity and most of mutagenicity assays after UV treatment (Fig. 3), suggesting limited removal efficiency and/or production of reactive disinfection by-products generated during the AOP process. This study also suggested that single AOP treatment could not remove all in vitro responses; however, a previous study found that AOP combined with other treatments such as active carbon or reverse osmosis could remove most of these effects (Escher et al., 2014; Tang et al., 2014), implying that combination techniques could be applied in future drinking and recycled water treatment.
Fig 3.
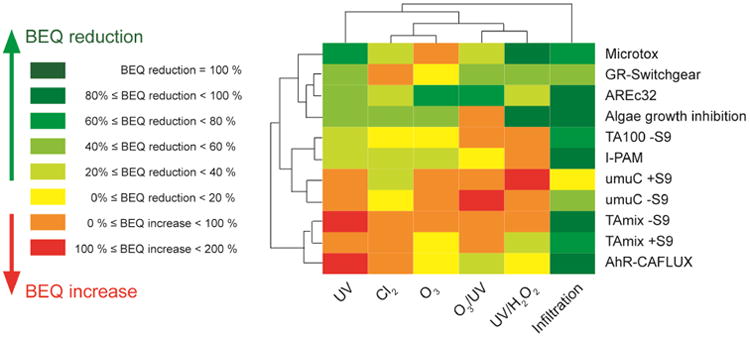
Summary of test results in 11 primary bioassays (excluding the ones showing no response). Plotted are the bioanalytical equivalent concentration (BEQ) reduction/increase ratio (%) calculated from the sample effect concentration (EC) values before and after treatment. For samples had no activity been detected after treatment, the minimum BEQ reduction value was used using the maximum REF tested.
4. Conclusions
In this study, we selected nine representative water samples including two WWTP secondary effluents, five AOP-treated reclaimed water, as well as two infiltrated groundwater, covering a broad range of different water qualities and subsequent treatment methods. All water extracts were screened in a battery of 18 MOA-based endpoints consisting of 36 bioassays. The result of this study showed that toxicity with different endpoints was observed in all the water samples and current technologies could not completely remove the in vitro responses. For xenobiotic metabolism induction, AhR seemed to have the highest induction; while for adaptive stress the AREc32 pathway provided the largest number of positive results and thus these bioassays may serve as indicator bioassay. For specific mode of action (i.e., endocrine effects), estrogenic and glucocorticoid activity showed detectable response in some of the water samples. In addition, some endpoints such as AhR activity, genotoxicity, and mutagenicity were increased after treatment, which may indicate a need for further investigation of possible formation of transformation products. Further study should be conducted to identify the primary chemicals responsible for the observed in vitro responses. Furthermore, the information this study has provided, in combination with previous studies (Escher et al., 2014; Leusch et al., 2014; Tang et al., 2014), may be used to establish which bioassays are most suited and relevant for water quality assessment, and guides further bioassay deployment in water monitoring. The conclusion of this study could be used to guide future policy on the selection of wastewater and drinking water treatment techniques. Varying degrees of sample enrichment was identified as a significant variable that affects comparison of bioassay results, and further bioassay work should carefully consider sample enrichment factors.
Supplementary Material
Table S1 - Effect concentration (EC10, ECIR1.5 or ECRR1.5; expressed as relative sample enrichment factor REF) and bioanalytical equivalent concentration (BEQ) summary for all the samples in the bioassay battery. See Fig. 1 in the main manuscript for sampling locations.
Fig. S1 - Comparison of all effect concentrations (EC10, ECSR0.2, ECIR1.5 or ECRR1.5; expressed as relative enrichment factor REF) values between two WWTP effluents. For samples below detection limit, the maximum REF (1000) was used for display purposes.
Highlights.
36 bioassays were used to evaluate 18 modes of toxicity.
Reclaimed water and various potable reuse treatment processes were screened.
Bioactivity attenuation efficacy during different reuse processes is compared.
Recommendations for application of bioscreening tools in water quality evaluations are provided.
Acknowledgments
We acknowledge Prof. Donna Zhang from the University of Arizona for sharing the Nrf2-MDA-MB cells for oxidative stress test, Prof. Robert Arnold from the University of Arizona for sharing yeast strains, and Switchgear Genomics for sharing the GR and Hypoxia assay. We acknowledge Achim Ried and Jens Scheideler from Xylem Inc. for providing the AOP pilot system, and Bruce Prior from City of Tucson/Water Dept. for sampling assistance. We thank Minkyu Park for data visualization, and Gerardo Lopez and Darcy Vandervort for experimental assistance. This work was mainly supported by WateReuse Research Foundation (WRF 10-07), and in part by the State of Arizona Technology Research Initiative Fund (TRIF) administered by the Water, Environmental and Energy Solutions (WEES) initiative at the University of Arizona. Additional support for Ai Jia and Shane Snyder was provided in part by the National Institute of Environmental Health Sciences (NIEHS) grant P30 ES06694 to the Southwest Environmental Health Sciences Center (SWEHSC) at The University of Arizona. Support for Prof. Snyder also has been provided by the Singapore National Research Foundation under its Environment and Water Technologies Strategic Research Programme and administered by the Environment and Water Industry Programme Office (EWI) of the PUB.
Footnotes
Supplementary Data: Data process, detection summary for all the samples in the bioassay battery, and comparison of all EC values between two WWTP effluents.
Publisher's Disclaimer: This is a PDF file of an unedited manuscript that has been accepted for publication. As a service to our customers we are providing this early version of the manuscript. The manuscript will undergo copyediting, typesetting, and review of the resulting proof before it is published in its final citable form. Please note that during the production process errors may be discovered which could affect the content, and all legal disclaimers that apply to the journal pertain.
References
- Ames BN, McCann J, Yamasaki E. Methods for detecting carcinogens and mutagens with the salmonella/mammalian-microsome mutagenicity test. Mutat Res. 1975;31:347–363. doi: 10.1016/0165-1161(75)90046-1. [DOI] [PubMed] [Google Scholar]
- Asano T, Levine AD. Wastewater reclamation, recycling and reuse: past, present, and future. Water Science and Technology. 1996;33:1–14. [Google Scholar]
- Buth JM, Ross MR, McNeill K, Arnold WA. Removal and formation of chlorinated triclosan derivatives in wastewater treatment plants using chlorine and UV disinfection. Chemosphere. 2011;84:1238–1243. doi: 10.1016/j.chemosphere.2011.05.017. [DOI] [PubMed] [Google Scholar]
- Chang H, Hu JY, Shao B. Occurrence of natural and synthetic glucocorticoids in sewage treatment plants and receiving river waters. Environ Sci Technol. 2007;41:3462–3468. doi: 10.1021/es062746o. [DOI] [PubMed] [Google Scholar]
- Collins FS, Gray GM, Bucher JR. Toxicology - Transforming environmental health protection. Science. 2008;319:906–907. doi: 10.1126/science.1154619. [DOI] [PMC free article] [PubMed] [Google Scholar]
- Conroy O, Sáez AE, Quanrud D, Ela W, Arnold RG. Changes in estrogen/anti-estrogen activities in ponded secondary effluent. Sci Total Environ. 2007;382:311–323. doi: 10.1016/j.scitotenv.2007.04.033. [DOI] [PubMed] [Google Scholar]
- Denison MS, Nagy SR. Activation of the aryl hydrocarbon receptor by structurally diverse exogenous and endogenous chemicals. Annu Rev Pharmacol Toxicol. 2003;43:309–334. doi: 10.1146/annurev.pharmtox.43.100901.135828. [DOI] [PubMed] [Google Scholar]
- Escher B, Hermens J. Modes of action in ecotoxicology: Their role in body burdens, species sensitivity, QSARs, and mixture effects. Environ Sci Technol. 2002;36:4201–4217. doi: 10.1021/es015848h. [DOI] [PubMed] [Google Scholar]
- Escher B, Leusch F. Bioanalytical tools in water quality assessment. IWA Publishing; London, UK: 2012. [Google Scholar]
- Escher BI, Allinson M, Altenburger R, Bain PA, Balaguer P, Busch W, Crago J, Denslow ND, Dopp E, Hilscherova K, Humpage AR, Kumar A, Grimaldi M, Jayasinghe BS, Jarosova B, Jia A, Makarov S, Maruya KA, Medvedev A, Mehinto AC, Mendez JE, Poulsen A, Prochazka E, Richard J, Schifferli A, Schlenk D, Scholz S, Shiraish F, Snyder S, Su GY, Tang JYM, van der Burg B, van der Linden SC, Werner I, Westerheide SD, Wong CKC, Yang M, Yeung BHY, Zhang XW, Leusch FDL. Benchmarking Organic Micropollutants in Wastewater, Recycled Water and Drinking Water with In Vitro Bioassays. Environ Sci Technol. 2014;48:1940–1956. doi: 10.1021/es403899t. [DOI] [PubMed] [Google Scholar]
- Escher BI, Bramaz N, Mueller JF, Quayle P, Rutishauser S, Vermeirssen ELM. Toxic equivalent concentrations (TEQs) for baseline toxicity and specific modes of action as a tool to improve interpretation of ecotoxicity testing of environmental samples. J Env Monitor. 2008a;10:612–621. doi: 10.1039/b800949j. [DOI] [PubMed] [Google Scholar]
- Escher BI, Bramaz N, Quayle P, Rutishauser S, Vermeirssen ELM. Monitoring of the ecotoxicological hazard potential by polar organic micropollutants in sewage treatment plants and surface waters using a mode-of-action based test battery. J Env Monitor. 2008b;10:622–631. doi: 10.1039/b800951a. [DOI] [PubMed] [Google Scholar]
- Escher BI, Dutt M, Maylin E, Tang JYM, Toze S, Wolf CR, Lang M. Water quality assessment using the AREc32 reporter gene assay indicative of the oxidative stress response pathway. J Env Monitor. 2012;14:2877–2885. doi: 10.1039/c2em30506b. [DOI] [PubMed] [Google Scholar]
- Farré M, Klöter G, Petrovic M, Alonso MC, de Alda MJL, Barceló D. Identification of toxic compounds in wastewater treatment plants during a field experiment. Anal Chim Act. 2002;456:19–30. [Google Scholar]
- Furuichi T, Kannan K, Glesy J, Masunaga S. Contribution of known endocrine disrupting substances to the estrogenic activity in Tama River water samples from Japan using instrumental analysis and in vitro reporter gene assay. Water Res. 2004;38:4491–4501. doi: 10.1016/j.watres.2004.08.007. [DOI] [PubMed] [Google Scholar]
- Gerrity D, Gamage S, Holady JC, Mawhinney DB, Quiñones O, Trenholm RA, Snyder SA. Pilot-scale evaluation of ozone and biological activated carbon for trace organic contaminant mitigation and disinfection. Water Res. 2011;45:2155–2165. doi: 10.1016/j.watres.2010.12.031. [DOI] [PubMed] [Google Scholar]
- Gutleb AC, Meerts IATM, Bergsma JH, Schriks M, Murk AJ. T-Screen as a tool to identify thyroid hormone receptor active compounds. Environ Toxicol Pharmacol. 2005;19:231–238. doi: 10.1016/j.etap.2004.06.003. [DOI] [PubMed] [Google Scholar]
- Guzzella L, Monarca S, Zani C, Feretti D, Zerbini I, Buschini A, Poli P, Rossi C, Richardson SD. In vitro potential genotoxic effects of surface drinking water treated with chlorine and alternative disinfectants. Mutat Res. 2004;564:179–193. doi: 10.1016/j.mrgentox.2004.08.006. [DOI] [PubMed] [Google Scholar]
- Hartung T, Daston G. Are In Vitro Tests Suitable for Regulatory Use? Toxicol Sci. 2009;111:233–237. doi: 10.1093/toxsci/kfp149. [DOI] [PubMed] [Google Scholar]
- Heringa MB, Harmsen DJH, Beerendonk EF, Reus AA, Krul CAM, Metz DH, Ijpelaar GF. Formation and removal of genotoxic activity during UV/H2O2-GAC treatment of drinking water. Water Res. 2011;45:366–374. doi: 10.1016/j.watres.2010.08.008. [DOI] [PubMed] [Google Scholar]
- Huang R, Xia M, Cho MH, Sakamuru S, Shinn P, Houck KA, Dix DJ, Judson RS, Witt KL, Kavlock RJ, Tice RR, Austin CP. Chemical genomics profiling of environmental chemical modulation of human nuclear receptors. Environ Health Persp. 2011;119:1142–1148. doi: 10.1289/ehp.1002952. [DOI] [PMC free article] [PubMed] [Google Scholar]
- Invitrogen. 2007a https://tools.lifetechnologies.com/content/sfs/manuals/GR_valpak_with_DAcells.pdf.
- Invitrogen. 2007b https://tools.lifetechnologies.com/content/sfs/manuals/PPAR-gamma_valpak_with_DAcells.pdf.
- ISO13828. Water quality – Determination of the genotoxicity of water and waste water using the umu-test. International Organization for Standardization (ISO); Geneva, Switzerland: 1999. [Google Scholar]
- Jarošová B, Bláha L, Giesy JP, Hilscherová K. What level of estrogenic activity determined by in vitro assays in municipal waste waters can be considered as safe? Environ Int. 2014;64:98–109. doi: 10.1016/j.envint.2013.12.009. [DOI] [PubMed] [Google Scholar]
- Jarosova B, Ersekova A, Hilscherova K, Loos R, Gawlik BM, Giesy JP, Blaha L. Europe-wide survey of estrogenicity in wastewater treatment plant effluents: the need for the effect-based monitoring. Environ Sci Pollut R. 2014;21:10970–10982. doi: 10.1007/s11356-014-3056-8. [DOI] [PubMed] [Google Scholar]
- Jin L, Gaus C, van Mourik L, Escher BI. Applicability of Passive Sampling to Bioanalytical Screening of Bioaccumulative Chemicals in Marine Wildlife. Environ Sci Technol. 2013;47:7982–7988. doi: 10.1021/es401014b. [DOI] [PubMed] [Google Scholar]
- Kavlock R, Dix D. Computational Toxicology as Implemented by the U.S. EPA: Providing High Throughput Decision Support Tools for Screening and Assessing Chemical Exposure, Hazard and Risk. Journal of Toxicology and Environmental Health, Part B. 2010;13:197–217. doi: 10.1080/10937404.2010.483935. [DOI] [PubMed] [Google Scholar]
- Khim J, Villeneuve D, Kannan K, Koh C, Giesy J. Characterization and distribution of trace organic contaminants in sediment from Masan Bay, Korea. 2. In vitro gene expression assays. Environ Sci Technol. 1999;33:4206–4211. [Google Scholar]
- Konsoula R, Barile FA. Correlation of in vitro cytotoxicity with paracellular permeability in Caco-2 cells. Toxicol In Vitro. 2005;19:675–684. doi: 10.1016/j.tiv.2005.03.006. [DOI] [PubMed] [Google Scholar]
- Legler J, van den Brink CE, Brouwer A, Murk AJ, van der Saag PT, Vethaak AD, van der Burg B. Development of a stably transfected estrogen receptor-mediated luciferase reporter gene assay in the human T47D breast cancer cell line. Toxicol Sci. 1999;48:55–66. doi: 10.1093/toxsci/48.1.55. [DOI] [PubMed] [Google Scholar]
- Leusch FDL, de Jager C, Levi Y, Lim R, Puijker L, Sacher F, Tremblay LA, Wilson VS, Chapman HF. Comparison of Five in Vitro Bioassays to Measure Estrogenic Activity in Environmental Waters. Environ Sci Technol. 2010;44:3853–3860. doi: 10.1021/es903899d. [DOI] [PubMed] [Google Scholar]
- Leusch FDL, Khan SJ, Laingam S, Prochazka E, Froscio S, Trinh T, Chapman HF, Humpage A. Assessment of the application of bioanalytical tools as surrogate measure of chemical contaminants in recycled water. Water Res. 2014;49:300–315. doi: 10.1016/j.watres.2013.11.030. [DOI] [PubMed] [Google Scholar]
- Leverenz H, Tchobanoglous G, Asano T. Direct potable reuse: a future imperative. Journal of Water Reuse and Desalination. 2011;1:2–10. [Google Scholar]
- Liu J, Zhang X. Comparative toxicity of new halophenolic DBPs in chlorinated saline wastewater effluents against a marine alga: Halophenolic DBPs are generally more toxic than haloaliphatic ones. Water Res. 2014;65:64–72. doi: 10.1016/j.watres.2014.07.024. [DOI] [PubMed] [Google Scholar]
- Ma M, Li J, Wang Z. Assessing the Detoxication Efficiencies of Wastewater Treatment Processes Using a Battery of Bioassays/Biomarkers. Arch Environ Con Tox. 2005;49:480–487. doi: 10.1007/s00244-004-0204-z. [DOI] [PubMed] [Google Scholar]
- Macova M, Escher BI, Reungoat J, Carswell S, Chue KL, Keller J, Mueller JF. Monitoring the biological activity of micropollutants during advanced wastewater treatment with ozonation and activated carbon filtration. Water Res. 2010;44:477–492. doi: 10.1016/j.watres.2009.09.025. [DOI] [PubMed] [Google Scholar]
- Manger RL, Leja LS, Lee SY, Hungerford JM, Kirkpatrick MA, Yasumoto T, Wekell MM. Detection of Paralytic Shellfish Poison by Rapid Cell Bioassay: Antagonism of Voltage-Gated Sodium Channel Active Toxins in vitro. J AOAC Int. 2003;86:540–543. [PubMed] [Google Scholar]
- Martijn AJ, Kruithof JC. UV and UV/H2O2 Treatment: The Silver Bullet for By-product and Genotoxicity Formation in Water Production. Ozone: Science & Engineering. 2012;34:92–100. [Google Scholar]
- Martin MT, Dix DJ, Judson RS, Kavlock RJ, Reif DM, Richard AM, Rotroff DM, Romanov S, Medvedev A, Poltoratskaya N, Gambarian M, Moeser M, Makarov SS, Houck KA. Impact of Environmental Chemicals on Key Transcription Regulators and Correlation to Toxicity End Points within EPA's ToxCast Program. Chem Res Toxicol. 2010;23:578–590. doi: 10.1021/tx900325g. [DOI] [PubMed] [Google Scholar]
- Muller R, Schreiber U, Escher BI, Quayle P, Nash SMB, Mueller JF. Rapid exposure assessment of PSII herbicides in surface water using a novel chlorophyll a fluorescence imaging assay. Sci Total Environ. 2008;401:51–59. doi: 10.1016/j.scitotenv.2008.02.062. [DOI] [PubMed] [Google Scholar]
- Nagy SR, Sanborn JR, Hammock BD, Denison MS. Development of a Green Fluorescent Protein-Based Cell Bioassay for the Rapid and Inexpensive Detection and Characterization of Ah Receptor Agonists. Toxicol Sci. 2002;65:200–210. doi: 10.1093/toxsci/65.2.200. [DOI] [PubMed] [Google Scholar]
- NRC. Report in brief. National Research Council (NRC); Washington, D.C: 2007. Toxicity testing in the 21st century: A vision and a strategy. [Google Scholar]
- Oda Y, Nakamura Si, Oki I, Kato T, Shinagawa H. Evaluation of the new system (umu-test) for the detection of environmental mutagens and carcinogens. Mutat Res. 1985;147:219–229. doi: 10.1016/0165-1161(85)90062-7. [DOI] [PubMed] [Google Scholar]
- Pan Y, Zhang X, Wagner ED, Osiol J, Plewa MJ. Boiling of Simulated Tap Water: Effect on Polar Brominated Disinfection Byproducts, Halogen Speciation, and Cytotoxicity. Environ Sci Technol. 2014;48:149–156. doi: 10.1021/es403775v. [DOI] [PubMed] [Google Scholar]
- Payne ME, Chapman HF, Cumming J, Leusch FDL. In vitro cytotoxicity assessment of a hydraulic fracturing fluid. Environ Chem. 2014 http://dx.doi.org/10.1071/EN14010.
- Pisarenko AN, Stanford BD, Yan D, Gerrity D, Snyder SA. Effects of ozone and ozone/peroxide on trace organic contaminants and NDMA in drinking water and water reuse applications. Water Res. 2012;46:316–326. doi: 10.1016/j.watres.2011.10.021. [DOI] [PubMed] [Google Scholar]
- Qiao M, Chen Y, Zhang Q, Huang S, Ma M, Wang C, Wang Z. Identification of Ah receptor agonists in sediment of Meiliang Bay, Taihu Lake, China. Environ Sci Technol. 2006;40:1415–1419. doi: 10.1021/es051456p. [DOI] [PubMed] [Google Scholar]
- Reifferscheid G, Maes HM, Allner B, Badurova J, Belkin S, Bluhm K, Brauer F, Bressling J, Domeneghetti S, Elad T, Flückiger-Isler S, Grummt HJ, Gürtler R, Hecht A, Heringa MB, Hollert H, Huber S, Kramer M, Magdeburg A, Ratte HT, Sauerborn-Klobucar R, Sokolowski A, Soldan P, Smital T, Stalter D, Venier P, Ziemann C, Zipperle J, Buchinger S. International Round-Robin Study on the Ames Fluctuation Test. Environ Mol Mutagen. 2012;53:185–197. doi: 10.1002/em.21677. [DOI] [PubMed] [Google Scholar]
- Rosario-Ortiz FL, Wert EC, Snyder SA. Evaluation of UV/H2O2 treatment for the oxidation of pharmaceuticals in wastewater. Water Res. 2010;44:1440–1448. doi: 10.1016/j.watres.2009.10.031. [DOI] [PubMed] [Google Scholar]
- Rostkowski P, Horwood J, Shears JA, Lange A, Oladapo FO, Besselink HT, Tyler CR, Hill EM. Bioassay-Directed Identification of Novel Antiandrogenic Compounds in Bile of Fish Exposed to Wastewater Effluents. Environ Sci Technol. 2011;45:10660–10667. doi: 10.1021/es202966c. [DOI] [PubMed] [Google Scholar]
- Routledge EJ, Sumpter JP. Estrogenic activity of surfactants and some of their degradation products assessed using a recombinant yeast screen. Environ Toxicol Chem. 1996;15:241–248. [Google Scholar]
- Schriks M, van Leerdam JA, van der Linden SC, van der Burg B, van Wezel AP, de Voogt P. High-Resolution Mass Spectrometric Identification and Quantification of Glucocorticoid Compounds in Various Wastewaters in The Netherlands. Environ Sci Technol. 2010;44:4766–4774. doi: 10.1021/es100013x. [DOI] [PubMed] [Google Scholar]
- Schwarzenbach RP, Escher BI, Fenner K, Hofstetter TB, Johnson CA, von Gunten U, Wehrli B. The Challenge of Micropollutants in Aquatic Systems. Science. 2006;313:1072–1077. doi: 10.1126/science.1127291. [DOI] [PubMed] [Google Scholar]
- Shukla SJ, Huang RL, Austin CP, Xia MH. The future of toxicity testing: a focus on in vitro methods using a quantitative high-throughput screening platform. Drug Discov Today. 2010;15:997–1007. doi: 10.1016/j.drudis.2010.07.007. [DOI] [PMC free article] [PubMed] [Google Scholar]
- Snyder S, Villeneuve D, Snyder E, Giesy J. Identification and quantification of estrogen receptor agonists in wastewater effluents. Environ Sci Technol. 2001;35:3620–3625. doi: 10.1021/es001254n. [DOI] [PubMed] [Google Scholar]
- Snyder SA. Emerging Chemical Contaminants: Looking for Better Harmony. J Am Water Work Assoc. 2014;106:38–52. [Google Scholar]
- Soares A, Guieysse B, Jefferson B, Cartmell E, Lester JN. Nonylphenol in the environment: A critical review on occurrence, fate, toxicity and treatment in wastewaters. Environ Int. 2008;34:1033–1049. doi: 10.1016/j.envint.2008.01.004. [DOI] [PubMed] [Google Scholar]
- Sohoni P, Sumpter J. Several environmental oestrogens are also anti-androgens. J Endocrinol. 1998;158:327–339. doi: 10.1677/joe.0.1580327. [DOI] [PubMed] [Google Scholar]
- Solley D, Gronow C, Tait S, Bates J, Buchanan A. Managing the reverse osmosis concentrate from the Western Corridor Recycled Water Scheme. Water Practice and Technology. 2010;5:1–8. [Google Scholar]
- Sonneveld E, Jansen HJ, Riteco JAC, Brouwer A, van der Burg B. Development of androgen- and estrogen-responsive bioassays, members of a panel of human cell line-based highly selective steroid-responsive bioassays. Tox Sci. 2005;83:136–148. doi: 10.1093/toxsci/kfi005. [DOI] [PubMed] [Google Scholar]
- Stavreva DA, George AA, Klausmeyer P, Varticovski L, Sack D, Voss TC, Schiltz RL, Blazer VS, Iwanowicz LR, Hager GL. Prevalent Glucocorticoid and Androgen Activity in US Water Sources. Scientific Reports. 2012;2 doi: 10.1038/srep00937. 10.1038/srep00937. [DOI] [PMC free article] [PubMed] [Google Scholar]
- Switchgear. 2010a http://switchgeargenomics.com/products/pathway-screening-panels/gr-pathway-products-experimental-data.
- Switchgear. 2010b http://switchgeargenomics.com/products/pathway-screening-panels/hypoxia-pathway-products-applications.
- Tang JYM, Busetti F, Charrois JWA, Escher BI. Which chemicals drive biological effects in wastewater and recycled water? Water Res. 2014;60:289–299. doi: 10.1016/j.watres.2014.04.043. [DOI] [PubMed] [Google Scholar]
- Tang JYM, Escher BI. Realistic environmental mixtures of micropollutants in surface, drinking, and recycled water: Herbicides dominate the mixture toxicity toward algae. Environ Toxicol Chem. 2014;33:1427–1436. doi: 10.1002/etc.2580. [DOI] [PubMed] [Google Scholar]
- Tang JYM, McCarty S, Glenn E, Neale PA, Warne MS, Escher BI. Mixture Effects of Organic Micropollutants Present in Water: Towards the Development of Effect-Based Water Quality Trigger Values for Baseline Toxicity. Water Res. 2013;47:3300–3314. doi: 10.1016/j.watres.2013.03.011. [DOI] [PubMed] [Google Scholar]
- Thomas KV, Hurst MR, Matthiessen P, McHugh M, Smith A, Waldock MJ. An assessment of in vitro androgenic activity and the identification of environmental androgens in United Kingdom estuaries. Environ Toxicol Chem. 2002;21:1456–1461. [PubMed] [Google Scholar]
- Umbuzeiro GD, Rech CM, Correia S, Bergamasco AM, Cardenette GHL, Fluckiger-Isler S, Kamber M. Comparison of the Salmonella/microsome microsuspension assay with the new microplate fluctuation protocol for testing the mutagenicity of environmental samples. Environ Mol Mutagen. 2010;51:31–38. doi: 10.1002/em.20504. [DOI] [PubMed] [Google Scholar]
- US EPA. Prioritization of the Endocrine Disruptor Screening Program Universe of Chemicals for an Estrogen Receptor Adverse Outcome Pathway Using Computational Toxicology Tools. US Environmental Protection Agency; Washington, DC: 2012. [Google Scholar]
- USEPA. 2009 http://water.epa.gov/drink/contaminants/index.cfm#List.
- van der Burg B, Winter R, Man Hy, Vangenechten C, Berckmans P, Weimer M, Witters H, van der Linden S. Optimization and prevalidation of the in vitro AR CALUX method to test androgenic and antiandrogenic activity of compounds. Reprod Toxicol. 2010;30:18–24. doi: 10.1016/j.reprotox.2010.04.012. [DOI] [PubMed] [Google Scholar]
- Van der Linden SC, Heringa MB, Man HY, Sonneveld E, Puijker LM, Brouwer A, Van der Burg B. Detection of multiple hormonal activities in wastewater effluents and surface water, using a panel of steroid receptor CALUX bioassays. Environ Sci Technol. 2008;42:5814–5820. doi: 10.1021/es702897y. [DOI] [PubMed] [Google Scholar]
- Vanderford B, Mawhinney D, Trenholm R, Zeigler-Holady J, Snyder S. Assessment of sample preservation techniques for pharmaceuticals, personal care products, and steroids in surface and drinking water. Anal Bioanal Chem. 2011;399:2227–2234. doi: 10.1007/s00216-010-4608-5. [DOI] [PubMed] [Google Scholar]
- Wang XJ, Hayes JD, Wolf CR. Generation of a stable antioxidant response element-driven reporter gene cell line and its use to show redox-dependent activation of Nrf2 by cancer chemotherapeutic agents. Cancer Res. 2006;66:10983–10994. doi: 10.1158/0008-5472.CAN-06-2298. [DOI] [PubMed] [Google Scholar]
- Wang XJ, Sun Z, Chen WM, Li YJ, Villeneuve NF, Zhang DD. Activation of Nrf2 by arsenite and monomethylarsonous acid is independent of Keap1-C151: enhanced Keap1-Cul3 interaction. Toxicol Appl Pharm. 2008;230:383–389. doi: 10.1016/j.taap.2008.03.003. [DOI] [PMC free article] [PubMed] [Google Scholar]
- Yang M, Zhang X. Halopyrroles: A New Group of Highly Toxic Disinfection Byproducts Formed in Chlorinated Saline Wastewater. Environ Sci Technol. 2014;48:11846–11852. doi: 10.1021/es503312k. [DOI] [PubMed] [Google Scholar]
- Yang Y, Komaki Y, Kimura SY, Hu HY, Wagner ED, Mariñas BJ, Plewa MJ. Toxic Impact of Bromide and Iodide on Drinking Water Disinfected with Chlorine or Chloramines. Environ Sci Technol. 2014;48:12362–12369. doi: 10.1021/es503621e. [DOI] [PubMed] [Google Scholar]
- Zhang DD. Mechanistic studies of the Nrf2-Keap1 signaling pathway. Drug Metab Rev. 2006;38:769–789. doi: 10.1080/03602530600971974. [DOI] [PubMed] [Google Scholar]
Associated Data
This section collects any data citations, data availability statements, or supplementary materials included in this article.
Supplementary Materials
Table S1 - Effect concentration (EC10, ECIR1.5 or ECRR1.5; expressed as relative sample enrichment factor REF) and bioanalytical equivalent concentration (BEQ) summary for all the samples in the bioassay battery. See Fig. 1 in the main manuscript for sampling locations.
Fig. S1 - Comparison of all effect concentrations (EC10, ECSR0.2, ECIR1.5 or ECRR1.5; expressed as relative enrichment factor REF) values between two WWTP effluents. For samples below detection limit, the maximum REF (1000) was used for display purposes.