Significance
p53 has been shown to play important roles in environmental adaptive evolution. Here we show that p53 and its target genes express differentially between two abutting populations of the blind mole rat Spalax galili during its sympatric speciation caused by sharply divergent abutting ecologies of chalk and basalt. Remarkably, the differential expression of p53 is due to differing methylation on sites –1446, –1204, and –1086 of the p53 promoter, which plays a key role in regulating the binding of several transcription factors including Cut-Like Homeobox 1, paired box 4 (Pax 4), Pax 6, and activator protein 1. Different expressions of S. galili p53 selectively changed adaptive cell-cycle arrest. This article provides evidence supporting the sympatric speciation of S. galili, demonstrating the importance of epigenetic modifications in adaptive evolution.
Keywords: evolution, speciation, ecological stress and adaptation, epigenetics
Abstract
Epigenetic modifications play significant roles in adaptive evolution. The tumor suppressor p53, well known for controlling cell fate and maintaining genomic stability, is much less known as a master gene in environmental adaptation involving methylation modifications. The blind subterranean mole rat Spalax eherenbergi superspecies in Israel consists of four species that speciated peripatrically. Remarkably, the northern Galilee species Spalax galili (2n = 52) underwent adaptive ecological sympatric speciation, caused by the sharply divergent chalk and basalt ecologies. This was demonstrated by mitochondrial and nuclear genomic evidence. Here we show that the expression patterns of the p53 regulatory pathway diversified between the abutting sympatric populations of S. galili in sharply divergent chalk–basalt ecologies. We identified higher methylation on several sites of the p53 promoter in the population living in chalk soil (chalk population). Site mutagenesis showed that methylation on these sites linked to the transcriptional repression of p53 involving Cut-Like Homeobox 1 (Cux1), paired box 4 (Pax 4), Pax 6, and activator protein 1 (AP-1). Diverse expression levels of p53 between the incipiently sympatrically speciating chalk–basalt abutting populations of S. galili selectively affected cell-cycle arrest but not apoptosis. We hypothesize that methylation modification of p53 has adaptively shifted in supervising its target genes during sympatric speciation of S. galili to cope with the contrasting environmental stresses of the abutting divergent chalk–basalt ecologies.
Sympatric speciation without geographic isolation is becoming more convincing with the accumulation of supportive genetic evidence (1–3). As we previously proposed (1, 3), sympatric speciation occurs during the adaptive evolution of the Israeli subterranean blind mole rat Spalax galili (2n = 52) living in the Galilee in northern Israel. Genetic and physiological differences were observed from two abutting populations of S. galili living in sharply divergent soil types (chalk and basalt) including population-specific haplotype mitochondrial (mt) DNA pattern, population-unique SNPs of genome, different activity patterns, and distinct oxygen consumption (1, 3). This is the first demonstration, to our knowledge, of sympatric speciation in subterranean mammals, certainly in the genus Spalax, which usually speciates peripatrically or allopatrically (4).
The tumor suppressor gene p53 has been underappreciated for its roles in environmental adaptation. As a sensor of stresses including genotoxic stress and hypoxia (5, 6), p53 is also a master gene of diversity during adaptive evolution (7–11), although this perspective is less studied than its role in cancer suppression. Modifications of p53 in different levels during adaptive evolution confer the animal’s selective advantage by regulating adaptive cell fates. Our recent study demonstrated that variation of p53 is important for adapting to a variety of environmental stresses, including hypoxia, temperature, and pH changes (12).
Spalax is well adapted to hypoxia due to its underground habitat (4, 13–15) (see full list of publications: evolution.haifa.ac.il/index.php/28-people/publications/152-publication-nevo-spalax). Thus, Spalax is an excellent model to investigate the correlation between gene variations and environmental adaptation. Our previous study revealed an important mutation on the codon 172 of Spalax’s p53, which reduced its ability to activate apoptotic target genes (9). This mechanism is believed to contribute to Spalax’s hypoxia adaptation by escaping from hypoxia-induced apoptosis (9). Recently, we sequenced and analyzed the genome and transcriptome from the S. galili population living in basalt soil (basalt population). Transcriptome analysis of the p53 signaling pathway showed that eight of the p53 target genes were differentially regulated by hypoxia in S. galili and rat, supporting the adaptive roles of S. galili’s p53 pathway (16).
Although there is no geographical barrier, the two populations of S. galili living in the two abutting soils adopt completely different habitats, in which the chalk soil is drier and hotter especially in summer and the basalt soil is more humid and hypoxic during winter floods. Moreover, only 28% of 112 plant species are shared between the two abutting soils (1), suggesting very different diet structures of the two populations.
In addition to gene mutations, heritable epigenetic changes occur more frequently with paramount importance for adaptive evolution (17–19). We report here that the two contiguous populations of the blind mole rat S. galili living in contrasting, but abutting, chalk and basalt soils (henceforward, chalk mole rat population and basalt mole rat population, respectively), adapting to distinct degrees of hypoxia, hypercapnia, and different diet spectra, display divergent expressions of the p53 regulatory pathway, due to different methylation modifications. The results provide important evidence supporting the significant adaptive roles of epigenetic changes of p53 in environmental adaptation during sympatric speciation.
Results
Identical p53 Sequences of Two Populations of S. galili.
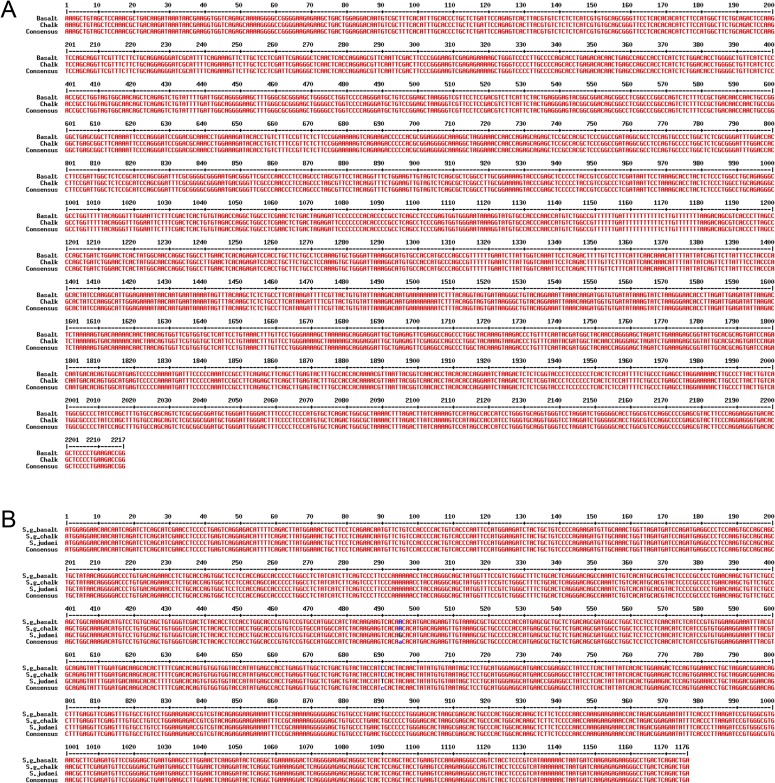
The coding sequence (CDS) and a 2-kb upstream promoter region of p53 of S. galili from both S. galili abutting soil populations were cloned and sequenced (GenBank accession nos. KP799008 for the CDS and KP799009 for the promoter). A 203-bp fragment was predicted as a 5′ untranslated region (UTR) by comparing the southern species Spalax judaei p53 mRNA sequence (GenBank accession no. AJ783406) (9) with the genomic sequence of S. galili (16), aligned with human p53 (Ensembl transcript ID ENST00000269305). Alignment analysis revealed identical nucleotide sequences of p53 CDS and the 2-kb upstream regulatory region including the 5′ UTR of the two soil mole rat populations (Fig. S1A). Comparing S. galili p53 with its sibling species S. judaei (2n = 60) showed that they share the same protein sequence, both carrying an R172K mutation, although there are two synonymous varied bases at positions 495 and 690 (Fig. S1B).
Fig. S1.
Two soil (basalt and chalk) populations of S. galili have identical p53 sequences. (A) Multiple alignments of p53 promoter sequences of S. galili basalt and chalk populations, with +1 indicating the transcription starting site. (B) Multiple alignments of p53 CDSs of S. galili basalt and chalk and S. judaei were shown, with blue color showing the different nucleotides at positions 495 and 690.
Divergent Expressions of p53 and Its Supervised Genes in Tissues.
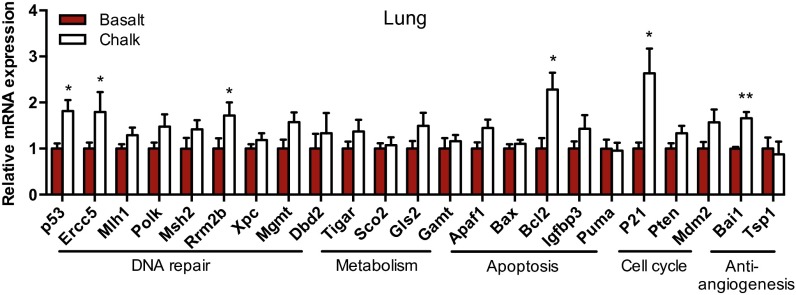
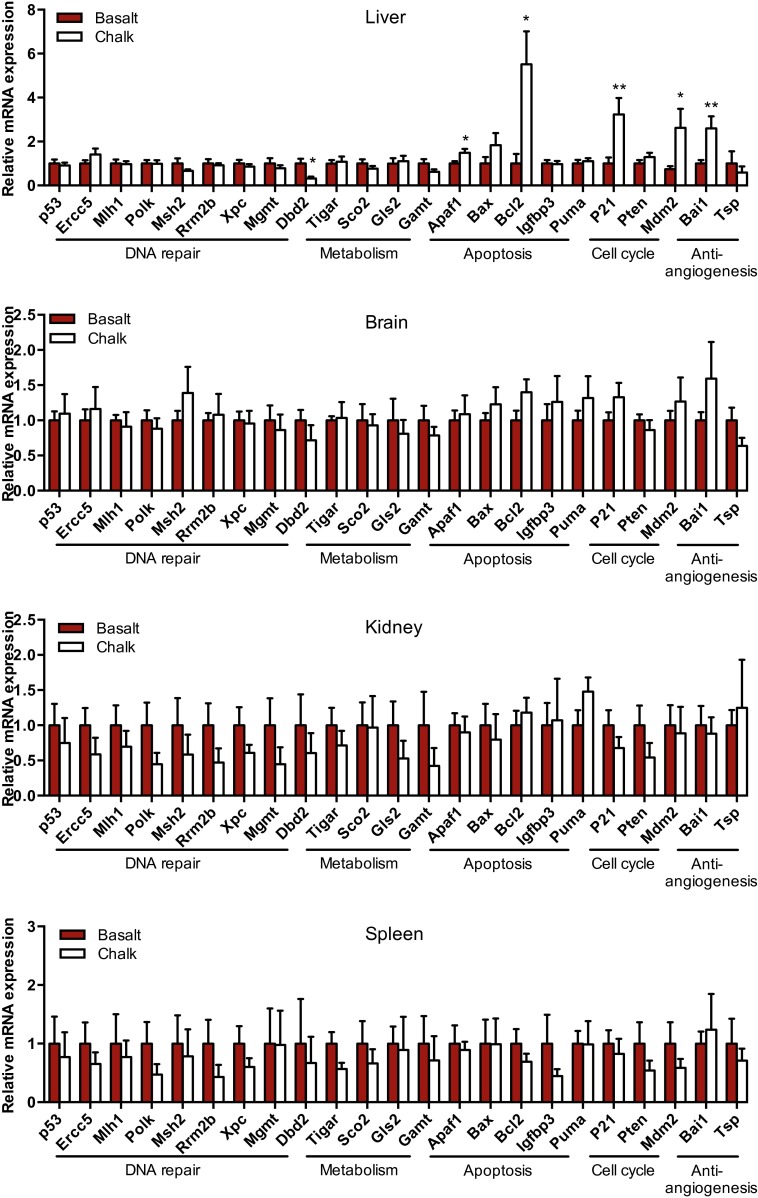
To compare the expression profiles of the S. galili p53 regulatory network, quantitative real-time PCR (qPCR) was performed to test the expression patterns of the p53 and dozens of its supervised genes from the brain, liver, lung, kidney, and spleen of S. galili from both soil types’ mole rat populations (results presented are for six animals of each population). The downstream p53 target genes selected here include Ercc5, Mlh1, Polk, Msh2, Rrm2b, Xpc, Mgmt, Dbd2, Tigar, Sco2, Gls2, Gamt, Apaf1, Bax, Bcl2, Igfbp3, Puma, P21, Pten, Mdm2, Bai1, and Tsp1. Their protein products cover the functions of DNA repair, metabolism, apoptosis, cell-cycle arrest, and antiangiogenesis (20). The mRNA expression of p53 showed different patterns in various tissues. The mRNA expression level of p53 in the lung from the chalk mole rat population is twofold higher than that of the basalt mole rat population (Fig. 1). Out of the 22 selected p53 target genes, Ercc5, Rrm2b, Bcl2, p21, and Bai1 showed significantly increased expression levels in the chalk population than those in the basalt population (Fig. 1). None of the genes were observed expressing lower levels in chalk than in the basalt population. Several cell-cycle genes expressed higher levels in chalk than in the basalt population in liver (Fig. S2). In kidney, these genes’ expression in the chalk population was generally lower than in the basalt population, although no statistical significance differences were observed due to the large SE (Fig. S2). No significant difference of the genes’ expression between the two mole rat populations was observed in brain and spleen (Fig. S2).
Fig. 1.
S. galili from basalt and chalk soil types have divergent expression patterns of p53 and its supervised genes. The mRNA expression of p53 and its target genes in the lung of the two populations of S. galili living in basalt and chalk soil types is shown. Results are mean ± SEM (n = 6). *P < 0.05, **P < 0.01 (unpaired t test).
Fig. S2.
Tissue-specific expression of p53 and target genes in S. galili from basalt and chalk soil types. The mRNA expression of p53 and its target genes in the liver, brain, kidney, and spleen of the two populations of S. galili living in basalt and chalk soil types are shown. Results are mean ± SEM (n = 6). *P < 0.05, **P < 0.01 (unpaired t test).
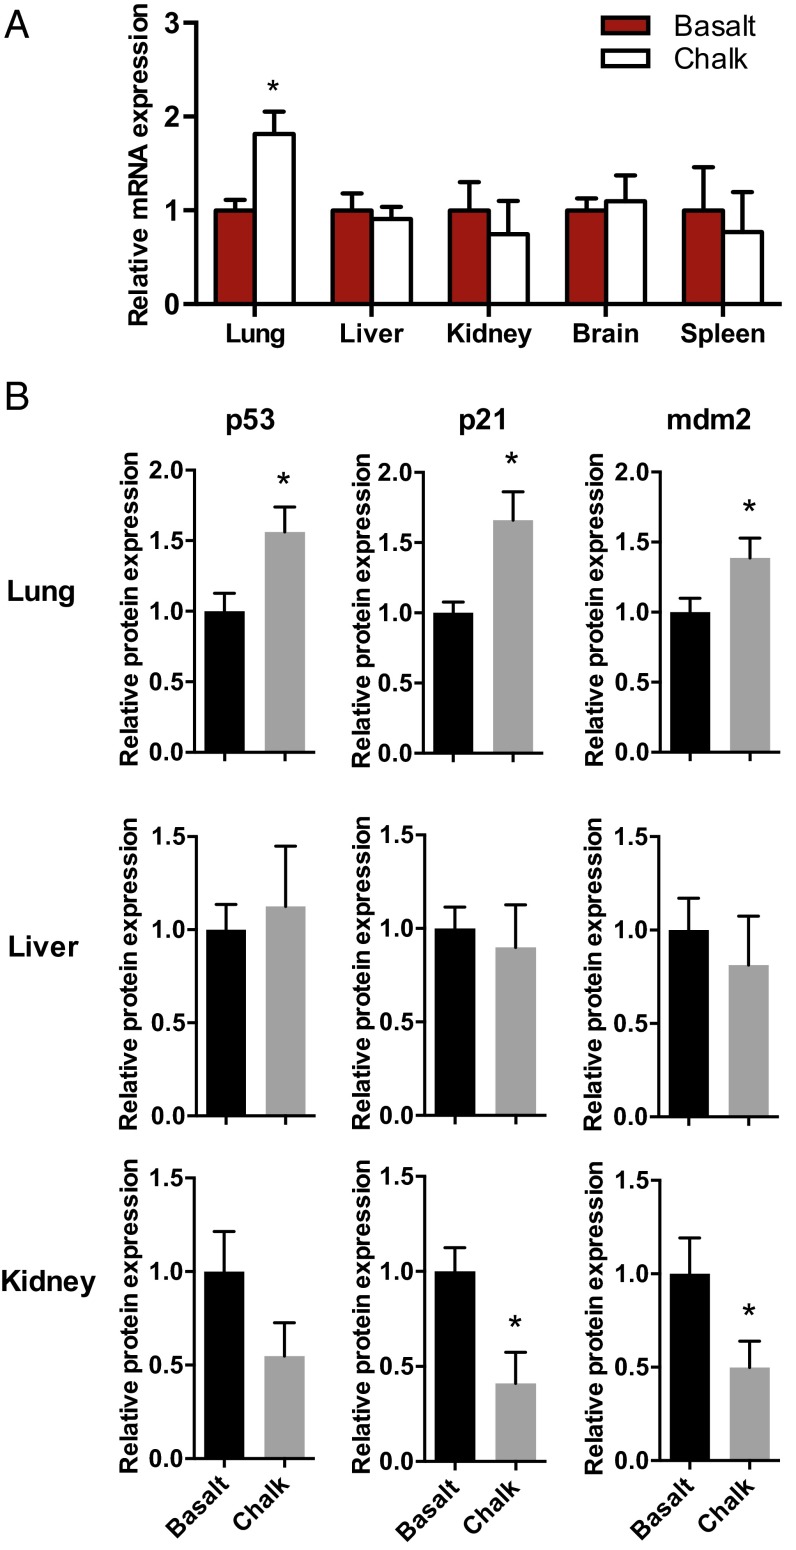
Western blot was performed to show the protein expression of p53, p21, and Mdm2. Generally, the protein expression patterns comparing the two mole rat populations were similar with the mRNA expression, although the mRNA and protein levels of p21 and Mdm2 did not match in the liver (Figs. 1 and 2). This may be due to different posttranscriptional modifications. The p53 and p21 protein levels in the lung showed the exact same patterns with their mRNA levels (Figs. 1 and 2).
Fig. 2.
Different expression patterns of p53 mRNA and protein between chalk and basalt mole rat populations. (A) Comparing p53 mRNA in lung, liver, kidney, brain, and spleen between chalk and basalt mole rat populations. (B) Western blot showing tissue-specific expression of p53, p21, and mdm2 proteins in lung, liver, and kidney compared between chalk and basalt mole rat populations. Results are mean ± SEM (n = 6). *P < 0.05 (unpaired t test).
Different Methylation Status of p53 Promoter in the Two Populations of S. galili.
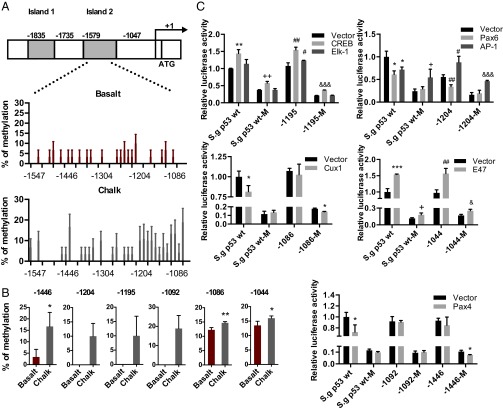
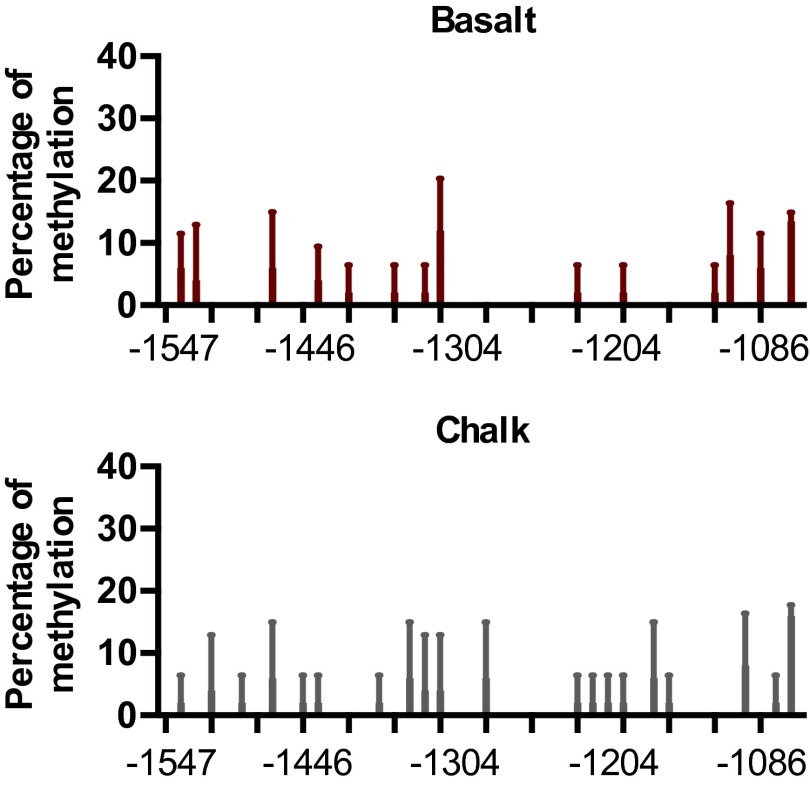
Methylation has been shown to be able to regulate gene transcription by blocking the binding of transcription factors to the DNA double-strand (21–24). We used MethPrimer to analyze the potential CpG islands on the promoter of S. galili p53 (25). Two CpG islands were predicted within the 2-kb upstream promoter region of S. galili p53, located at –1835∼–1735 and –1579∼–1047 (relative to the transcript start site, which was defined as +1), defined as island 1 and island 2, respectively (Fig. 3A). Besides these two islands, several CpG sites were found, although they are not methylated based on methylation analysis.
Fig. 3.
The differential methylation of S. galili p53 promoter modulates transcription of p53 involving Cux1, Pax4, Pax6, and AP-1. (A) Profiles of methylation status on the p53 promoter of S. galili living in basalt and chalk soils. (B) Sites showing different degrees of methylation between the two mole rat populations. (C) Cux1, Pax4, Pax6, and AP-1 contribute to the transcriptional regulation of S. galili p53. Results are mean ± SD of three independent experiments. *P < 0.05, **P < 0.01, and ***P < 0.001 (unpaired t test) compared with unmethylated S. galili p53 groups. +P < 0.05 and ++P < 0.01 compared with methylated S. galili p53 groups. #P < 0.05 and ##P < 0.01 compared with unmethylated S. galili mutant groups. &P < 0.05, &&P < 0.01, and &&&P < 0.001 compared with methylated S. galili mutant groups.
Bisulfite DNA sequencing PCR (BSP) was performed to detect the methylation status of these two CpG islands in the lung and liver of five animals from each mole rat population. Although no site was observed methylated within island 1, 25 out of 41 CpG sites within island 2 were methylated in different mole rat individuals, including 20 sites in the basalt population and 27 sites in the chalk population in the lung, as well as 14 sites in the basalt population and 20 sites in the chalk population in the liver (Fig. 3A and Fig. S3). Generally, the chalk mole rat population has higher methylation in several sites in the lung, including sites –1446, –1204, –1195, –1092, –1086, and –1044. Remarkably, site –1044, which is on the edge of island 2, had methylation in both populations, and it was significantly higher in the chalk population than in the basalt population (Fig. 2B). Pyrosequencing in this region was performed to confirm the higher methylation on specific sites in the chalk mole rat population.
Fig. S3.
Methylation of CpG island 2 of the p53 promoter in the liver of chalk and basalt populations.
Site Methylation Contributes to Divergent Expressions of S. galili p53 in the Lung of the Abutting Mole Rat Populations on Chalk and Basalt.
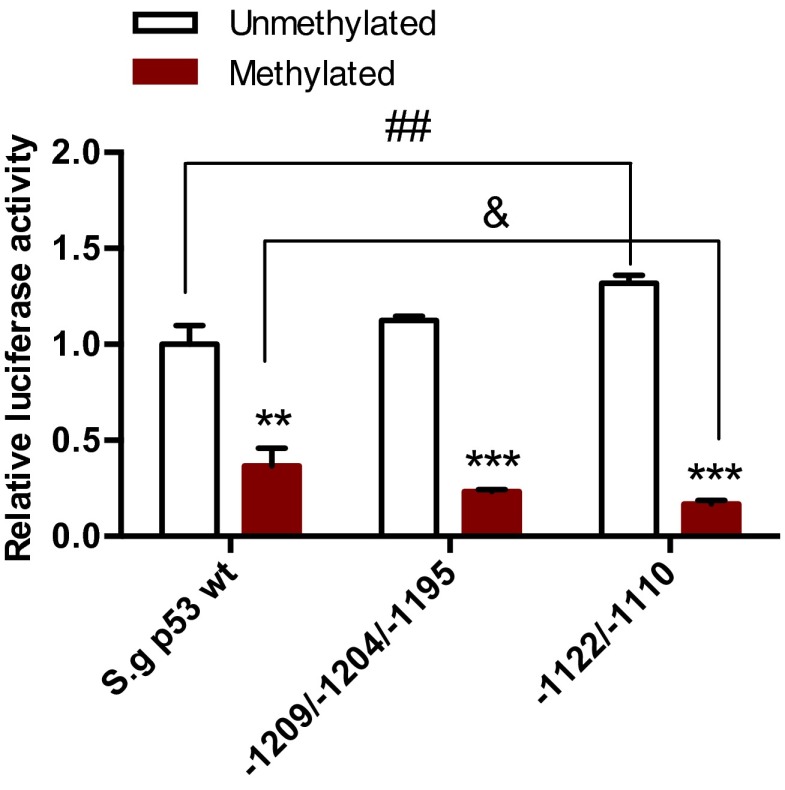
To identify the sites responsible for the differential expression of S. galili p53 between the two mole rat populations, site-directed mutagenesis was performed on the S. galili p53 promoter luciferase reporter plasmid (namely, S. galili p53-Luc reporter plasmid), changing each suspected CG site to AG, which abrogates its ability to be methylated on this site. In vitro methylation was performed to induce global methylation of the plasmids. Dual-luciferase activity assay was performed after transfection of the NCI-H1299 cell line. Expression plasmids of transcription factors were cotransfected with the wild-type or mutant p53 reporter plasmids with or without in vitro methylation treatment. The selected transcription factors include cAMP response element-binding protein (CREB), Elk-1, paired box 4 (Pax4), activator protein 1 (AP-1), Cut-Like Homeobox 1 (Cux1), E47, and Pax6, which potentially bind to the suspected CpG sites based on prediction using the MATCH software. Dual-luciferase assays showed that Cux1 could repress the transcription of p53, and the repression was blocked by methylation of the p53 promoter (Fig. 3C). Mutation of site –1086 rescued the repression by Cux1 (Fig. 3C), suggesting that the methylation on site –1086 blocked the binding of Cux1 to the p53 promoter, blocking its repression. A similar pattern was observed with Pax4, which also represses p53 transcription, and the repression was blocked by methylation. Site –1446 mutation rescued the repression of the methylated p53 promoter by Pax4 (Fig. 3C), suggesting that site –1446 is important for the binding of Pax4 to the p53 promoter, which could be influenced by methylation. Pax6 and AP-1 also showed different responses upon methylation of both wild-type p53 and the site –1204 mutant (Fig. 3C). Transcription of p53 induced by E47, CREB, or Elk-1 was not influenced by site mutation and methylation (Fig. 3C). Simultaneous mutations of CpG sites –1209/–1204/–1195 and –1122/–1110, respectively, were performed to show the integral effects of these sites. The sites –1209, –1122, and –1110 also showed higher methylation in the chalk mole rat population, although with no statistical significance. Moreover, all these sites are located within or next to the binding region of Pax6. Based on luciferase assays, although the –1122/–1110 mutant increased the transcription of p53, methylation with the mutant results in an even lower expression level of p53 compared with the wild-type p53 promoter (Fig. S4). This change suggests that these sites contributed, at least partly, to maintaining the expression of p53, probably contributed by Pax6. Taken together, the results suggest that the higher expression of p53 in the chalk mole rat population is due to the combination of methylation sites, which affects the regulation of p53 by transcription factors including Cux1, Pax4, Pax6, and AP-1.
Fig. S4.
Transcription of wild-type and mutant S. galili p53 promoter regulated by methylation. Results are mean ± SD (n = 3). **P < 0.01, ***P < 0.001 (unpaired t test) compared between methylated and unmethylated groups. ##P < 0.01 compared with the unmethylated wild-type S. galili p53 group. &P < 0.05 compared with the methylated wild-type S. galili p53 group.
Divergent Expressions of p53 from Two Abutting Mole Rat Populations Induce Different Degrees of Cell-Cycle Arrest.
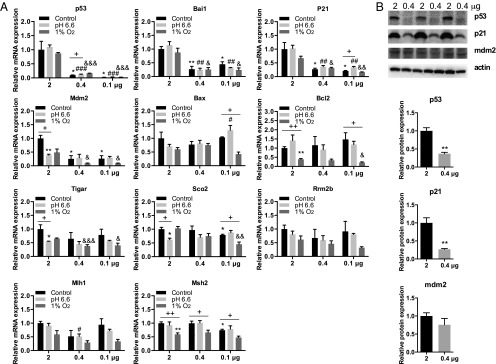
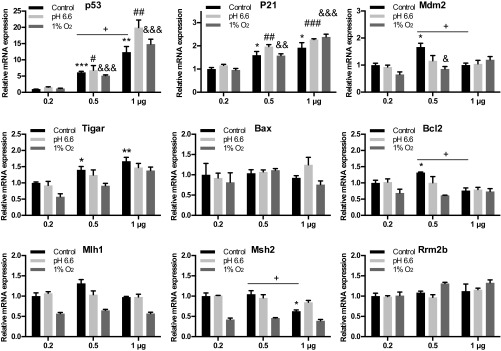
To assess the possible outcomes of the different p53 expression levels between the two abutting mole rat populations, we transfected the human nonsmall cell lung carcinoma cell line NCI-H1299 and rat liver cell line BRL-3A with three levels of S. galili p53 expression plasmid to mimic the different expressions of p53 in chalk and basalt mole rat populations. NCI-H1299 cells were transfected with 2, 0.4, or 0.1 μg of p53 plasmids, and qPCR was performed to determine the expression of p53 and a series of selected target genes. The expression level of p53 decreased significantly with the decrease of plasmid amount (Fig. 4A). Interestingly, among the 10 selected target genes, only the cell-cycle arrest genes p21 and Mdm2 and the antiangiogenesis gene Bai1 decreased with the decrease of p53. The p53 expression level did not influence any of the other genes involved in apoptosis, DNA repair, and metabolism (Fig. 4A). When subjected to stresses, these target genes showed different responses: Three genes were sensitive to acidic stress (pH 6.6) and two genes were sensitive to hypoxia (1% O2) under higher expression of p53, whereas three genes were sensitive to hypoxia and only one gene was sensitive to acidic stress under lower expression of p53 (Fig. 4A). Western blot was performed to confirm the different protein levels of p53 and p21 with different levels of transfection (Fig. 4B). Similarly, rat liver cell BRL-3A showed consistent regulating patterns between p53 and p21 mRNA levels even with a modest change of p53 level (Fig. S5), although some target genes were different from human cell lines, which may be explained by the different sequence of the target gene promoters between human and rodents.
Fig. 4.
(A) Selective regulation of target gene expression by different levels of p53 under normal, acidic, and hypoxic stresses. *P < 0.05 and **P < 0.01 compared with control groups with 2 μg p53 plasmid (unpaired t test). #P < 0.05, ##P < 0.01, and ###P < 0.001 compared with 2 μg p53 plasmid under acidic stress. &P < 0.05, &&P < 0.01, and &&&P < 0.001 compared with 2 μg p53 plasmid under hypoxia stress. +P < 0.05 and ++P < 0.01 compared between different stresses. (B) Protein levels of p53, p21, and mdm2 upon transfection of different levels of S. galili p53. **P < 0.05 compared with 2 μg p53 plasmid (unpaired t test).
Fig. S5.
Different levels of S. galili p53 have selective regulation to target genes under stresses. For different p53 levels, 0.2, 0.5, or 1 μg of S. galili p53 expression plasmid was transfected to BRL-3A cells under normal, acidic (pH 6.6), or hypoxia (1% O2) stresses. Expression of p53 and its target genes were determined using qPCR. Results are mean ± SEM (n = 3). *P < 0.05, **P < 0.01, and ***P < 0.001 compared with control groups with 0.2 μg p53 plasmid (unpaired t test). #P < 0.05, ##P < 0.01, and ###P < 0.001 compared with 0.2 μg p53 plasmid under acidic stress. &P < 0.05, &&P < 0.01, and &&&P < 0.001 compared with 0.2 μg p53 plasmid under hypoxia stress. +P < 0.05 compared between 0.5 μg and 1 μg p53 plasmid under normal condition.
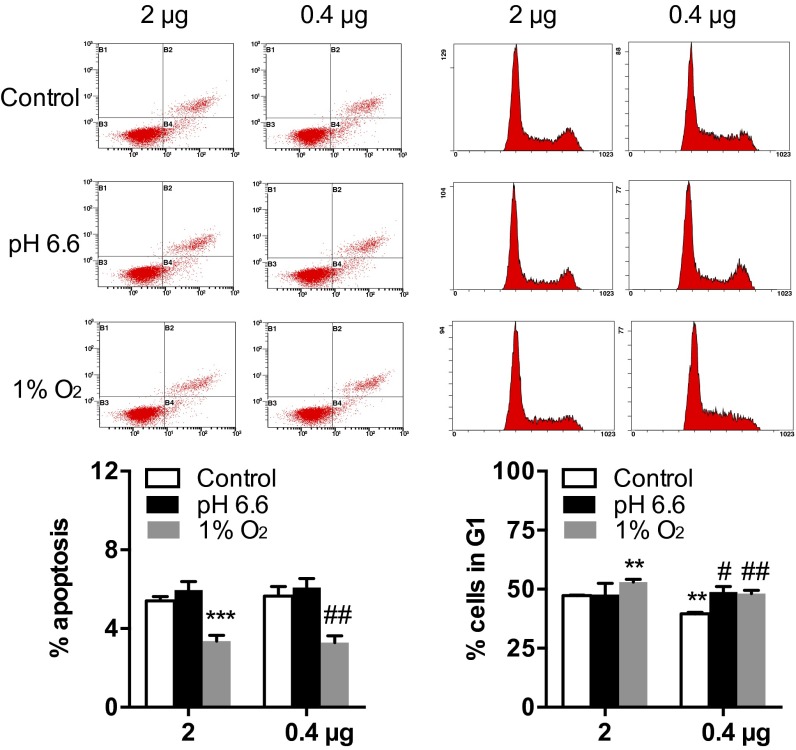
We then used flow cytometry to assess cell fates induced by different levels of p53 under stresses. Apoptosis induced by two levels of p53 did not show any difference, although they both decreased with a 1% O2 challenge (Fig. 5), suggesting a protective role of S. galili p53 under hypoxia. For cell-cycle arrest, a low level of p53 induced a lower G1 phase arrest as determined by DNA content assay (Fig. 5). They both showed an increase in G1 arrest under hypoxia, but only the lower level of p53 increased the G1 arrest under acidic stress (Fig. 5).
Fig. 5.
The levels of S. galili p53 are connected with divergent regulation of cell-cycle arrest. We transfected 2 or 0.4 μg of S. galili p53 plasmid to NCI-H1299 cells, and flow cytometry reflecting S. galili p53-induced cell fates was shown. Apoptosis was determined as the percentage of cells with positive PE staining and negative 7-AAD staining. Cell-cycle arrest was calculated based on the DNA content. Results are mean ± SD (n = 3). **P < 0.01 and ***P < 0.001 compared with the control group with 2 μg of S. galili p53 plasmid (unpaired t test). #P < 0.05 and ##P < 0.01 compared with the control group with 0.4 μg of S. galili p53 plasmid.
Discussion
Identical p53 Sequence with Divergent Functional Regulation in S. galili Abutting Populations on Chalk Versus Basalt Soils.
In the present study, we did not observe sequence differences of p53 (neither in the promoter nor in the coding region) between the two populations of S. galili living in the two abutting yet distinct soil types (chalk and basalt), representing contrasting ecologies. Remarkably, however, we found dramatically divergent expression of p53 and genes supervised by it in the lung of the two mole rat populations (Fig. 1). The twofold higher expression of p53 in the lung of the chalk mole rat population was accompanied with different fold changes of various target genes (e.g., Ercc5, Rrm2b, Bcl2, P21, and Bai1), whereas some of the genes remained unchanged. These results suggest the adaptive alterations of the p53 regulatory network in the two abutting mole rat populations that underwent incipient sympatric speciation (1, 3). Moreover, and very importantly, the divergent expression of the p53 pathway showed different patterns among tissues, reflecting the adaptive functional differentiation of different tissues and their physiological correlation with adaptation of respiratory, metabolic, and energy regulation.
Methylation Modification of S. galili p53 as a Result of Adaptive Evolution.
Recent studies showed that methylation changes significantly contributed to the molecular basis of evolution (17, 19). As a heritable epigenetic modification, methylation is believed to change (usually suppress) the transcription of genes by either altering the DNA structure or blocking the binding of transcriptional factors with DNA double-strand (21–24). Our results clearly showed that the methylation status differs between the chalk and basalt mole rat populations, in accordance with their diverse p53 network expression and contrasting ecological habitats, showing the important correlation between methylation and environmental adaptation. Remarkably, we identified higher degrees of methylation on sites –1446, –1204, –1195, –1092, –1086, and –1044 of the S. galili p53 promoter in the lung of mole rats of the chalk population, which play a role in enhancing, rather than impairing, the transcription of p53. Site-mutagenesis analysis showed that methylation of site –1086 blocked the binding and repression of Cux1 toward the p53 promoter (Fig. 3C), resulting in different transcription levels of p53 between the two abutting mole rat populations. Both CREB and E47 were shown to transactivate S. galili p53 and were not influenced by site mutation (CREB at site –1195 and E47 at site –1044) and methylation (Fig. 3C). CREB is closely linked to the regulation of corticotrophin-releasing hormone (CRH) and its type 1 receptor (CRHR1), which was demonstrated to trigger the transcription of p53 in rat liver and hepatic cells under hypoxia (26). The livers of chalk and basalt mole rat populations had different methylation levels on other sites—that is, –1092 and –1096. The two sites were found in the binding region of Pax4, which has been reported as a transcriptional repressor (27, 28). Transcriptional repression of S. galili p53 by Pax6 and AP-1 (partly) was altered upon mutation on the site –1204 (Fig. 3C), suggesting the role of this site for the binding of these two transcription factors. Taken together, the different methylation levels of S. galili p53 between the two sympatric chalk and basalt mole rat populations contribute to the different expressions of p53 by blocking the transcriptional repressors instead of the activators of p53.
Selective Downstream Outcomes Reflect the Role of p53 as a Master Regulator for Environmental Adaptation in Mole Rat Sympatric Speciation.
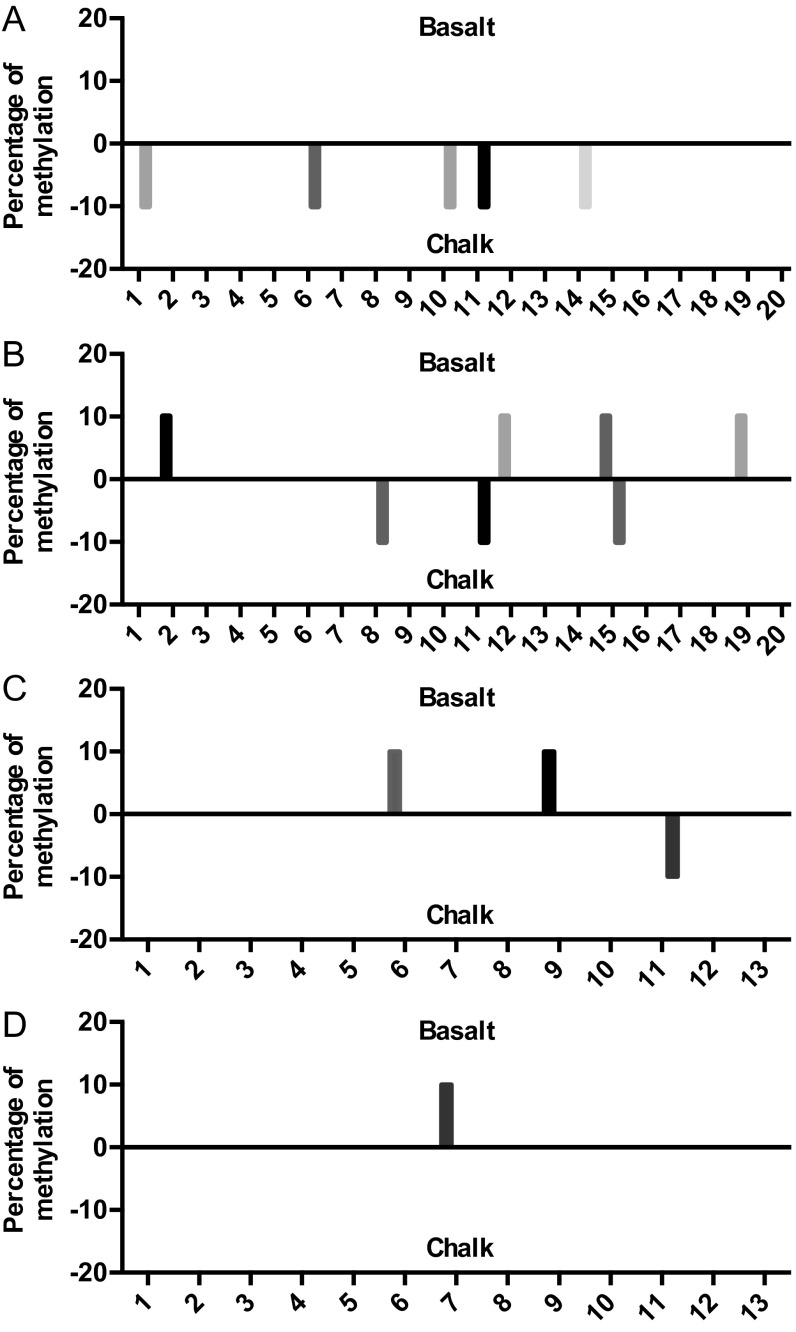
As we observed, the twofold difference of p53 expression between the chalk and basalt mole rat populations was accompanied with diverse downstream transcriptional outcomes, with increased cell-cycle genes p21 and Mdm2, DNA repair genes Ercc5 and Rrm2b, apoptosis gene Bcl2, and angiogenesis gene Bai1 (Fig. 1). Mimicking the effect of altered levels of p53 expression in human and rodent cell lines also showed a clear selective pattern toward cell-cycle arrest genes p21 and Mdm2 (Fig. 4A and Fig. S5). The expression of Bcl2 was higher in the tissue of the chalk mole rat population but not in the cell line with higher transfected p53 (Fig. 1 versus Fig. 4A). This difference may have resulted from possible sequence variations of their promoters or due to the effects of other transcription factors in the lung. The different methylation distributions on the promoter itself may also be the reason for the different expression of Bcl2 (Fig. S6).
Fig. S6.
Methylation of S. galili Bcl2 promoters of (A) island 1 in liver, (B) island 1 in brain, (C) island 2 in liver, and (D) island 2 in brain.
Apoptosis induced by a higher level (in the chalk mole rat population) and a lower level (in the basalt mole rat population) of p53 showed the same pattern, both decreased under hypoxia, suggesting a protective function of S. galili p53 to adapt to the hypoxic underground burrows (Fig. 5). The H1299 cell line lacks endogenous p53 expression, and the S. galili p53 R172K mutant p53 protein lacks the ability to induce apoptosis. Thus, the decrease of apoptosis under hypoxia with different levels of p53 may reflect the self-protection of cells in response to hypoxia as well as the lack of proapoptotic ability of S. galili p53. In accordance with the cell-cycle arrest genes, the G1 phase arrest induced by two levels of p53 showed differences. The lower level (basalt mole rat population) of p53 induced a lower percentage of G1 arrest and was more sensitive to acidic stress (Fig. 5). Cell-cycle arrest is associated with energy storage. The different cell-cycle arrests in the present study support the adaptation to different oxygen consumptions and resting metabolic rates between the two abutting soil mole rat populations, which was probably due to the different degrees of hypoxia and food accessibility between the two abutting soil types, with severer hypoxia in basalt especially during winter floods (1). The pH of two soil types differs greatly, with pH 7.8–8.0 in chalk and pH 7.0–7.4 in basalt (29–31), potentially leading to different buffering ability against the high ambient CO2 and hence hypercapnia. The more sensitive lower level of p53 (basalt mole rat population) to acidic stress-induced cell-cycle arrest (Fig. 5) demonstrated the regulatory adaptation of S. galili p53 to the different pHs in the two soil mole rat sympatrically divergent populations.
In summary, the sharply divergent chalk–basalt ecologies were the cause for the sympatric speciation of S. galili involving multiple adaptive complexes (1, 3). Remarkably, one of these adaptive complexes was that of the p53 pathway, which is sensitive to differential ecological stresses, as discovered in the present work. Hence the p53 pathway contributed remarkably to the adaptive ecological sympatric speciation of S. galili colonizing the new basalt habitat some 0.2–0.4 million years ago. We showed in this study adaptive genetic and epigenetic regulatory patterns in p53 and its supervised target genes related to cell fate under differential hypoxia and metabolism between the abutting chalk and basalt mole rat populations, and associated with adaptive ecological sympatric speciation, with restricted gene flow (1, 3) in the blind mole rat S. galili (2n = 52) in Israel. p53 and its regulatory gene network proved to be of cardinal importance in the adaptation to stressful and changing divergent environments. The sensitive ecological adaptability of the p53 regulatory network system may be beneficial for understanding evolutionary adaptation and speciation in nature. This might also be very relevant to human medicine, including cancer therapy.
Materials and Methods
The Institutional Ethics Committees of the University of Haifa and Zhejiang University approved all animal protocols. The blind mole rats, S. galili (2n = 52), were captured from the field in a defined region in the Upper Eastern Galilee Mountains. Ten individuals were collected from the Alma Pleistocene basalt plateau and 10 individuals from the Kerem Ben Zimra Senonian chalk (33°2.5′ N, 35° 29.2’ E, altitude 760 m above sea level) (1). Animals were euthanized, and tissues were stored in liquid nitrogen immediately after capture. Genomic DNA and total RNA were extracted from the liver, lung, spleen, kidney, and brain. Reverse transcription was performed to obtain the cDNA. The methods used in the present study (molecular cloning, qPCR, Western blot, plasmids, cell culture, transfection, methylation analysis, and dual-luciferase activity assay) are described in SI Materials and Methods.
SI Materials and Methods
Cloning of S. galili p53.
The CDS of S. galili p53 was cloned from the prepared cDNA. Primers were designed according to the S. judaei p53 cDNA sequence (GenBank accession no. AJ783406). A 2-kb upstream promoter fragment was amplified based on the genomic sequence of S. galili (16). Five individuals from each population were further sequenced to confirm authenticity. Alignment of p53 sequences was generated using Multalin software (multalin.toulouse.inra.fr/multalin) (32).
qPCR.
The mRNA levels were determined by using qPCR. Primers were synthesized according to the CDS of each gene of interest. Primer sequences are as follow: p53-F, 5′-GGA GCA CTA AGC GAG CAC TG-3′; p53-R, 5′-TTA TGA CGG GAG GTA GAC TGG-3′; Apaf1-F, 5′-TTC CTC CGC TTT CAA CCC TCC C-3′; Apaf1-R, 5′-TCT GCA TCC ATC TTC CCT CAA CTT TT-3′; Bai1-F, 5′- GGG GAC TAC TGT ATG CCT TCG TG-3′; Bai1-R, 5′-TGC CCG TTC CTT CAG CTT CTT-3′; Bax-F, 5′-TGG GTT GGA CGC TGG ACT T-3′; Bax-R, 5′-TGG TGA GTG AGG CAG TGA GGA-3′; Bcl2-F, 5′-GGC TAC GAA TGG GAT GCT GG-3′; Bcl2-R, 5′-GCG GTA ACG ACG GGA GAA GT-3′; Dbd2-F, 5′-AGG ACA AAC CCA CCT TCA TT-3′; Dbd2-R, 5′-CAC TTG GCT CTT GGT AGA AAC AT-3′; Ercc5-F, 5′-GGA AAG TGT ATG CTG GTG GT-3′; Ercc5-R, 5′-CGA GGT CAT GTT GGC TGA-3′; Gamt-F, 5′-AGG TCT GTG GGA GGA GGT AGC G-3′; Gamt-R, 5′-TTA ATG AAG TTG AAC TGG TGG GTG-3′; Gls2-F, 5′-TGC TGG TGC CAT TGT CGT-3′; Gls2-R, 5′-AGC CAT CAT ATC CAC TCC CTT A-3′; Igfbp3-F, 5′-AAA TGC CAG TGA GTC TGA GGA AGA-3′; Igfbp3-R, 5′-CTG TGA TTC ATA GTC AAC TTT GTA GCG-3′; Mdm2-F, 5′-TAC AGA TGA GGG CTT GGA TG-3′; Mdm2-R, 5′-GGA AGT GGA TGG CTG AGA AA-3′; Mgmt-F, 5′-CCT GGC TGG ATG CCT ACT TC-3′; Mgmt-R, 5′-GAG CCG CTT TGT GGT TGC-3′; Mlh1-F, 5′-TTG GAA GTT ATT GGC AGG TAT-3′; Mlh1-R, 5′-CAG TTG TGG CAT TGG GTA G-3′; Msh2-F, 5′-GGC AGA AGT GTC CAT TGT AG-3′; Msh2-R, 5′-GGC TAA CCC AAA TCC ATC-3′; Mlh1-F, 5′-TTG GAA GTT ATT GGC AGG TAT-3′; Mlh1-R, 5′-CAG TTG TGG CAT TGG GTA G-3′; P21-F, 5′-TGC CCG TCC AGT TCC ATA CA-3′; P21-R, 5′-AAA GTC GAA GTT CCA CCG TTC C-3′; Polk-F, 5′-ATT ACC CAC CAG CAA CTA A-3′; Polk-R, 5′-ACA GCA TAC TCA TTG ACC C-3′; Pten-F, 5′-ACC ATA ACC CAC CAC AGC-3′; Pten-R, 5′-TTA CAC CAG TCC GTC CCT-3′; Puma-F, 5′-GCA CGC CAG GAG GGC AGT TC-3′; Puma-R, 5′-GCT CAC AGA GGC CGC AGG ACA-3′; Rrm2b-F, 5′-ATC TCC CTC ACT GGA ACA A-3′; Rrm2b-R, 5′-TGA AAG CCA TAG AAA CAG C-3′; Sco2-F, 5′-CTG CTG GGT CTG ACT GGT TC-3′; Sco2-R, 5′-GTA GAT GGC AAT GGA GTG GTC-3′; Tigar-F, 5′-GAC CTG AAG TGT TCC CTA CCA-3′; Tigar-R, 5′-TGT CAC TCC ATT TAG ATG CTC C-3′; Tsp1-F, 5′-TGT GAC AGC CTC AAC AAC CG-3′; Tsp1-R, 5′-CAG TGA CTC CAG CCA CCA TC-3′; Xpc-F, 5′-GTG GCT GGA GGT GTT CTG TG-3′; Xpc-R, 5′-GGG CTT GGT GGC GTA TTT-3′; E47-F, 5′- TAC CCT TCC ACC AAG ACC C-3′; and E37-R, 5′-CGT TTC CTC CAC CAC CAC-3′.
For endogenous expression of target genes in the cell line, primers were synthesized based on the CDS of human genes: H-Bai1-F, 5′-CCT GTG CCT CCA ACT CAA-3′; H-Bai1-R, 5′-GAA CTG GTA TGG GAC TTG CT-3′; H-Bax-F, 5′-TGC TTC AGG GTT TCA TCC AGG-3′; H-Bax-R, 5′-TGA GAC ACT CGC TCA GCT TCT TG-3′; H-Bcl2-F, 5′-TTC AGG GAC GGG GTG AAC TG-3′; H-Bcl2-R, 5′-GAC AGC CAG GAG AAA TCA AAC AGA G-3′; H-Mdm2-F, 5′-AGG GAA GAA ACC CAA GAC-3′; H-Mdm2-R, 5′-GTA AAG CAG GCC ATA AGA T-3′; H-Mlh1-F, 5′-CCC CTT CTG ATT GAC AAC TAT-3′; H-Mlh1-R, 5′-CCA GGC ACT TCA CTC TGC-3′; H-P21-F, 5′-TCA CCG AGA CAC CAC TGG AGG G-3′; H-P21-R, 5′-GCG AGG CAC AAG GGT ACA AGA CA-3′; H-Rrm2b-F, 5′-CTC CCT CAC TGG AAC AAG C-3′; H-Rrm2b-R, 5′-TTG AAA GCC ATA GAA ACA GC-3′; H-Sco2-F, 5′-ACA GGT TGC CCA GGC TAG TCA C-3′; H-Sco2-R, 5′-CCG TCA GGG TTG AGC AGG TAG AT-3′; H-Tigar-F, 5′-CCC AAG GAT CTC CAA GC-3′; H-Tigar-R, 5′-AGC ACC GTG ACT CAC AAC T-3′; H-Msh2-F, 5′-AAG GCA TCC AAG GAG AAT-3′; and H-Msh2-R, 5′-CCA TCA ACT GCG GAC AT-3′.
The relative mRNA expression levels in the two populations were normalized to the housekeeping gene 18S rRNA.
Western Blot.
Western blot was performed to determine the protein level of p53, p21, and mdm2 in tissues and cell lines. Monoclonal antibodies against p53 (1C12; Cell Signaling), p21 (12D1; Cell Signaling), and mdm2 (ab3110; Abcam) were used. Lysed samples were centrifuged (14,000 × g for 15 min) at 4 °C. All samples were boiled with 6× loading buffer at 95 °C for 5 min. After electrophoresis, proteins were transferred to PVDF membrane and incubated with the indicated antibodies. Visualization was performed using the ChemiDoc Touch Imaging System (Bio-Rad).
DNA Methylation Analysis.
CpG islands prediction and BSP primers were analyzed using the MethPrimer software (www.urogene.org/methprimer/) (25). Genomic DNA was isolated from the liver and lung of S. galili from both soil-type populations and was then subjected to a bisulfite-convert using EZ-DNA Methylation-Gold Kit (Zymo Research Corp.). The treatment converts every unmethylated cytosine (C) to uracil (U). The fragment of interest was amplified using PCR. The PCR products were ligated into a pGEM-T Easy Vector and then transformed into competent Escherichia coli TG1. Ten clones were randomly selected, and the plasmids were sequenced. Every unchanged C of CpG sites was considered to be a methylated site. The degree of methylation was calculated as the proportion of unchanged C in all 10 clones for each individual. Pyrosequencing was performed on some specific sites to confirm the results.
Transcription Factor Binding Sites Prediction.
Transcription factor binding sites were predicted using the MATCH software (www.gene-regulation.com/pub/programs.html), with cutoff selection for matrix to minimize the false negatives.
Plasmids and Site-Directed Mutagenesis.
The CDS of S. galili p53 was subcloned into a pcDNA3.1+ vector, forming an S. galili p53 expression plasmid. A 2,126 bp of a 5′ upstream fragment of S. galili p53 was subcloned into pGL3-basic vector by Mlu1 and Xho1, forming an S. galili p53-Luc reporter plasmid. Site-directed mutagenesis was performed on the indicated sites using the Fast Mutagenesis System (TransGen Biotech).
Cell Line.
Human nonsmall cell lung cancer cells NCI-H1299 [American Type Culture Collection (ATCC) CRL-5803] and rat liver cell line BRL-3A (ATCC CRL-1442) were grown in RPMI medium 1640 (Gibco) containing 10% (vol/vol) FBS, 100 μg/mL streptomycin, and 100 units per mL of penicillin at 37 °C in a humidified incubator with 5% (vol/vol) CO2.
In Vitro Methylation Treatment.
Ten μg of pGL3-basic, S. galili p53-Luc, or S. galili p53-Luc mutants were methylated using 10 U of CpG methyltransferase and S-adenosylmethionine (New England Biolabs) in 50 μL at 37 °C for 3 h, followed by inactivation of the enzyme at 65 °C for 20 min. S-adenosylmethionine was added every 1.5 h due to its instability at 37 °C.
Transient Transfection and Dual-Luciferase Reporter Assay.
NCI-H1299 cells were plated in 24-well plates at 100,000 cells per well for 24 h before transfection. Transient transfection was performed using PolyJet transfection reagent (SignaGen Laboratories). The 0.5 μg of S. galili p53-Luc reporter plasmids (wild type or mutants) with or without methylation modifications was cotransfected with 0.005 μg of pRL-CMV vector (Promega Corp.). Twenty-four hours after transfection, cells were harvested and dual-luciferase activity assay was performed using a dual-luciferase reporter assay system (Promega Corp.).
Flow Cytometry.
For apoptosis, transfected cells were harvested and stained with Annexin V-phycoerythrin (PE) and 7-amino-acinomycin D (7-AAD) for 15 min at room temperature before being subjected to flow cytometry (Beckman FC 500 MCL). Samples were gated to the staining of PE and 7-AAD. Apoptosis was calculated as the percentage of cells with positive PE staining and negative 7-AAD staining. For cell-cycle arrest, DNA content was detected by staining cells with propidium iodide as previously described (12).
Statistical Analysis.
Statistical analysis was performed using GraphPad Prism 6.0 (GraphPad Software Inc.). Statistical significance compared between two independent groups was determined with a two-tailed, unpaired Student t test. Comparisons among multiple groups were conducted with one-way ANOVA, followed by the Least Significant Difference test.
Acknowledgments
We thank Dr. Avigdor Beiles at the Institute of Evolution, University of Haifa, for his comments on the statistics and Robin Permut for editing the paper. This work was supported by National Basic Research Program (973) of the Ministry of Science and Technology of China Grants 2012CB518200 and 2006CB504100 and National Natural Science Foundation of China Grants 31471140, 31071047, and 30870300. Y.Z. received a grant from the Postdoctorate Science Foundation of China (2014M550321). E.N. received financial support from the Ancell-Teicher Research Foundation for Genetics and Molecular Evolution.
Footnotes
The authors declare no conflict of interest.
Data deposition: The sequences reported in this paper have been deposited in the GenBank database [accession nos. KP799008 (S. galili p53 CDS) and KP799009 (S. galili p53 promoter)].
This article contains supporting information online at www.pnas.org/lookup/suppl/doi:10.1073/pnas.1522658112/-/DCSupplemental.
References
- 1.Hadid Y, et al. Possible incipient sympatric ecological speciation in blind mole rats (Spalax) Proc Natl Acad Sci USA. 2013;110(7):2587–2592. doi: 10.1073/pnas.1222588110. [DOI] [PMC free article] [PubMed] [Google Scholar]
- 2.Hadid Y, et al. Sympatric incipient speciation of spiny mice Acomys at “Evolution Canyon,” Israel. Proc Natl Acad Sci USA. 2014;111(3):1043–1048. doi: 10.1073/pnas.1322301111. [DOI] [PMC free article] [PubMed] [Google Scholar]
- 3.Li K, et al. Sympatric speciation revealed by genome-wide divergence in the blind mole rat Spalax. Proc Natl Acad Sci USA. 2015;112(38):11905–11910. doi: 10.1073/pnas.1514896112. [DOI] [PMC free article] [PubMed] [Google Scholar]
- 4.Nevo E, Ivanitskaya E, Beiles A. Adaptive Radiation of Blind Subterranean Mole Rats: Naming and Revisiting the Four Sibling Species of the Spalax ehrenbergi superspecies in Israel: Spalax galili (2n=52), S. golani (2n=54), S. carmeli (2n=58) and S. judaei (2n=60) Bachkhuys Publishers; Leiden, The Netherlands: 2001. [Google Scholar]
- 5.Asker C, Wiman KG, Selivanova G. p53-induced apoptosis as a safeguard against cancer. Biochem Biophys Res Commun. 1999;265(1):1–6. doi: 10.1006/bbrc.1999.1446. [DOI] [PubMed] [Google Scholar]
- 6.Zhao Y, Chen XQ, Du JZ. Cellular adaptation to hypoxia and p53 transcription regulation. J Zhejiang Univ Sci B. 2009;10(5):404–410. doi: 10.1631/jzus.B0820293. [DOI] [PMC free article] [PubMed] [Google Scholar]
- 7.Resnick MA, Inga A. Functional mutants of the sequence-specific transcription factor p53 and implications for master genes of diversity. Proc Natl Acad Sci USA. 2003;100(17):9934–9939. doi: 10.1073/pnas.1633803100. [DOI] [PMC free article] [PubMed] [Google Scholar]
- 8.Resnick MA, Tomso D, Inga A, Menendez D, Bell D. Functional diversity in the gene network controlled by the master regulator p53 in humans. Cell Cycle. 2005;4(8):1026–1029. doi: 10.4161/cc.4.8.1904. [DOI] [PubMed] [Google Scholar]
- 9.Ashur-Fabian O, et al. Evolution of p53 in hypoxia-stressed Spalax mimics human tumor mutation. Proc Natl Acad Sci USA. 2004;101(33):12236–12241. doi: 10.1073/pnas.0404998101. [DOI] [PMC free article] [PubMed] [Google Scholar]
- 10.Menendez D, Inga A, Resnick MA. The biological impact of the human master regulator p53 can be altered by mutations that change the spectrum and expression of its target genes. Mol Cell Biol. 2006;26(6):2297–2308. doi: 10.1128/MCB.26.6.2297-2308.2006. [DOI] [PMC free article] [PubMed] [Google Scholar]
- 11.Menendez D, Inga A, Jordan JJ, Resnick MA. Changing the p53 master regulatory network: ELEMENTary, my dear Mr Watson. Oncogene. 2007;26(15):2191–2201. doi: 10.1038/sj.onc.1210277. [DOI] [PubMed] [Google Scholar]
- 12.Zhao Y, et al. Codon 104 variation of p53 gene provides adaptive apoptotic responses to extreme environments in mammals of the Tibet plateau. Proc Natl Acad Sci USA. 2013;110(51):20639–20644. doi: 10.1073/pnas.1320369110. [DOI] [PMC free article] [PubMed] [Google Scholar]
- 13.Shams I, Avivi A, Nevo E. Hypoxic stress tolerance of the blind subterranean mole rat: Expression of erythropoietin and hypoxia-inducible factor 1 alpha. Proc Natl Acad Sci USA. 2004;101(26):9698–9703. doi: 10.1073/pnas.0403540101. [DOI] [PMC free article] [PubMed] [Google Scholar]
- 14.Avivi A, et al. Neuroglobin, cytoglobin, and myoglobin contribute to hypoxia adaptation of the subterranean mole rat Spalax. Proc Natl Acad Sci USA. 2010;107(50):21570–21575. doi: 10.1073/pnas.1015379107. [DOI] [PMC free article] [PubMed] [Google Scholar]
- 15.Avivi A, Resnick MB, Nevo E, Joel A, Levy AP. Adaptive hypoxic tolerance in the subterranean mole rat Spalax ehrenbergi: The role of vascular endothelial growth factor. FEBS Lett. 1999;452(3):133–140. doi: 10.1016/s0014-5793(99)00584-0. [DOI] [PubMed] [Google Scholar]
- 16.Fang X, et al. Genome-wide adaptive complexes to underground stresses in blind mole rats Spalax. Nat Commun. 2014;5:3966. doi: 10.1038/ncomms4966. [DOI] [PubMed] [Google Scholar]
- 17.Skinner MK, et al. Epigenetics and the evolution of Darwin’s Finches. Genome Biol Evol. 2014;6(8):1972–1989. doi: 10.1093/gbe/evu158. [DOI] [PMC free article] [PubMed] [Google Scholar]
- 18.Ji X, et al. Somatic mutations, viral integration and epigenetic modification in the evolution of hepatitis B virus-induced hepatocellular carcinoma. Curr Genomics. 2014;15(6):469–480. doi: 10.2174/1389202915666141114213833. [DOI] [PMC free article] [PubMed] [Google Scholar]
- 19.Alonso C, Pérez R, Bazaga P, Herrera CM. Global DNA cytosine methylation as an evolving trait: Phylogenetic signal and correlated evolution with genome size in angiosperms. Front Genet. 2015;6:4. doi: 10.3389/fgene.2015.00004. [DOI] [PMC free article] [PubMed] [Google Scholar]
- 20.el-Deiry WS. Regulation of p53 downstream genes. Semin Cancer Biol. 1998;8(5):345–357. doi: 10.1006/scbi.1998.0097. [DOI] [PubMed] [Google Scholar]
- 21.Jaenisch R, Bird A. Epigenetic regulation of gene expression: How the genome integrates intrinsic and environmental signals. Nat Genet. 2003;33(Suppl):245–254. doi: 10.1038/ng1089. [DOI] [PubMed] [Google Scholar]
- 22.Kass SU, Pruss D, Wolffe AP. How does DNA methylation repress transcription? Trends Genet. 1997;13(11):444–449. doi: 10.1016/s0168-9525(97)01268-7. [DOI] [PubMed] [Google Scholar]
- 23.Kass SU, Landsberger N, Wolffe AP. DNA methylation directs a time-dependent repression of transcription initiation. Curr Biol. 1997;7(3):157–165. doi: 10.1016/s0960-9822(97)70086-1. [DOI] [PubMed] [Google Scholar]
- 24.Leonhardt H, Cardoso MC. DNA methylation, nuclear structure, gene expression and cancer. J Cell Biochem Suppl. 2000;Suppl 35:78–83. doi: 10.1002/1097-4644(2000)79:35+<78::aid-jcb1129>3.0.co;2-j. [DOI] [PubMed] [Google Scholar]
- 25.Li LC, Dahiya R. MethPrimer: Designing primers for methylation PCRs. Bioinformatics. 2002;18(11):1427–1431. doi: 10.1093/bioinformatics/18.11.1427. [DOI] [PubMed] [Google Scholar]
- 26.Zhao Y, Wang MY, Hao K, Chen XQ, Du JZ. CRHR1 mediates p53 transcription induced by high altitude hypoxia through ERK 1/2 signaling in rat hepatic cells. Peptides. 2013;44:8–14. doi: 10.1016/j.peptides.2013.03.023. [DOI] [PubMed] [Google Scholar]
- 27.Smith SB, Ee HC, Conners JR, German MS. Paired-homeodomain transcription factor PAX4 acts as a transcriptional repressor in early pancreatic development. Mol Cell Biol. 1999;19(12):8272–8280. doi: 10.1128/mcb.19.12.8272. [DOI] [PMC free article] [PubMed] [Google Scholar]
- 28.Sosa-Pineda B. The gene Pax4 is an essential regulator of pancreatic beta-cell development. Mol Cells. 2004;18(3):289–294. [PubMed] [Google Scholar]
- 29.Grishkan I, Tsatskin A, Nevo E. Diversity of cultured microfungal communities in surface horizons of soils on different lithologies in Upper Galilee, Israel. Eur J Soil Biol. 2008;44(2):180–190. [Google Scholar]
- 30.Grishkan I, Tsatskin A, Nevo E. Comparative mycobiotic and edaphic analyses of two neighboring soil profiles on different lithologies in Upper Galilee, Israel. Eur J Soil Biol. 2009;45(4):341–350. [Google Scholar]
- 31.Lovy M, et al. Habitat and burrow system characteristics of the blind mole rat Spalax galili in an area of supposed sympatric speciation. PLoS One. 2015;10(7):e0133157. doi: 10.1371/journal.pone.0133157. [DOI] [PMC free article] [PubMed] [Google Scholar]
- 32.Corpet F. Multiple sequence alignment with hierarchical clustering. Nucleic Acids Res. 1988;16(22):10881–10890. doi: 10.1093/nar/16.22.10881. [DOI] [PMC free article] [PubMed] [Google Scholar]


