Significance
The control of a microbial infection by effector T cells is intrinsically linked to their migration. However, little is known about the mechanisms that control effector T-cell egress after infection. Sphingosine-1-phosphate receptor-1 (S1PR1) is a G-coupled protein receptor that plays an important role in naive T-cell egress from lymph nodes. However, less is known about its role in regulating effector T-cell trafficking during infection. Here, we used an inducible mouse model with temporally disrupted S1PR1 signaling exclusively in endogenous effector CD8 T cells to demonstrate that, after infection, even in the absence of retention signals such as CC chemokine receptor 7 (CCR7), intrinsic S1PR1 signaling is the overriding factor that regulates effector T-cell egress kinetics from the draining lymph node.
Keywords: T-cell migration, sphingosine phosphate receptor-1, T-cell activation, infection
Abstract
Viral clearance requires effector T-cell egress from the draining lymph node (dLN). The mechanisms that regulate the complex process of effector T-cell egress from the dLN after infection are poorly understood. Here, we visualized endogenous pathogen-specific effector T-cell migration within, and from, the dLN. We used an inducible mouse model with a temporally disrupted sphingosine-1-phosphate receptor-1 (S1PR1) gene specifically in endogenous effector T cells. Early after infection, WT and S1PR1−/− effector T cells localized exclusively within the paracortex. This localization in the paracortex by CD8 T cells was followed by intranodal migration by both WT and S1PR1−/− T cells to positions adjacent to both cortical and medullary lymphatic sinuses where the T cells exhibited intense probing behavior. However, in contrast to WT, S1PR1−/− effector T cells failed to enter the sinuses. We demonstrate that, even when LN retention signals such as CC chemokine receptor 7 (CCR7) are down-regulated, T cell intrinsic S1PR1 is the master regulator of effector T-cell emigration from the dLN.
An effective immune response depends on the large-scale, but carefully regulated, migration of T cells within and between lymphoid and peripheral tissues. This migration is tightly regulated by several factors, including the highly organized secondary lymphoid structure and the cellular expression of chemokine receptors and compartmentalized secretion of their cognate ligands (1). This balance between the anatomy and the ordered expression of cell surface and soluble proteins dictates the exquisite choreography of T-cell migration, and visualizing these dynamics of T-cell behavior in situ within the lymph nodes (LNs) is essential for understanding the mechanisms that mediate the generation of a productive antimicrobial or antitumoral immune response (1, 2). However, our understanding of the factors that regulate the anatomical program followed by endogenous antigen-specific effector T cells after an infection remains incomplete, especially with respect to the mechanisms that regulate egress kinetics of effector T cells from LN (2, 3).
T-cell migration, even at steady state, is a highly regulated process (4). T-cell entry into the LN is controlled by G protein-coupled receptors (GPCRs) (3) such as CC chemokine receptor 7 (CCR7), which is also critical for the localization and retention of T cells within the LN paracortex (5, 6). Egress of naive T cells from the LN via the lymphatic vessels is regulated by the GPCR sphingosine-1-phosphate receptor-1 (S1PR1) (3) and adhesion molecules (4). S1PR1 is among four other GPCRs that bind to sphingosine-1-phosphate (S1P) with high affinity. S1PR1 is abundantly expressed in different cell types and tissues, including immune cells and endothelial cells (7). In addition to mediating lymphocyte egress, binding of S1P to S1PR1 and other receptors (S1PR2 to -5) on the cell surface initiates several signaling cascades that affect the functioning of many organ systems and control a multitude of biological functions, including inflammation, cell survival and differentiation, cardiovascular function, and vascular permeability (8).
Several recent studies have investigated the mechanisms by which S1PR1 regulates naive T-cell egress (9–14). Several groups have used FTY720 (Fingolimod) to investigate the role of S1PR1 in vivo. However, FTY720 is a broad modulator of four different S1P receptors (S1PR1 and S1PR3 to -5) and is a potent receptor agonist that initially activates the receptors but subsequently induces the internalization and degradation of the S1P receptors and consequently is considered a functional antagonist. Indeed, administration of FTY720 in mice blocks naive T-cell egress from the thymus and LN (15) and peripheral homing of effector T cells (16). However, it is not clear whether FTY720 exerts its effect primarily by targeting the endothelial cells or T cells although a recent study favored the idea that FTY720 exerts its function by targeting T cells (14). Nevertheless, studies that favor a T-cell intrinsic mechanism by which S1PR1 regulates naive T-cell egress used S1PR1−/− T cells to demonstrate that S1PR1-deficient naive T cells failed to exit the thymus (17, 18) and LN (11), which mimicked the results obtained by using FTY720. However, S1PR1 is also abundantly expressed on endothelial cells, where it regulates lymphatic vascular permeability (7, 19, 20). Studies using S1PR1-specific agonists (21) and antagonists (9, 22) have implicated a more critical role of lymphatic S1PR1 in regulating naive lymphocyte egress, evidently by sealing the lymphatic endothelial barrier and disallowing naive T-cell egress from LN and thymus. These studies have been instrumental in improving our understanding of how S1PR1 controls naive lymphocyte migration. However, the mechanisms that regulate the dynamics of effector T-cell egress during an infection are less understood (3).
The exact intranodal localization, exit points, and mechanisms that regulate the complex process of effector T-cell egress from the draining lymph node (dLN) after infection and inflammatory conditions are not well understood. Moreover, it is not known, after T-cell activation after an infection, when LN retention signals such as CCR7 and its ligands are down-regulated (23), whether the effector T cells are still dependent on S1PR1 for egress. Furthermore, in an inflammatory milieu after infection, when S1P levels are likely altered (8, 20, 24), it remains to be determined what are the roles of T cell-intrinsic or stromal cell-intrinsic expression of S1PR1 in regulating effector T-cell trafficking. Therefore, in the current study, we addressed these unanswered questions by disrupting S1PR1 signals specifically and temporally in endogenous effector CD8 T cells after infection to demonstrate the mechanisms that regulate the dynamics of endogenous effector CD8 T-cell egress after infection.
Results
Antigen-Specific T-Cell Egress Kinetics After a Local Viral Infection.
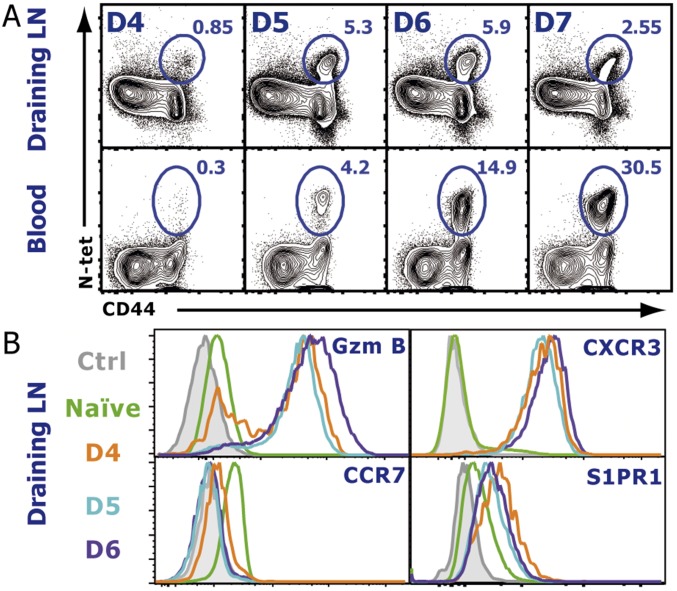
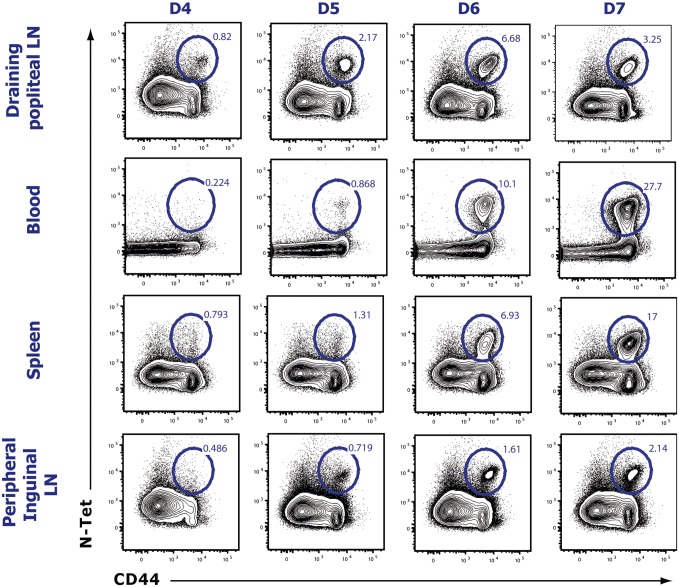
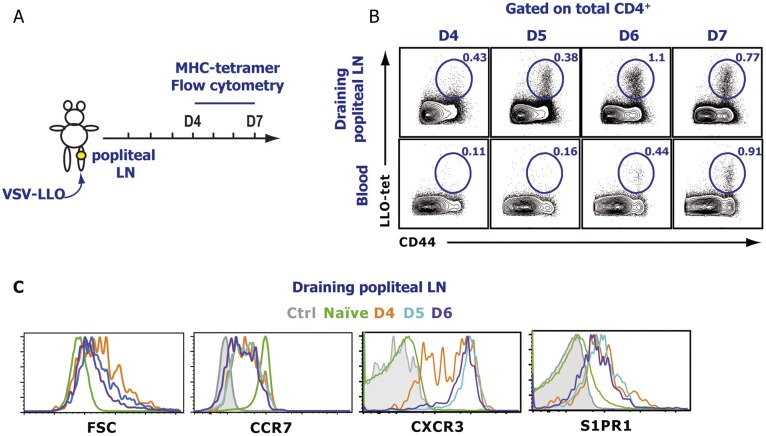
We first sought to determine the time course of effector T-cell emigration from the dLN after a localized viral infection. Mice were infected s.c. into the footpad with vesicular stomatitis virus (VSV), and the popliteal LN and blood were analyzed for VSV-specific CD8 T cells using MHC class I tetramers specific for the immunodominant VSV-derived nucleoprotein peptide (N-tet). A small population of N-tet+ CD8 T cells was detectable in the dLN at day 4 postinfection (p.i.) (Fig. S1A). N-tet+ CD8 T cells continued to expand in the dLN over the next 3 d. N-tet+ CD8 T cells could first be appreciably detected in the blood between days 5 and 7 p.i., suggesting that the majority of N-tet+ CD8 T-cell egress occurred during this time. By day 7–8 p.i., a majority of the antigen-specific CD8 T cells had migrated to the peripheral tissues. Because, early after VSV infection (4–5 d), very few N-tet+ CD8 T cells were detected in non-dLN or the spleen (Fig. S2), the major source of the N-tet+ CD8 T cells in the blood was the draining popliteal LN. Therefore, these data reveal that, after a localized VSV infection, antigen-specific CD8 T cells exhibit a relatively short exit window. As expected, by day 4 p.i., virtually all N-tet+ CD8 T cells expressed granzyme B (GzmB) exhibiting an effector phenotype. In addition, retention signals, such as CCR7 (Fig. S1B), were down-regulated whereas CXCR3 expression was increased. Intriguingly, effector T cells (day 4–6 p.i.) in fact expressed higher levels of S1PR1 compared with naive T cells (Fig. S1B), suggesting that, although S1PR1 expression is decreased early after activation (12, 25), as effector T cells proliferate, the expression of S1PR1 is rapidly restored and even increased. To determine whether a similar migration profile occurred for antigen-specific effector CD4 T cells, we generated a recombinant VSV (VSV-LLO) expressing the class II restricted LLO190–201 peptide to track endogenous LLO-specific CD4 T cells using an I-Ab tetramer (LLO-Tet) after infection. After VSV-LLO infection, LLO-specific CD4 T cells expanded in the dLN (Fig. S3 A and B). Additionally, the chemokine receptor expression pattern of LLO-Tet+ CD4 T cells was similar to their effector CD8 T-cell counterparts (Figs. S1B and S3C). Taken together, our results show that the phenotype of both CD8 and CD4 effector T cells between days 5 and 7 p.i. favored cellular egress from the dLN, suggesting that similar mechanisms may regulate effector CD8 and CD4 T-cell migration.
Fig. S1.
Endogenous antigen-specific T-cell egress kinetics and phenotype after infection. (A) At the indicated days p.i., the dLN (popliteal) and blood were harvested, and VSV-specific CD8 T cells were detected by staining with an N-Kb tetramer. Dot plots represent gated CD8+ cells. (B) Time course of the chemokine receptor expression on CD8+, CD44+, N-tet+ effector T cells. Naive cells were gated on CD44−, CD62lhi T cells. See also Fig. S1 for N-tet distribution and Fig. S2 for CD4+ LLO-tet+ phenotype. The data shown are representative of six different experiments with three mice per time point.
Fig. S2.
The draining popliteal LN is the primary source of antigen-specific T cells. Mice were infected s.c in the footpad with 5 × 10⁴ pfu of VSV, and indicated organs were harvested between day 4 and day 7 p.i. Cell suspensions of each organ were stained for VSV-specific effector (CD44+) CD8 T cells. Previously gated on CD8-positive naive cells. Numbers indicate population frequency among CD8+ T cells. Results are representative of four different experiments, each analyzing three mice per time point.
Fig. S3.
Endogenous antigen-specific CD4 T-cell egress kinetics and phenotype after infection. (A) Mice were infected s.c in the footpad with 5 × 10⁴ pfu of VSV that expresses the LLO190–201 peptide. At the indicated times p.i., (B) the dLN (popliteal) and blood were harvested, and LLO-specific CD4 T cells were detected by staining with an LLO MHC class-II tetramer. Dot plots were previously gated on total CD4. (C) Time course (see indicated times) of chemokine receptor expression gated on endogenous antigen-specific effector T cells (CD4+, CD44+, LLO-tet+), except naive cells that were gated on CD44−, CD62Lhi T cells after a localized VSV infection. The data shown are representative of six different experiments, with at least three mice per time point.
After Skin Infection, Endogenous Effector CD8 T Cells Localize to the Periphery of the dLN Around the Medullary and Cortical/Interfollicular Lymphatic Sinuses as They Exit the LN.
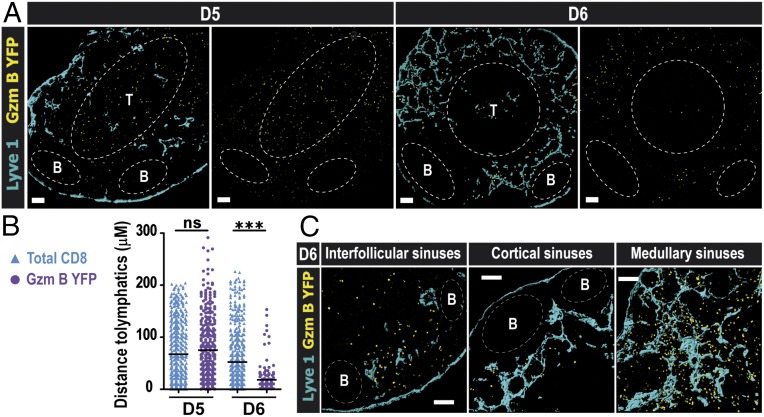
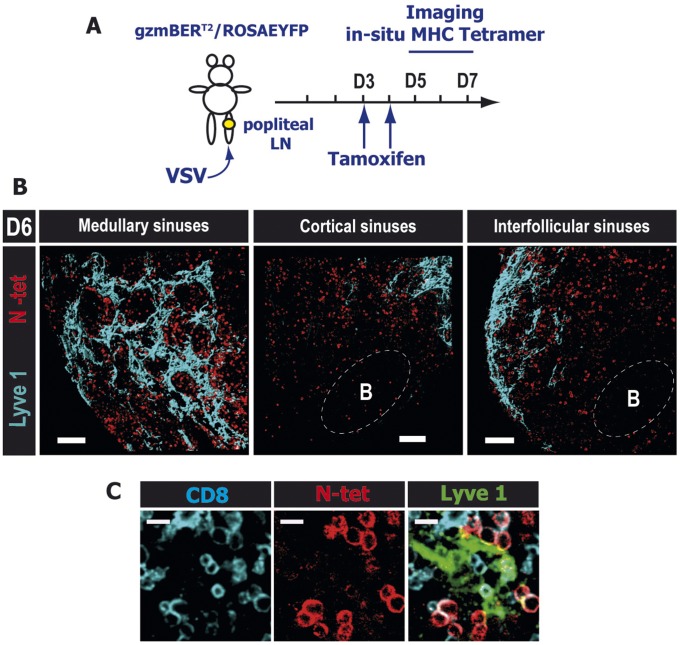
We next visualized the exact exit points that the effector CD8 T cells use to egress the dLN after infection. To this end, we used a reporter mouse gzmBERT2/ROSAEYFP (26) that expresses YFP under the control of the GzmB promoter (GzmB YFP), but only in the presence of the drug tamoxifen. GzmBERT2/ROSAEYFP mice were treated with tamoxifen at day 3 p.i. to ensure that effector CD8 T cells, generated in the dLN after local VSV infection, expressed YFP and could be tracked after activation. The majority of the effector CD8 T cells (GzmB YFP) at day 5 p.i. were localized in the LN cortex (Fig. 1 A, Left), but, 24 h later (day 6 p.i.), virtually all of the effector CD8 T cells had undergone a dramatic redistribution to the periphery of the dLN and were observed in close contact with the lymphatic vessels (Fig. 1 B and C and Fig. S4), particularly in both the cortical/interfollicular as well as the medullary sinuses. Notably, the number of effector CD8 T cells located near the LN medullary sinus was considerably higher compared with cortical/interfollicular sinuses. These data suggested that, in contrast to naive T cells (11), effector T cells used both the cortical and medullary sinuses to exit the dLN. To confirm our results with the gzmBERT2/ROSAEYFP reporter mouse, we performed in situ tetramer staining on thick LN sections (27). Indeed, at day 6 p.i., even deep in the LN tissue, N-tet+ CD8 T cells were localized around the lymphatic sinuses similarly to the YFP+ effector CD8 T cells, with a greater number of cells located in the medullary region (Fig. S5 and Movie S1).
Fig. 1.
After a localized viral infection, endogenous effector CD8 T cells localize to the periphery of the dLN in the medullary and cortical/interfollicular lymphatic sinuses as they exit the LN. GzmBERT2/ROSAEYFP (GzmB YFP) mice were infected into the footpad and subsequently treated orally with 1 mg of tamoxifen starting at day 3 p.i. (A) In situ imaging of YFP+ cells in the dLN at days 5 and 6 p.i. Distribution of endogenous effector T cells (GzmB YFP; yellow) can be seen with respect to the Lyve1+ lymphatic vessels (blue). (Scale bars: 100 μm.) (B) Distance of total CD8α+ YFP− T cells (blue triangles) and GzmB YFP+ effector T cells (purple circles) to the lymphatics at the indicated time points. The horizontal lines indicate the mean; ***P < 0.0001; for the procedure, see Fig. S3. (C) Higher magnification showing the localization of GzmB YFP+ cells in close proximity to the indicated lymphatic sinuses. (Scale bar: 100 μm.) B-cell follicles and T-cell zones were delineated using B220 and CD8α staining, respectively. Shown are representative confocal micrographs of three different experiments with at least three mice per time point.
Fig. S4.
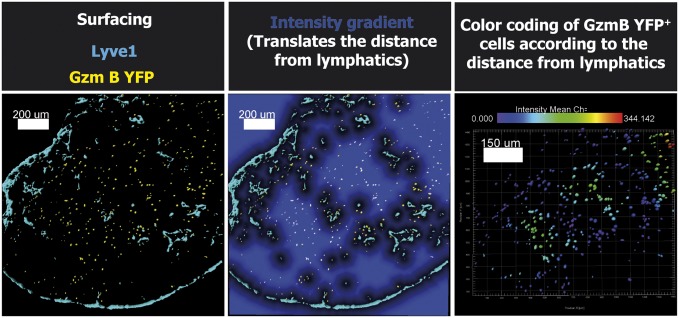
Method used to measure the distance of effector T cells in respect of lymphatics. After infection of GzmBERT2/ROSAEYFP (Gzm B YFP) mice, the dLN were harvested, and images were acquired on the confocal microscope. Images of a typical Imaris analysis are shown. The first step is the application of a surface rendering (Left) for each stain (Lyve1 in blue and GzmB YFP in yellow). The second step is the use of the distance transformation function from the XT module for the Lyve1 structure (Center). This last function creates an intensity gradient that directly translates the distance from the Lyve1 staining (the intensity is increasing with the distance). Finally, GzmB YFP surfaces are color coded according to the intensity of the gradient (Right). The bar shown in the Right panel indicates the color for each distance (blue for cells contacting the Lyve1 structure to red at 344 μm). (Scale bars as indicated.)
Fig. S5.
After a localized viral infection, endogenous antigen-specific CD8 T cells localize to the periphery of the dLN in the medullary and cortical/interfollicular lymphatic sinuses as they exit the LN. (A) Experimental scheme: Mice were infected in the footpad and subsequently treated twice orally with 1 mg of tamoxifen starting at day 3 p.i. (B) dLN were harvested, and thick sections (400 μm) were stained for N-Kb-tetramer in situ at 6 d p.i. Confocal images of N-specific T cells (red) in close proximity to medullary (Left), cortical (Center), and interfollicular (Right) sinuses. (Scale bars: 100 μm.) (C) Close-up of a cortical area showing N-tet+ effector CD8 T cells (red) in direct contact with Lyve1 (green) expressing lymphatics (Movie S1). (Scale bars: 10 μm.) B-cell follicles and T-cell zones were delineated using the B220 and CD8α staining, respectively (not shown). The data shown are representative of three different experiments with at least three mice per time point.
Intravital Microscopy of Effector CD8 T-Cell Egress.
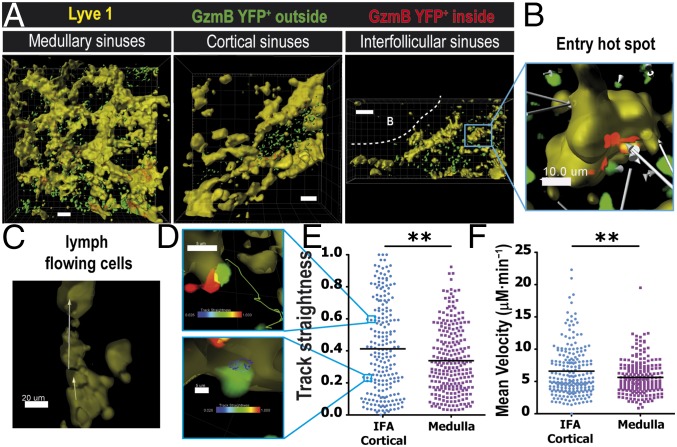
Our static imaging data revealed that effector T cells seem to use both the cortical ridge and medullary sinuses to exit the dLN. Furthermore, at day 6 p.i., the number of effector CD8 T cells located in the medullary sinuses was considerably higher than those located in the cortical/interfollicular sinuses. Therefore, next, we determined whether the effector CD8 T-cell motility and egress kinetics were different depending on the lymphatic sinus used to exit the dLN. Intravital 2P microscopy was used to directly visualize the egress of effector CD8 T cells after infection. VSV-infected gzmBERT2/ROSAEYFP mice were treated with tamoxifen at day 3 p.i., and the dLN was imaged at day 6 p.i. To stain for the lymphatic sinuses, we injected a fluorescently conjugated anti-Lyve1 antibody into the footpad 12 h before in vivo imaging (11). To observe the distribution of GzmB YFP cells along the complex network of lymphatic sinuses, we acquired large Z stacks of 50–100 μm and performed 3D reconstruction of the Lyve1 region (Fig. 2A, yellow) and color-coded lymphocytes based on their localization outside (Fig. 2A, green) versus inside (Fig. 2A, red) the lymphatic structures. Using this method we directly assessed T-cell interactions with the lymphatics and determined their behavior outside the sinuses (Fig. 2 A and B). Once T cells entered the lumen of the cortical sinus, they rapidly and unidirectionally moved along the lymph flow (Fig. 2C and Movie S2). Intravital microscopy of the dynamics of effector T-cell entry into the sinuses and the subsequent egress from the LN after infection revealed that effector CD8 T cells interacted closely and entered into the cortical/interfollicular sinuses (Fig. 2D and Movie S2). Effector CD8 T cells were observed to first probe the lymphatic endothelial cells of the sinus and then entered the lymphatic circulation (Movie S2). Notably, similarly to naive T cells (11), we detected entry “hot spots” along the lymphatic networks where several effector T cells entered in the same area in a span of 30 min (Fig. 2B and Movie S2, circles).
Fig. 2.
Dynamics of endogenous effector CD8 T-cell egress. (A) GzmBERT2/ROSAEYFP (GzmB YFP) mice were infected in the foot pad with VSV, followed by tamoxifen treatment as before (days 3 and 4 p.i.). (A) Snapshots of 2P imaging showing surface rendering of lymphatic sinuses (Lyve1; yellow) and GzmB YFP+ cells inside (red) versus outside (green) the lymphatic sinuses. Shown are 3D reconstruction projections of several z stacks showing the medullary sinuses (Left; 114 µm depth), cortical sinuses (Center; 165 µm depth), and interfollicular sinuses (Right; 65 µm depth). (Scale bars: 50 μm.) (B) Close-up depicting an entry hot spot of endogenous effector T cells going in the same direction toward the lymphatic. White arrows illustrate the displacement (Movie S2). (Scale bar: 10 μm.) (C) Unidirectional displacement (white arrows) of GzmB YFP+ T cells flowing inside a cortical sinus (yellow). (D) Two distinct behaviors from (E) the track straightness graph analysis; a straight track (upper image, green track) and a confined track (bottom image, blue track). Tracks are color-coded based on the track straightness indicated by the colored bars. (F) Velocity in μM⋅min−1 from an interfollicular area (IFA)/cortical (blue dots) and a medullary region (purple squares). Results representative of 6 different movies. **P < 0.001.
The dynamics of effector CD8 T cells that were located around the cortical/interfollicular or medullary sinuses in the dLN were significantly distinct (Fig. 2 E and F). Compared with the cortical/interfollicular sinus-associated T cells, effector CD8 T cells that were localized in the medullary region of the dLN exhibited significantly protracted interactions with the Lyve1+ cells, which translated to reduced track straightness and velocity (Fig. 2 E and F and Movie S3). Finally, it was notable that the mean velocity of GzmB YFP CD8 T cells at the border of the sinuses was around 5 μM⋅min−1 (Fig. 2F), which is considerably lower than the typical naive T-cell velocity observed in the cortex (28), suggesting that the probing behavior of effector T cells with the lymphatic endothelial cells considerably affects the motility of T cells. Altered motility of CD8 T cells in the medulla could be due to a variety of reasons, including expression of different chemokines in the medullary region compared with the T zone and increased fluid permeability.
S1PR1 Expression in Hematopoietic Cells Is Required for Regulating Effector T-Cell Egress from the dLN After Infection.
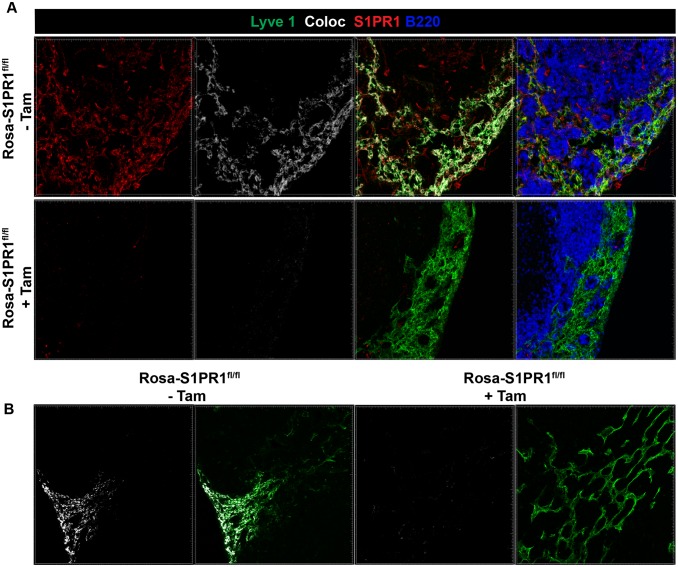
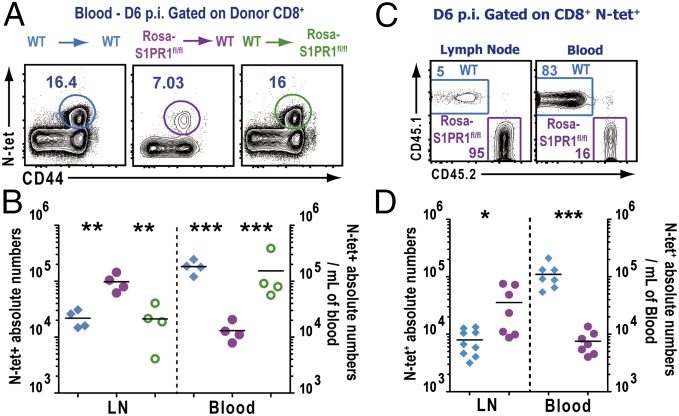
S1PR1 is expressed by numerous cell types, including multiple hematopoietic lineages, as well as high levels of expression on lymphatic and blood endothelial cells, where it regulates cell–cell adherens junctions, and thus vascular permeability, and may influence naive T-cell egress (9, 10). Therefore, in the next set of experiments, we investigated the role of S1PR1 specifically on immune vs. stromal cells in vivo after infection. To this end, we used a mouse model where the S1PR1 deletion can be induced conditionally and temporally. Because S1PR1 signaling is critical for naive T-cell egress from the thymus, temporal excision of the receptor was necessary (17). ROSA-Cre-ERT2 mice were crossed to S1PR1fl/fl mice to obtain ROSA-Cre-ERT2-S1PR1fl/fl mice (from here on referred to as Rosa-S1PR1fl/fl mice). Tamoxifen treatment of these mice results in cre-mediated recombination of the genomic loxP flanked S1PR1 gene, thereby disrupting the S1PR1 protein expression in Lyve1+ lymphatic endothelial cells (Fig. S6). To specifically delete the S1PR1 gene in hematopoietic or stromal cells, we generated several combinations of bone marrow (BM) chimeras (Materials and Methods) (Fig. 3A). The indicated BM chimeras were infected with VSV in the foot pad, followed by treatment with tamoxifen at day 3 p.i. As shown in Fig. 3 B and C, the frequency and absolute numbers of N-tet+ CD8 T cells in the blood in WT→WT chimera were significantly higher than in Rosa-S1PR1fl/fl→WT (S1PR1 is disrupted only in hematopoietic cells) whereas N-tet+ CD8 T-cell frequency and numbers in the WT→Rosa-S1PR1fl/fl (S1PR1 is disrupted only in stromal cells) were similar to the WT→WT chimeric mice. Conversely, when S1PR1 was exclusively disrupted in the hematopoietic cells, the N-tet+ CD8 T cells showed a 10-fold higher accumulation in the dLN compared with WT→WT or WT→Rosa-S1PR1fl/fl chimeric mice (Fig. 3C). Similar results were obtained with mixed bone marrow chimeras (Fig. 3D). In the dLN, the ratio of WT and S1PR1-disrupted (Rosa-S1PR1fl/fl) N-tet+ CD8 T cells was heavily skewed in favor of Rosa-S1PR1fl/fl N-tet+ CD8 T cells; however, in the blood, the ratio was skewed in favor of WT N-tet+ CD8 T cells. These results clearly indicated that intrinsic expression of S1PR1 on immune cells is required for controlling effector T-cell egress from the dLN after infection and that endothelial cell expression of S1PR1 is dispensable for effector T-cell egress after infection.
Fig. S6.
Efficiency of S1PR1 deletion in lymph nodes. Rosa-S1PR1fl/fl mice were either left untreated (−Tam) or treated with tamoxifen (+Tam). Mice were treated with tamoxifen as described in Fig 3. (A) Popliteal lymph nodes were PLP fixed, and frozen sections were stained for Lyve1, S1PR1, or B220. Colocalization (Coloc) of the S1PR1 stain (red) with Lyve1 stain (green) is pseudocolored in white. Imaris software's coloc function was used to build a colocalization channel to determine coexpression of S1PR1 and Lyve1 on lymphatic endothelial vessels. (B) Additional example of colocalization of S1PR1 staining with Lyve1 stain (pseudocolored in white) is shown. Note that tamoxifen treated (+Tam) mice show virtually no S1PR1 staining or colocalization with lymphatic endothelial cells.
Fig. 3.
S1PR1 expression in hematopoietic cells is required for regulating effector T cell egress from the dLN after infection. Indicated BM chimeric mice were infected with VSV in the footpad, and the mice were administered tamoxifen orally starting at day 3 p.i. (A) Frequency of N-tet+ effector T cells in the blood of the indicated BM chimeric group at day 6 p.i. Dot plots represent congenic donor CD45+, CD8α+ gated cells. (B) Absolute numbers of N-tet+ effector T cells in the dLN and per milliliter of blood from the indicated chimeric groups WT→WT (blue), Rosa-S1PR1fl/fl→WT (purple), and WT→Rosa- S1PR1fl/fl (green). (C) Mixed BM chimeric mice were treated with tamoxifen, and, 6 d after VSV footpad infection, mice were killed. The distribution of the WT (blue gate) and S1PR1fl/fl (purple gate) N-tet+ T cell populations was assessed by FACS in the dLN and in blood. Numbers are frequencies of N-tet+ CD8 T cells present in each gate. (D) Absolute numbers of N-tet+ WT and S1PR1fl/fl in the dLN and in the blood (cells per mL) of tamoxifen-treated mixed BM chimeras at day 6 p.i. Data are representative of six independent experiments with at least four mice per group of chimeras. Horizontal lines indicate the mean. ***P < 0.0001 ; **P < 0.001; *P < 0.01.
Effector T Cell-Intrinsic S1PR1 Expression Is Essential for T-Cell Egress from dLN After Infection.
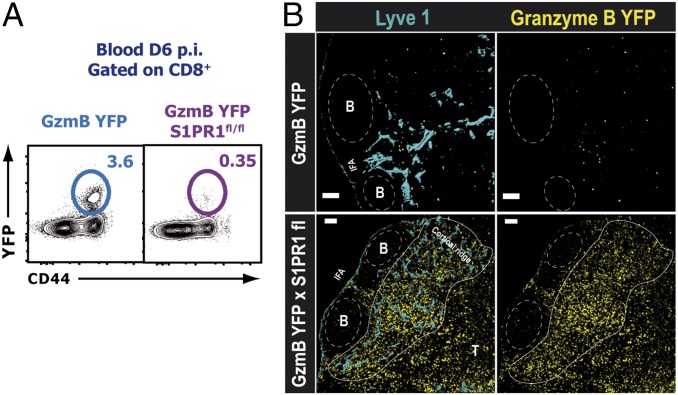
Our studies clearly indicated that S1PR1 expression in the hematopoietic compartment was necessary to regulate effector CD8 T-cell egress from the dLN. However, S1PR1 is expressed on several immune cells, including dendritic cells (DCs), macrophages, naive T cells, and B cells; thus, to investigate the intrinsic role of S1PR1 specifically on endogenous effector T cells, we generated a mouse model by crossing the gzmBERT2/ROSAEYFP (GzmB YFP) mouse with the S1PR1fl/fl mouse to generate a gzmBERT2/ROSAEYFP-S1PR1flx mouse line (GzmB YFPxS1PR1fl/fl). Tamoxifen treatment of GzmB YFPxS1PR1fl/fl mice results in S1PR1 deletion and YFP expression only on those cells that express GzmB. Therefore, using this mouse model, we were able to conditionally and temporally ablate the S1PR1 gene expression only in effector CD8 T cells responding to the infection. Other cells that express GzmB, such as natural killer (NK) cells, may also be affected; however, any role of NK cells after VSV infection will be relevant only during the first 2–3 d after infection, and we administered the tamoxifen only 3 d after viral infection. For the static confocal imaging studies, we costained for CD8 to identify any NK cells, and we observed very few NK cells in the LN beyond 3 d p.i. YFP expression allowed us to image and track endogenous effector CD8 T cells without using adoptive transfer of large numbers of T-cell receptor (TCR) transgenic CD8 T cells. Day 3 infected GzmB YFPxS1PR1fl/fl or gzmBERT2/ROSAEYFP (control) mice were treated with tamoxifen, and mice were killed at 6 d p.i. Flow cytometric analysis showed that YFP+ effector CD8 T cells from tamoxifen-treated mice failed to egress from the dLN after infection; YFP+ effector CD8 T cells were virtually absent in the blood of tamoxifen-treated GzmB YFPxS1PR1fl/fl mice (Fig. 4A). Moreover, confocal imaging analysis of dLN sections showed a dramatic accumulation of YFP+ effector CD8 T cells in the tamoxifen-treated GzmB YFPxS1PR1fl/fl mice adjacent to the lymphatic networks in the periphery of the dLN at 6 d after VSV infection (Fig. 4B). These data clearly show that S1PR1 expression specifically on effector T cells regulates their egress after infection.
Fig. 4.
Effector T cell-intrinsic S1PR1 expression is essential for T-cell egress from dLNs after infection. gzmBERT2/ROSAEYFP or gzmBERT2/ROSAEYFP-S1PR1flx/flx mice were infected as before and treated with tamoxifen starting 3 d p.i. (A) Shown at day 6 p.i. is the frequency of YFP+ CD8 effector T cells in the blood. The dot plots represent CD8 gated cells. (B) Confocal microscopy of dLN showing the distribution and the accumulation of GzmB-YFP+ effector T cells (yellow) with respect to the Lyve1+ (blue) lymphatic vessels. (Scale bars: 100 μm.) The data are representative of two independent experiments with at least three mice per group.
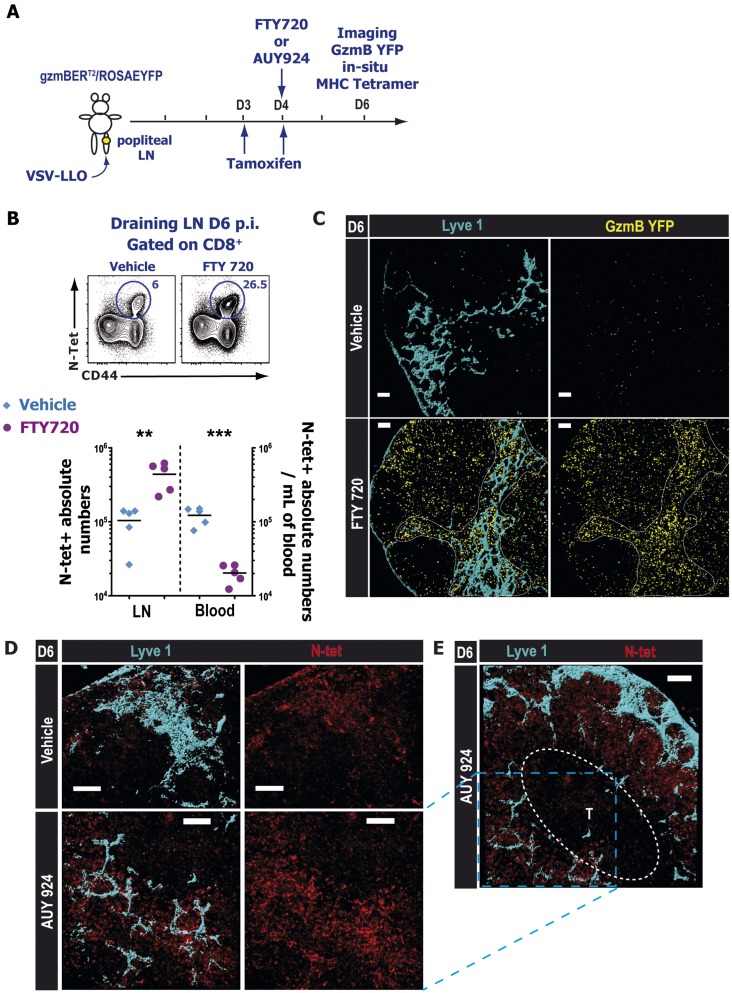
We obtained similar results when we used a pharmacological modulator of S1P receptors, notably FTY720 and AUY954 (Fig. S7 A and B). FTY720 is a broad modulator of four different S1P receptors (S1PR1 and S1PR3 to -5), and AUY954 is an S1PR1-specific agonist. Both drugs are potent receptor agonists that initially activate the S1P receptors they bind to but subsequently induce their internalization and degradation. Similarly, we observed a striking accumulation of GzmB YFP effector CD8 T cells around the lymphatic networks in FTY720- or AUY954-treated animals compared with the vehicle-treated mice (Fig. S7 C–E). In situ tetramer staining (27) showed that N-tet+ CD8 T cells accumulated near the lymphatic networks (Fig. S7 D and E) and that these T cells were virtually absent from the T-cell zones. We observed a similar effect of FTY720 on VSV-specific effector CD4 T cells (Fig. S8). These data indicated that, after infection, S1PR1 is likely required for the entry of effector T cells into the lymphatic vessels, but not for the intranodal migration of activated T cells from the T-cell zones to the periphery of the LN.
Fig. S7.
S1PR1 is required for the egress of endogenous effector CD8 T cells from the dLN after infection. (A) Experimental scheme: VSV-infected (B and C) gzmBERT2/ROSAEYFP mice were treated orally with tamoxifen starting at day 3 p.i. and 24 h later administered with either vehicle or with 1 mg⋅kg−1 FTY720. (D and E) WT mice were infected with VSV and at day 4 treated with vehicle or 3 mg⋅kg−1 AUY954 (S1PR1-specific agonist). (B) At day 6 p.i., dLNs and blood were harvested and analyzed by FACS. (Top) Contour plots showing representative N-tet+ VSV-specific CD8 T cell frequencies in the dLN 6 d p.i. after vehicle (Left) or FTY720 (Right) treatment. Previously gated on total CD8+ cells. (Bottom) Graph depicting N-tet+ CD8+ absolute numbers in the draining LN and in the blood for vehicle (blue diamonds) and FTY720-treated groups (purple circles); horizontal lines represent the mean. ***P < 0.0001 ; **P < 0.004. (C) Distribution of endogenous GzmB YFP+ (yellow) effector CD8 T cells in the dLN and (D and E) antigen-specific N-tet+ (red) effector T cell in situ localization in the dLN of vehicle (Upper) and AUY954 (Lower) treated animals. (E) Zoomed out image showing N-specific effector CD8 T cell peripheral accumulation in the periphery around the lymphatic vessels (Lyve1; blue) after AUY954 treatment. Indicated T-cell zone (T) was defined according to the CD8α staining (not shown). (Scale bars: 100 μm.) Images are representative of three different experiments with at least three mice per treated group.
Fig. S8.
S1PR1 is required for the egress of endogenous effector CD4 T cells from the dLN after infection. (A) Experimental scheme: VSV-infected mice were administered orally with either vehicle or with 1 mg⋅kg−1 FTY720 at day 4 p.i. (B) At day 6 p.i., dLNs were harvested and analyzed by FACS. LLO-tet+ VSV-specific CD4 T cell frequencies in the dLN 6 d p.i. after vehicle (Left) or FTY720 (Right) treatment. Dot plots represent CD4+ gated cells. Images are representatives of three different experiments with at least three mice per treated group.
S1PR1 Regulates the Dynamics of Effector T-Cell Association with Lymphatic Endothelial Cells.
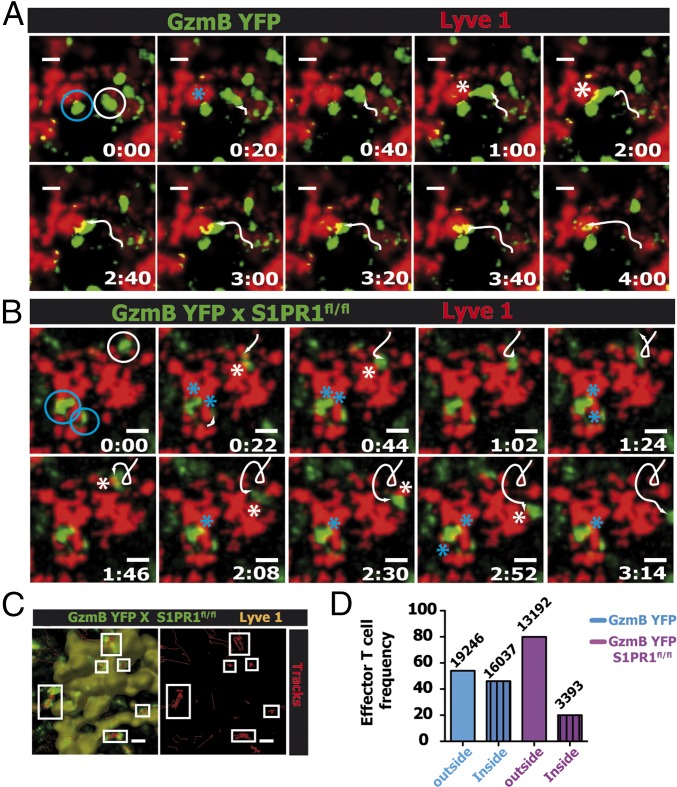
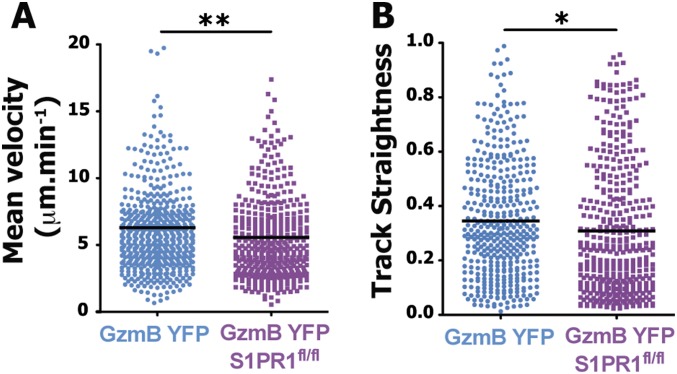
The results thus far clearly demonstrated the critical requirement for S1PR1 expression specifically on effector CD8 T cells in regulating egress from the dLN after a local viral infection. However, to demonstrate the precise mechanism by which S1PR1 regulates effector T-cell egress, we next visualized the dynamics of WT or S1PR1-deficient effector T cells during the egress process at the lymphatic sinuses at 6 d p.i. As shown in Fig. 5 and Movie S4, WT effector CD8 T cells (GzmB YFP) probe the lymphatic endothelium and subsequently enter the sinus and exit the dLN (Movie S4). Interestingly, effector T cells displayed two distinct probing behaviors; several CD8 T cells exhibited brief contacts with the sinuses, followed by a rapid entry into the sinus (Fig. 5A, white circles and white track and Movie S4) whereas others probed the lymphatic endothelium for more than 10 min before entering the sinus (Fig. 5A, blue circle and Movie S4). In contrast, S1PR1-deficient GzmB YFP (GzmB YFPxS1PR1fl/fl) effector CD8 T cells exhibited a probing behavior (similar to WT effector CD8 T cells) but failed to enter the sinuses (Fig. 5B and Movie S5). Because S1PR1-deficient GzmB YFP effector CD8 T cells continued to probe the lymphatic endothelial cells without entering the sinus, the movement tracks of these cells at the sinus border showed a very restricted pattern (Fig. 5C). This motility pattern was further reflected by the lower track straightness and speed of S1PR1-deficient GzmB YFP effector CD8 T cells compared with S1PR1-sufficient GzmB YFP effector CD8 T cells after infection (Fig. S9). The failure of S1PR1-deficient GzmB YFP effector CD8 T cells to enter the lymphatic sinuses is further exemplified by quantifying the number of effector CD8 T cells inside or outside the lymphatic sinuses. Although S1PR1-sufficient T cells were equally distributed between the outside and inside of Lyve1+ lymphatic sinus areas, 80% of the S1PR1-deficient effector CD8 T cells were located outside the sinuses (Fig. 5D). These data suggest that effector CD8 T-cell entry into the lymphatic sinuses is mediated by T cell-intrinsic S1PR1 signaling.
Fig. 5.
S1PR1 regulates the dynamics of effector T-cell association with lymphatic endothelial cells. Infected GzmBERT2/ROSAEYFP (GzmB YFP) or GzmBERT2/ROSAEYFP-S1PR1flx/flx (GzmB YFP S1PR1fl/fl) mice were treated with tamoxifen starting at day 3 p.i. At day 6 p.i., the dLN was surgically exposed for intravital 2P imaging. Time-lapse images of GzmB-YFP+ (green) effector CD8 T cells interacting with Lyve1+ lymphatic endothelial cells in the dLNs of (A) GzmB YFP mice (Movie S4) or (B) GzmB YFP S1PR1fl/fl mice (Movie S5). Two distinct behaviors are depicted: a long lasting probing (blue circle) and short contacts followed by effector T-cell entry into the sinus (A, white circle and white track). S1PR1−/− GzmB+ T cells move toward the sinus, contact, and walk to the opposite direction (B, white circle). White arrowheads indicate tracks whereas asterisks designate T-cell contacts with the lymphatic surface. Elapsed time is presented as min:s. (Scale bars: 10 μm.) (C) Tracks (red) of S1PR1−/− effector CD8 T cells (green) during a 15-min elapsed time showing the repeated probing behavior of six different cells (white boxes) with the Lyve1+ (yellow; rendered surface of the lymphatic sinus) cells. (D) GzmB YFP+ T-cell frequency inside (dashed bar) and outside (plain bar) the Lyve1+ sinuses, assessed by the 3D reconstruction of the Lyve1 fluorescent structures from GzmB YFP (blue) or GzmB YFP S1PR1fl/fl (purple). Results are representative of three independent experiments.
Fig. S9.
S1PR1 expression controls endogenous effector T cell behavior at the lymphatic border. GzmBERT2/ROSAEYFP (GzmB YFP) or GzmBERT2/ROSAEYFP-S1P1flx/flx (GzmB YFP S1PR1fl/fl) mice were infected with VSV in the footpad and treated orally with tamoxifen starting at day 3 p.i. At day 6 p.i., the dLN was surgically exposed for intravital 2P imaging. Twelve hours before imaging, fluorescently conjugated anti-LYVE-1 antibody was injected into the footpad to highlight the lymphatic vessels in the dLN. Movies of effector T cells interacting with the LYVE-1 region were analyzed on the software Imaris. (A) Mean velocity (in μM⋅min−1) and (B) track straightness of effector T cells present in the dLN at the lymphatic border at day 6 p.i. Representative of three independent movies. Dots indicate individual cells from the indicated mice. **P < 0.003; *P < 0.02.
Discussion
The control of a microbial infection by effector T cells is intrinsically linked to their migration. Egress of effector T cells from the dLN is one of the essential steps for the eventual eradication of the pathogen at the infection site. Moreover, retention and egress kinetics of effector T cells in lymphoid organs are directly related to the strength of the TCR–ligand interaction and thus affect T-cell differentiation after infection (29). However, little is known about the mechanisms that control the complex process of effector T-cell egress after infection. Therefore, to determine the mechanisms that regulate this important process, we used mouse models that allowed us to specifically visualize endogenous effector T cells after infection without using adoptive transfer of a large number of TCR transgenic CD8 T cells.
An elegant report recently showed that adoptively transferred naive T cells primarily localize around and enter the cortical lymphatic sinuses and subsequently flow through the medullary sinuses and exit the LN via the efferent lymph (11). Although the possibility of direct migration of naive T cells into the medullary sinus was not formally investigated, it was postulated that, because a majority of the transferred naive T cells were localized near the cortical sinuses relative to a small number found in the medullary region, the cortical sinuses serve as the primary exit point. In contrast, we observed that, between 5 and 6 d after a local viral infection, antigen-specific effector CD8 T cells undergo intranodal positioning to the periphery of the dLN and that a large number of these cells were in fact localized in the medullary region, as well as outside the cortical sinuses. This observation suggests that, after infection, effector T cells directly use both cortical and medullary lymphatic sinuses to exit the dLN. This apparent difference between naive and effector T-cell egress dynamics is likely related to the differential expression of chemokine receptors. Interestingly, the peripheral intranodal migration of effector CD8 T cells was not dependent on S1PR1 because even receptor-deficient effector CD8 T cells migrated to the periphery of the LN. Naive T cells express LN retention signals such as CCR7 (which retains the cells in the T-cell zones) whereas effector CD8 T cells exhibit a chemokine receptor profile that favors cell egress. It is possible that down-regulation of retention signals alone may account for the observed intranodal peripheral migration of effector CD8 T cells beginning at 5 d after infection. However, other factors that may influence this local effector CD8 T-cell migration and localization may include the dramatically altered production of chemokines within lymphoid organs during infection (23).
Previous studies have shown that S1PR1 is required for naive T cell egress from the LN (11, 18). Because naive T cells express LN homing and retention molecules, such as CCR7, the egress kinetics of these T cells are largely a function of the tug of war between retention and egress promoting signals (12). However, after a local viral infection, the conditions in a draining reactive LN are distinct from a steady-state environment. After skin infection with VSV, there is a substantial increase in the production of proinflammatory cytokines and chemokines in the dLN (30), which will dramatically affect the migration patterns of several innate and adaptive immune cells. In addition, viral infection may also alter local levels of the ligand S1P (8, 24, 31), which will significantly influence effector T-cell egress by regulating the function and permeability of endothelial cells. Moreover, once T cells are activated, they down-regulate LN retention signals such as CCR7 and thus are primed to egress from the reactive LN and mobilize into the circulation. Interestingly, a study recently demonstrated that naive and effector T cells respond to CCR7 cues differently (32). When CCL19- and CCL21-expressing fibroblastic reticular cells (FRCs) were conditionally depleted, it resulted in the loss of naive, but not effector, T cells from the LN. The authors (32) suggested that reduced expression of S1PR1, rather than CCR7 signaling, influenced the retention of antigen-specific T cells until they were ready to leave the LN. Therefore, we asked the important question: In light of the infection-induced inflammatory environment, are effector T cells that lack retention signals and are poised to exit the dLN dependent on S1PR1 for egress after a local viral infection? Furthermore, under infection-induced inflammatory conditions, what are the roles of hematopoietic-intrinsic vs. endothelial cell-intrinsic expression of S1PR1 in mediating effector T-cell egress from the dLN? Indeed, our studies using pharmacological or genetic modulation of S1PR1 clearly demonstrated that the primary mechanism that regulates the dynamics of effector T-cell egress kinetics from the dLN after infection is the S1P–S1PR1 axis. Thus, even when LN retention cues are absent, both antigen-specific CD8 and CD4 effector T cells are heavily dependent on S1PR1 for egressing the dLN. Although endothelial cell-specific expression of S1PR1 has been implicated in regulating naive T-cell egress (9, 22), our studies using bone marrow chimeras did not show any significant effect on effector T-cell egress when S1PR1 was disrupted exclusively in the stromal cell compartment. Collectively, our results suggest a dominant and nonreciprocal role for hematopoietic cell expression of S1PR1 in regulating effector T-cell egress.
S1PR1 is expressed on several innate immune cell types, such as dendritic cells, monocytes, and macrophages (8); thus, pharmacological modulation of S1PR1 or genetic ablation of the receptor in all hematopoietic cells still left open the possibility that the regulation of effector T-cell egress by S1PR1 was a result of indirect mechanisms. Moreover, the ubiquitous expression of S1PR1 and the broad influence of the S1P–S1PR1 receptor axis in modulating several biological processes (8) required an in vivo model system to genetically and temporally disrupt S1PR1 gene function specifically in effector CD8 T cells. Thus, we generated a mouse model by crossing gzmBERT2/ROSAEYFP mice (26) with S1PR1fl/fl mice. In the resulting triple transgenic mouse, S1PR1 could be deleted temporally and specifically on GzmB-expressing effector CD8 T cells after infection. Using this inducible mouse model we disrupted the S1PR1 axis by treating the mice with tamoxifen at day 3 after VSV infection, which allowed for normal T-cell priming and demonstrated a T cell-intrinsic requirement for S1PR1 regulation of endogenous effector CD8 T-cell egress from the dLN after infection. Between 5 and 6 d p.i., S1PR1-disrupted effector CD8 T cells migrated to the periphery of the dLN and were unable to enter the sinuses to exit the dLN despite continued probing of Lyve1+ lymphatic endothelial cells. Interestingly, unlike naive S1PR1−/− T cells (11), effector T cells had down-regulated the LN retention molecule CCR7, and, thus, these cells continued to accumulate near the lymphatic sinuses in the periphery of the LN and were unable to migrate back to the T-cell zones in the cortex. Interestingly, we observed that several effector T cells exited at the same area of a lymphatic sinus, favoring the existence of transmigration “portals” (9, 11). In addition, it is notable that that even S1PR1-deficient effector T cells migrated out of the cortex and localized to the periphery of the dLN and continued to exhibit a probing behavior at the lymphatic sinuses, indicating that S1PR1 is required not for these dynamic processes but mainly for the entry of effector T cells across the endothelial lymphatic vessels. These data suggest that S1PR1-mediated effector T-cell egress across the lymphatic endothelial cells represents a more complex process than just sensing of the ligand S1P (3) that is present in high quantities in the lymph. The possible synergistic roles of adhesion molecules and other chemokines in contributing to this complex egress process is not known.
Lymphocyte egress is a complex process and can involve previously unappreciated players. A recent study showed that activation of the β2 adrenergic receptor (β2AR) inhibited egress of naive CD4 and B cells and of effector OTII cells from the LN (33). This retention was mediated by an interaction of β2AR with CCR7 and CXCR4. Nevertheless, our data clearly demonstrated that S1PR1 signaling is the most critical mechanism that regulates effector T-cell egress from the dLN after a local infection and that, even in the absence of retention signals, T cell-intrinsic S1PR1 signaling is the dominant mechanism that regulates transendothelial migration and effector T-cell emigration from the dLN, and, thus, we conclude that S1PR1 is the master regulator of effector T-cell egress after infection.
Materials and Methods
Mice and Tissue Preparation.
All animal work and procedures were carried out in accordance with the approved protocol by the University of Connecticut Health Center’s Animal Care Committee (ACC) and the Health Center’s Institutional Animal Care and Use Committee (IACUC). For further details on all other procedures, including mice strains, flow cytometric analysis, and confocal as well as multiphoton dynamic intravital imaging, see SI Materials and Methods.
Infections.
Mice were infected s.c. into the footpad with 5 × 10⁴ plaque forming units (pfu) of VSV Indiana strain or 5 × 10⁴ pfu of recombinant VSV-GSL (GSL; GFP, SIINFEKL, LLO). Statistical analyses were conducted using an unpaired two-tailed (Student’s) t test, unless specified otherwise (*P < 0.05, **P < 0.01, ***P < 0.001). For more details, see SI Materials and Methods.
SI Materials and Methods
Mice.
WT congenic Ly5.1 (CD45.2+) and Ly5.2 (CD45.1+) C57BL/6 mice 6–8 wk old were purchased from the National Cancer Institute (NCI). S1PR1fl/fl (Edg1fl/fl) mice were generously provided by Richard L. Proia (NIH, Bethesda, MD) and were backcrossed by using speed congenics to the C57BL/6 background. GzmBERT2/ROSAEYFP mice were generously provided by Douglas Fearon (University of Cambridge, Cambridge, UK). Mice were genotyped as described (17, 26). Bone marrow (BM) cells were obtained from femurs and tibias of ROSA-CRE-ERT2-S1PR1flx/flx or littermate controls. Recipients were irradiated with 10 Gy (1,000 rad) from a 137Cs source and injected with 2.5 × 10⁶ BM cells. Chimeras were used after 8 wk of reconstitution. All animal work was carried out in accordance with the approved protocol by the University of Connecticut Health Center’s Animal Care Committee (ACC) and the Health Center’s Institutional Animal Care and Use Committee (IACUC).
Primers.
CreERT2 genotype forward: GCCACCAGCTATCAA
CreERT2 genotype rev: CGTAAATCAATCGATGAGTTGCTT
CreERT2 genotype probe: FAM-TCGCGCCCTGGAAGGGATTTTT-TAMRA
Fap genotype forward: CTGGAAAGGCTCCAGCAAATC
Fap genotype rev: CTTCTCCTTCCCCACAGAGCTT
Fap genotype probe: FAM-CCGCCAGACCAGTGGAACACAATCA-TAMRA
ROSAEYFP forward: AAAGTCGCTCTGAGTTGTTAT
ROSAEYFP rev 1: GCGAAGAGTTTGTCCTCAACC
ROSAEYFP rev 2: GGAGCGGGAGAAATGGATATG
S1P1r loxP1: GAGCGGAGGAAGTTAAAAGTG
S1P1r loxP2: CCTCCTAAGAGATTGCAGCAA
S1P1r loxP3: GATCCTAAGGCAATGTCCTAGAATGGGACA
VSV Infection.
Mice were infected s.c. into the footpad with 5 × 10⁴ plaque forming units (pfu) of VSV Indiana strain or 5 × 10⁴ pfu of recombinant VSV-GSL (GSL; GFP, SIINFEKL, LLO) that was engineered to express the MHC class-II (I-Ab) restricted LLO190–201 peptide.
Cell Isolation and Flow Cytometric Analysis.
Single cell suspension of organs was prepared as previously described (37). Briefly, lymphocytes were released from tissues by digestion with collagenase (Gibco) 100 unit/mL diluted in RPMI and 5% (vol/vol) fetal bovine serum (FBS) (Gibco) and mechanically disrupted using a 70-μm nylon strainer (Falcon) in 0.05 M EDTA solution. For staining at the indicated times after infection, single cell suspensions were suspended in a FACS buffer composed of phosphate-buffered saline (PBS) (Gibco), 5% FBS, and 0.5% sodium azide for 30 min at 4 °C and a combination of the following antibodies: anti-CD8α (53-6.7), -CD44 (1M7), -CXCR3 (CXCR3-173), -Granzyme B (GB11), -CD45.1 (A20), and -CD45.2 (104). The Fc receptors III/II were blocked before staining by using the anti-CD32/16 (clone 93) antibody. All antibodies were purchased from Biolegend, except for the anti-Granzyme B antibody, which was purchased from BD Biosciences. For intracellular granzyme B staining, cells were first permeabilized using BD Cytofix/Cytoperm and stained in BD Perm wash buffer. S1PR1 staining was performed by using anti-mS1PR1 (713412; R&D Systems), which was used at 40 μg/mL in a modified staining buffer containing PBS, 2% FCS, 1 mM EDTA, 0.1% azide and 2% normal mouse serum at 4 °C for 30 min, followed by incubation at the same conditions with biotin-conjugated donkey anti-rat IgG (Jackson ImmunoResearch). A blocking step was then required (because antibodies to surface proteins were generated in rat) with 100 μL of 2% (vol/vol) normal rat serum at 4 °C 30 min as well. Finally, cells were stained with the indicated surface antibodies (see Confocal Microscopy) together with the streptavidin PE (Invitrogen) to reveal S1PR1 staining. For CCR7 staining, we used the CCL19-Ig fusion protein, followed by a secondary goat anti-human Ig (H+L) Alexa-Fluor 488 (Invitrogen). The H-2Kb tetramer containing the VSV nucleoprotein (VSV-N)-derived peptide RGYVYQGL was generated in our laboratory as previously described (34). Lymphocytes were incubated with the VSV-N-tetramer, anti-CD8α, and Fc block together for 1 h at room temperature in FACS buffer. Events were acquired on LSR II (BD Biosciences). Data were analyzed by FlowJo software (Tree Star). The LLO peptide:I-Ab tetramer was generated in the laboratory using the protocol previously described (35). The cell suspensions were incubated with the appropriate MHCII-tetramer for 1 h in RPMI 5% FBS at 37 °C.
Confocal Microscopy.
The lymph nodes from gzmBERT2/ROSAEYFP mice were prepared for staining. Briefly, organs were fixed overnight in PLP buffer containing 0.05 M phosphate buffer, 0.1 M l-lysine, pH 7.4, 2 mg/mL NaIO4, and 10 mg/mL paraformaldehyde. After washing with phosphate buffer, tissues were dehydrated in 30% sucrose in phosphate buffer. Finally, lymph nodes were snap-frozen in OCT compound (Tissue-Tek) and stored at −80 °C. Then, 20-μm sections were cut and stained using a combination of antibodies: polyclonal rabbit anti-Mouse S1PR1 (H60; Santa Cruz Biotechnology), Pacific Orange conjugated anti-B220 (RA3-6B2; Invitrogen, ThermoFisher Scientific), pacific blue conjugated anti-CD8α (53-6.7; Biolegend), Alexa Fluor 660 conjugated anti-Lyve1 (ALY7; eBioscience), PE conjugated anti-CD31 (390; Biolegend), and Alexa Fluor 488 conjugated polyclonal rabbit anti-GFP (Life Technologies) for 1 h at 4 °C. To detect the S1PR1 protein, Alexa Fluor 546 conjugated goat anti-rabbit (Invitrogen, ThermoFisher Scientific) secondary antibody was used. Images were acquired on a Zeiss LSM 780 FCS/NLO (Carl Zeiss) using a 10× water immersion or a 20× objective lens. Images were analyzed using Imaris 3D software (Bitplane, Inc.).
In Situ Tetramer Staining.
Tetramer staining was carried out as previously described (27). The lymph node was first embedded in 1.5% agarose (Fisher) and cut into 400-μm sections using a vibratome. The sections were then stained for 12 h at 4 °C in the dark with the appropriate tetramer, Pacific Blue conjugated anti-CD8α (53-6.7; Biolegend) and Fc-block anti-CD32/16 (clone 93; Biolegend) in ice cold PBS containing 2% FBS, 2% normal goat serum (Vector laboratories). Lymph node sections were then fixed for 2 h at 4 °C in 2% PFA, followed by another 12-h incubation with a custom made polyclonal rabbit anti-APC antibody (ProSci Inc.). Finally, the sections were stained with Alexa 546-conjugated goat anti-rabbit, Pacific Orange conjugated anti-B220 (RA3-6B2; Invitrogen), Alexa Fluor 488 conjugated anti-Lyve1 (ALY7, eBioscience), and PE conjugated anti-CD31 (390, Biolegend) for 6 h at 4 °C. Lymph node sections were washed four times (15 min each) in cold PBS at 4 °C between each step. Images were acquired and analyzed as described above.
Tamoxifen, FTY720, and AUY954 Treatment.
Mice received 2.5 mg daily of tamoxifen (Sigma-Aldrich) in 10% EtoH (Sigma-Aldrich) 90% corn oil (Sigma-Aldrich) by gavage at the indicated time points (usually starting at day 3 p.i.). The AUY954 was kindly provided by Volker Brinkmann (Novartis, Basel) and the FTY720 by Tim Hla (Cornell University, Ithaca, NY). For FTY720, mice were treated once at day 4 p.i. with 1 mg/kg body weight or with the vehicle 2% cyclodextrin (Sigma-Aldrich) by oral gavage. For AUY954 treatment, mice received 3 mg/kg by oral gavage.
Intravital 2P Imaging.
Popliteal lymph nodes were prepared and exposed as previously described (36). Lymphatics were visualized by using anti-Lyve1 (223322; R&D Systems) that was conjugated with Qdot655 using a SiteClick Qdot 655 Antibody Labeling Kit (Life Technologies). Then, 10 μg of the anti-Lyve1 antibody was injected into the footpad 12 h before imaging. A MaiTai Ti:sapphire laser (Newport/Spectra-Physics) was tuned to 920 nm for excitation of the YFP and the Qdot 655. Stacks of 10 optical sections (512 × 512 pixels) of 4 μm each were acquired on an Ultima IV multiphoton microscope (Prairie Technologies) every 20 s to provide imaging volumes of 40 μm in depth. Emitted light and second harmonic signals were captured by three band-pass filters, 460/50 (second harmonic), 525/50 (YFP), 595/50, and 660/40 (Qdot655) and collected with nondescanned detectors. Imaging data were analyzed using Imaris 3D software (Bitplane, Inc.). We used Adobe Premiere Pro CS6 for the final montage.
Image Analysis.
Surfacing and tracking were performed on Imaris 3D software (Bitplane, Inc.) with the XT module. For the calculation of the distance between effector T cells, we first performed an isosurfacing of lymphatics and created a gradient of intensity using the “distance transformation” function of the XT module. As a consequence, the intensity was increasing proportionally with the distance from the Lyve1+ structure. We then graphed the mean intensity of the newly created channel corresponding to the distance from the lymphatic surface.
Supplementary Material
Acknowledgments
We thank Quynh-Mai Pham for assistance in performing experiments and Dr. Evan Jellison in the UConn Health Flow Cytometry Facility. We thank Dr. Tim Hla for critically reading the paper and Dr. Shobha Thangada for her assistance with the study. This work was supported by NIH Grants AI076457 (to B.S.S.), AI097052 (to T.R.M.), AI007387 (to T.T.M.), and AI097375 (to K.M.K.).
Footnotes
The authors declare no conflict of interest.
This article is a PNAS Direct Submission.
This article contains supporting information online at www.pnas.org/lookup/suppl/doi:10.1073/pnas.1516485113/-/DCSupplemental.
References
- 1.Germain RN, Robey EA, Cahalan MD. A decade of imaging cellular motility and interaction dynamics in the immune system. Science. 2012;336(6089):1676–1681. doi: 10.1126/science.1221063. [DOI] [PMC free article] [PubMed] [Google Scholar]
- 2.Benechet AP, Menon M, Khanna KM. Visualizing T cell migration in-situ. Front Immunol. 2014;5:363. doi: 10.3389/fimmu.2014.00363. [DOI] [PMC free article] [PubMed] [Google Scholar]
- 3.Cyster JG, Schwab SR. Sphingosine-1-phosphate and lymphocyte egress from lymphoid organs. Annu Rev Immunol. 2012;30:69–94. doi: 10.1146/annurev-immunol-020711-075011. [DOI] [PubMed] [Google Scholar]
- 4.Reichardt P, et al. A role for LFA-1 in delaying T-lymphocyte egress from lymph nodes. EMBO J. 2013;32(6):829–843. doi: 10.1038/emboj.2013.33. [DOI] [PMC free article] [PubMed] [Google Scholar]
- 5.Worbs T, Mempel TR, Bölter J, von Andrian UH, Förster R. CCR7 ligands stimulate the intranodal motility of T lymphocytes in vivo. J Exp Med. 2007;204(3):489–495. doi: 10.1084/jem.20061706. [DOI] [PMC free article] [PubMed] [Google Scholar]
- 6.Asperti-Boursin F, Real E, Bismuth G, Trautmann A, Donnadieu E. CCR7 ligands control basal T cell motility within lymph node slices in a phosphoinositide 3-kinase-independent manner. J Exp Med. 2007;204(5):1167–1179. doi: 10.1084/jem.20062079. [DOI] [PMC free article] [PubMed] [Google Scholar]
- 7.Chae SS, Proia RL, Hla T. Constitutive expression of the S1P1 receptor in adult tissues. Prostaglandins Other Lipid Mediat. 2004;73(1-2):141–150. doi: 10.1016/j.prostaglandins.2004.01.006. [DOI] [PubMed] [Google Scholar]
- 8.Kunkel GT, Maceyka M, Milstien S, Spiegel S. Targeting the sphingosine-1-phosphate axis in cancer, inflammation and beyond. Nat Rev Drug Discov. 2013;12(9):688–702. doi: 10.1038/nrd4099. [DOI] [PMC free article] [PubMed] [Google Scholar]
- 9.Wei SH, et al. Sphingosine 1-phosphate type 1 receptor agonism inhibits transendothelial migration of medullary T cells to lymphatic sinuses. Nat Immunol. 2005;6(12):1228–1235. doi: 10.1038/ni1269. [DOI] [PubMed] [Google Scholar]
- 10.Rosen H, Sanna MG, Cahalan SM, Gonzalez-Cabrera PJ. Tipping the gatekeeper: S1P regulation of endothelial barrier function. Trends Immunol. 2007;28(3):102–107. doi: 10.1016/j.it.2007.01.007. [DOI] [PubMed] [Google Scholar]
- 11.Grigorova IL, et al. Cortical sinus probing, S1P1-dependent entry and flow-based capture of egressing T cells. Nat Immunol. 2009;10(1):58–65. doi: 10.1038/ni.1682. [DOI] [PMC free article] [PubMed] [Google Scholar]
- 12.Pham TH, Okada T, Matloubian M, Lo CG, Cyster JG. S1P1 receptor signaling overrides retention mediated by G alpha i-coupled receptors to promote T cell egress. Immunity. 2008;28(1):122–133. doi: 10.1016/j.immuni.2007.11.017. [DOI] [PMC free article] [PubMed] [Google Scholar]
- 13.Zhi L, et al. FTY720 blocks egress of T cells in part by abrogation of their adhesion on the lymph node sinus. J Immunol. 2011;187(5):2244–2251. doi: 10.4049/jimmunol.1100670. [DOI] [PMC free article] [PubMed] [Google Scholar]
- 14.Thangada S, et al. Cell-surface residence of sphingosine 1-phosphate receptor 1 on lymphocytes determines lymphocyte egress kinetics. J Exp Med. 2010;207(7):1475–1483. doi: 10.1084/jem.20091343. [DOI] [PMC free article] [PubMed] [Google Scholar]
- 15.Mandala S, et al. Alteration of lymphocyte trafficking by sphingosine-1-phosphate receptor agonists. Science. 2002;296(5566):346–349. doi: 10.1126/science.1070238. [DOI] [PubMed] [Google Scholar]
- 16.Pinschewer DD, et al. FTY720 immunosuppression impairs effector T cell peripheral homing without affecting induction, expansion, and memory. J Immunol. 2000;164(11):5761–5770. doi: 10.4049/jimmunol.164.11.5761. [DOI] [PubMed] [Google Scholar]
- 17.Allende ML, Dreier JL, Mandala S, Proia RL. Expression of the sphingosine 1-phosphate receptor, S1P1, on T-cells controls thymic emigration. J Biol Chem. 2004;279(15):15396–15401. doi: 10.1074/jbc.M314291200. [DOI] [PubMed] [Google Scholar]
- 18.Matloubian M, et al. Lymphocyte egress from thymus and peripheral lymphoid organs is dependent on S1P receptor 1. Nature. 2004;427(6972):355–360. doi: 10.1038/nature02284. [DOI] [PubMed] [Google Scholar]
- 19.Ledgerwood LG, et al. The sphingosine 1-phosphate receptor 1 causes tissue retention by inhibiting the entry of peripheral tissue T lymphocytes into afferent lymphatics. Nat Immunol. 2008;9(1):42–53. doi: 10.1038/ni1534. [DOI] [PubMed] [Google Scholar]
- 20.Roviezzo F, et al. Sphingosine-1-phosphate modulates vascular permeability and cell recruitment in acute inflammation in vivo. J Pharmacol Exp Ther. 2011;337(3):830–837. doi: 10.1124/jpet.111.179168. [DOI] [PubMed] [Google Scholar]
- 21.Alfonso C, McHeyzer-Williams MG, Rosen H. CD69 down-modulation and inhibition of thymic egress by short- and long-term selective chemical agonism of sphingosine 1-phosphate receptors. Eur J Immunol. 2006;36(1):149–159. doi: 10.1002/eji.200535127. [DOI] [PubMed] [Google Scholar]
- 22.Sanna MG, et al. Enhancement of capillary leakage and restoration of lymphocyte egress by a chiral S1P1 antagonist in vivo. Nat Chem Biol. 2006;2(8):434–441. doi: 10.1038/nchembio804. [DOI] [PubMed] [Google Scholar]
- 23.Mueller SN, et al. Regulation of homeostatic chemokine expression and cell trafficking during immune responses. Science. 2007;317(5838):670–674. doi: 10.1126/science.1144830. [DOI] [PubMed] [Google Scholar]
- 24.Olivera A, Allende ML, Proia RL. Shaping the landscape: Metabolic regulation of S1P gradients. Biochim Biophys Acta. 2013;1831(1):193–202. doi: 10.1016/j.bbalip.2012.06.007. [DOI] [PMC free article] [PubMed] [Google Scholar]
- 25.Shiow LR, et al. CD69 acts downstream of interferon-alpha/beta to inhibit S1P1 and lymphocyte egress from lymphoid organs. Nature. 2006;440(7083):540–544. doi: 10.1038/nature04606. [DOI] [PubMed] [Google Scholar]
- 26.Bannard O, Kraman M, Fearon DT. Secondary replicative function of CD8+ T cells that had developed an effector phenotype. Science. 2009;323(5913):505–509. doi: 10.1126/science.1166831. [DOI] [PMC free article] [PubMed] [Google Scholar]
- 27.Khanna KM, McNamara JT, Lefrançois L. In situ imaging of the endogenous CD8 T cell response to infection. Science. 2007;318(5847):116–120. doi: 10.1126/science.1146291. [DOI] [PMC free article] [PubMed] [Google Scholar]
- 28.Miller MJ, Wei SH, Parker I, Cahalan MD. Two-photon imaging of lymphocyte motility and antigen response in intact lymph node. Science. 2002;296(5574):1869–1873. doi: 10.1126/science.1070051. [DOI] [PubMed] [Google Scholar]
- 29.Zehn D, Lee SY, Bevan MJ. Complete but curtailed T-cell response to very low-affinity antigen. Nature. 2009;458(7235):211–214. doi: 10.1038/nature07657. [DOI] [PMC free article] [PubMed] [Google Scholar]
- 30.Iannacone M, et al. Subcapsular sinus macrophages prevent CNS invasion on peripheral infection with a neurotropic virus. Nature. 2010;465(7301):1079–1083. doi: 10.1038/nature09118. [DOI] [PMC free article] [PubMed] [Google Scholar]
- 31.Ito K, et al. Integrin α9 on lymphatic endothelial cells regulates lymphocyte egress. Proc Natl Acad Sci USA. 2014;111(8):3080–3085. doi: 10.1073/pnas.1311022111. [DOI] [PMC free article] [PubMed] [Google Scholar]
- 32.Denton AE, Roberts EW, Linterman MA, Fearon DT. Fibroblastic reticular cells of the lymph node are required for retention of resting but not activated CD8+ T cells. Proc Natl Acad Sci USA. 2014;111(33):12139–12144. doi: 10.1073/pnas.1412910111. [DOI] [PMC free article] [PubMed] [Google Scholar]
- 33.Nakai A, Hayano Y, Furuta F, Noda M, Suzuki K. Control of lymphocyte egress from lymph nodes through β2-adrenergic receptors. J Exp Med. 2014;211(13):2583–2598. doi: 10.1084/jem.20141132. [DOI] [PMC free article] [PubMed] [Google Scholar]
- 34.Altman JD, et al. Phenotypic analysis of antigen-specific T lymphocytes. Science. 1996;274(5284):94–96. doi: 10.1126/science.274.5284.94. [DOI] [PubMed] [Google Scholar]
- 35.Moon JJ, et al. Naive CD4(+) T cell frequency varies for different epitopes and predicts repertoire diversity and response magnitude. Immunity. 2007;27(2):203–213. doi: 10.1016/j.immuni.2007.07.007. [DOI] [PMC free article] [PubMed] [Google Scholar]
- 36.Murooka TT, Mempel TR. Multiphoton intravital microscopy to study lymphocyte motility in lymph nodes. Methods Mol Biol. 2012;757:247–257. doi: 10.1007/978-1-61779-166-6_16. [DOI] [PubMed] [Google Scholar]
Associated Data
This section collects any data citations, data availability statements, or supplementary materials included in this article.


