Significance
The El Niño–Southern Oscillation is the dominant mode of climate variability in the tropical Pacific, with pronounced global teleconnections. Predicting El Niño and understanding its progression still present a challenge to climate scientists. At the beginning of 2014, many in the scientific community anticipated that a strong El Niño could potentially develop by year end, but the observed warm event barely reached the El Niño threshold. Here, we analyze satellite-based data and numerical simulations to show that an intense easterly wind burst that occurred in June of 2014 was the key dynamical factor that stalled the El Niño development. We discuss our findings in the context of limited El Niño predictability and explore links between intraseasonal wind bursts and decadal climate change.
Keywords: 2014 El Niño, westerly wind bursts, easterly wind bursts, El Niño predictability, decadal climate change
Abstract
Intraseasonal wind bursts in the tropical Pacific are believed to affect the evolution and diversity of El Niño events. In particular, the occurrence of two strong westerly wind bursts (WWBs) in early 2014 apparently pushed the ocean–atmosphere system toward a moderate to strong El Niño—potentially an extreme event according to some climate models. However, the event’s progression quickly stalled, and the warming remained very weak throughout the year. Here, we find that the occurrence of an unusually strong basin-wide easterly wind burst (EWB) in June was a key factor that impeded the El Niño development. It was shortly after this EWB that all major Niño indices fell rapidly to near-normal values; a modest growth resumed only later in the year. The easterly burst and the weakness of subsequent WWBs resulted in the persistence of two separate warming centers in the central and eastern equatorial Pacific, suppressing the positive Bjerknes feedback critical for El Niño. Experiments with a climate model with superimposed wind bursts support these conclusions, pointing to inherent limits in El Niño predictability. Furthermore, we show that the spatial structure of the easterly burst matches that of the observed decadal trend in wind stress in the tropical Pacific, suggesting potential links between intraseasonal wind bursts and decadal climate variations.
El Niño, the warm phase of the El Niño–Southern Oscillation (ENSO), is characterized by anomalously warm water appearing in the central and eastern equatorial Pacific every 2–7 years, driven by tropical ocean–atmosphere interactions with far-reaching global impacts (recent reviews are in refs. 1–3). These interactions and El Niño development involve several important feedbacks, including the positive Bjerknes feedback [zonal wind relaxation leads to the reduction of the zonal sea surface temperature (SST) gradient and further wind relaxation] (4). Since the year 2000, there has been a shift in the observed properties of El Niño, including its magnitude, frequency, and spatial structure of temperature anomalies (5, 6). For example, El Niño events occurred more frequently than during the previous two decades, but all were weak, and none reached the extreme magnitude of the 1982 and 1997 events. Concurrently, the rise of global mean surface temperature has slowed down with the so-called global warming hiatus (7–9). The stalled development of the 2014 El Niño presents a showcase to explore the relevant connection and mechanisms of these changes.
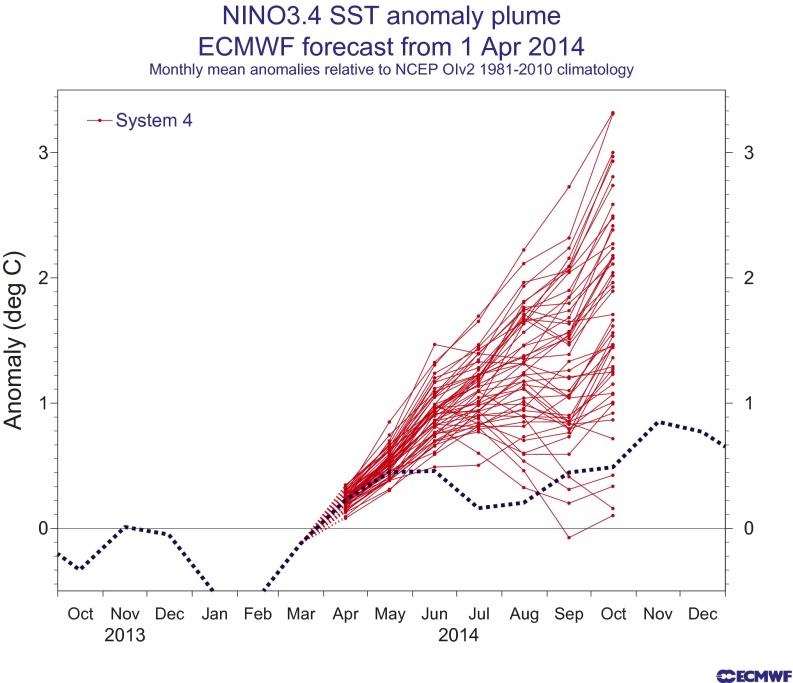
At the beginning of 2014, many in the scientific community anticipated that a moderate to strong El Niño could develop by the end of the year (10–14) (Fig. S1). In March, the National Oceanic and Atmospheric Administration (NOAA) Climate Prediction Center announced an “El Niño watch” based on predictions made by dynamical and statistical models (12), attracting attention of the general public. Admittedly, these predictions encompassed large uncertainties because of the stochastic nature of the tropical climate system (15–17). In May, the National Aeronautics and Space Administration (NASA) suggested that 2014 could potentially rival the strongest on-record event of 1997/19998 (Fig. 1B), while acknowledging the large existing uncertainty (14); their projection was supported by satellite observations of strong Kelvin waves evident in sea surface height (SSH) (Fig. 2C). The spread of spring forecast plumes from some climate models, for example that of the European Centre for Medium-Range Weather Forecasts (ECMWF), included the possibility of a failed El Niño (Fig. S1) but only as a low-probability outcome involving unusual instances of weather noise. The observed development fell near the limit of these forecast possibilities after June and July, and eventually, the 2014 warm event barely qualified as El Niño (Fig. 1A).
Fig. S1.
The El Niño spring forecasts of the Niño3.4 index from the European Centre for Medium-Range Weather Forecasts (ECMWF). Red lines show 50 ensemble members of the forecast plume initiated in March of 2014; the black dotted line indicates the observed Niño3.4 index. The observed development fell outside the forecast plume in June and July and remained beyond the typical forecast spread after that. Adapted from ref. 13.
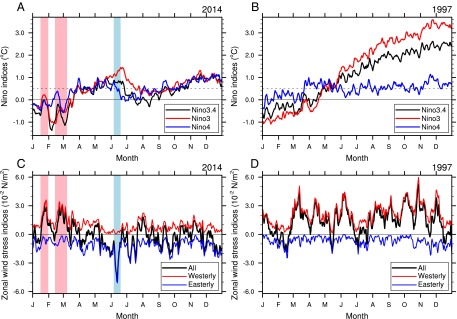
Fig. 1.
El Niño development in (A and C) 2014 and (B and D) 1997. (A and B) Evolution of the Niño3, Niño4, and Niño3.4 indices; the first two indices describe SST anomalies (in degrees Celsius) in the eastern and central equatorial Pacific, respectively, whereas the last index covers the region in between. (C and D) Variation in the zonal wind stress indices. These indices are obtained by averaging wind stress anomalies (in 10−2 newtons per meter2) in the equatorial Pacific zonally and between 5 °S and 5 °N and then selecting negative (blue; easterly anomalies), positive (red; westerly anomalies), or full values (black) (Materials and Methods). The spatial averaging is intended to take into account both the magnitude and the fetch of the wind bursts. During 2014, two early year WWBs were followed by an exceptional EWB in June (highlighted by pink and blue, respectively). This easterly burst apparently led to a rapid decrease of the Niño indices (A). In contrast, the 1997 El Niño exhibited persistent westerly wind activity throughout the year. The graphs start on January 1.
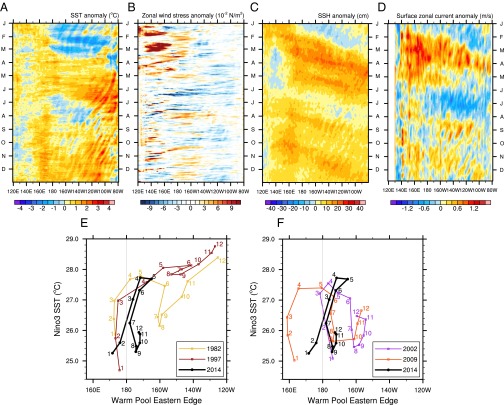
Fig. 2.
Spatiotemporal evolution of the 2014 El Niño. (A–D) Hovmöller diagrams for anomalies in (A) SST, (B) zonal wind stress, (C) SSH, and (D) surface zonal currents in the equatorial Pacific. Time goes downward. The SSH and surface velocity plots highlight the eastward propagating downwelling Kelvin waves, especially pronounced early in the year, and a strong upwelling Kelvin wave midyear. (E and F) El Niño development in 2014 (black line) compared with several historical (E) EP and (F) CP events. The diagrams show the position of the Warm Pool Eastern Edge (degrees of longitude) vs. the Niño3 SST (degrees Celsius) for different months of the year. The Warm Pool Eastern Edge is defined as the position of the 29 °C isotherm at the equator. Numbers indicate monthly averages (1, January; 2, February, etc.). The light vertical line marks the Dateline. In 2014, both the warm pool displacement and Niño3 SST anomalies were exceptionally large during May (month 5), were similar to those in 1997 and 1982 (the strongest events of the 20th century), and then, rapidly decreased by August (month 8).
The question then arises as to which dynamic factors controlled the temporal and spatial development in the tropical Pacific in 2014. This warm event began with a rapid growth, such that, in early June, all major Niño indices (Materials and Methods) along the equator were nearly identical to those during the same time of 1997 (Fig. 1 A and B). A substantial warming also developed along the Peruvian coast (Fig. 3A). Then, the event’s progression slowed down or even reversed. By year end, the equatorial warming barely exceeded 1 °C, but the SST anomaly stretched uncharacteristically across the entire equatorial Pacific almost uniformly (Figs. 1A and 2A). Accordingly, the major goal of this study is to investigate this unusual development, identify the main factors that impeded this event, and explore its broad implications.
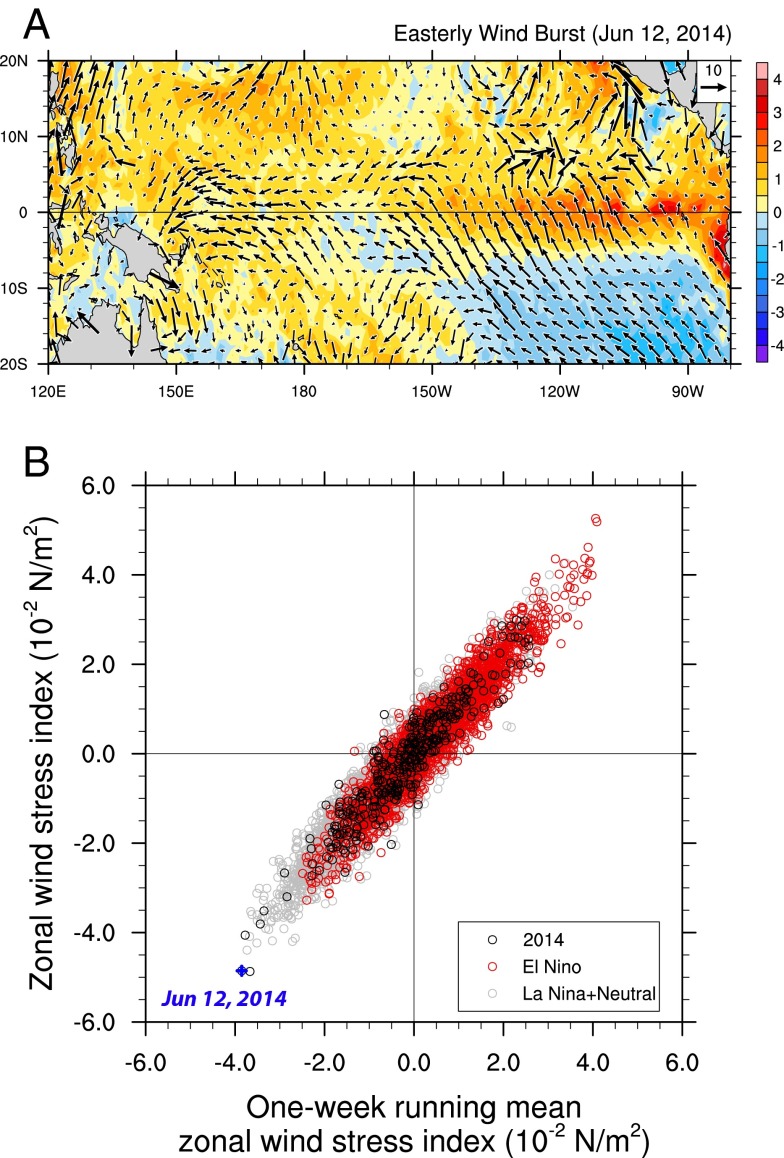
Fig. 3.
The June of 2014 EWB in satellite-based data. (A) The spatial structure of anomalies in surface winds (vectors; in meters per second) and SST (colors; in degrees Celsius) on June 12, 2014, when the burst was strongest. (B) Daily vs. weekly mean values of the zonal wind stress index (10−2 newtons per meter2) for the period 1988–2014. The blue cross marks the peak value of the June of 2014 EWB. The wind stress index is defined as anomalous zonal wind stress averaged in the equatorial Pacific zonally and between 5 °S and 5 °N (Materials and Methods). Black circles are for the year 2014, red circles are for all El Niño years before 2014, and gray circles are for all other years (La Niña or neutral). Note that the June of 2014 EWB appears strongest in the satellite record for not only daily data but also, weekly averaged values, which confirms that the observations are robust.
Evidence from Satellite-Based Observations
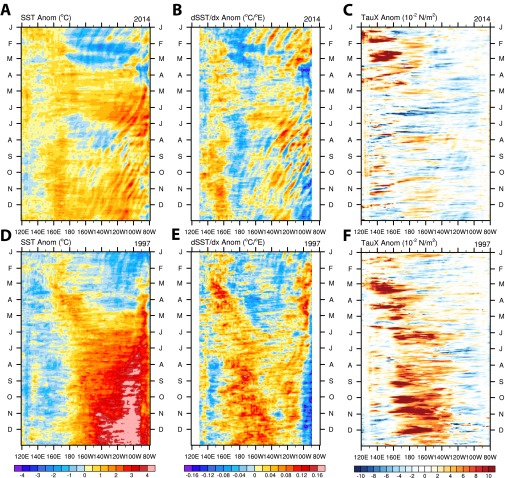
Each El Niño event tends to be unique, albeit a part of a broad ENSO continuum (18–20). Stochastic atmospheric forcing, including equatorial westerly wind bursts (WWBs) that often occur in the vicinity of the Dateline (21–23) and easterly wind bursts (EWBs) (24, 25), contributes to El Niño diversity. Observational and modeling studies suggest that WWBs modulate the strength and timing of El Niño events (18, 20, 26–28)—for instance, the extreme El Niño of 1997 began after several strong WWBs (Fig. 1D and Fig. S2F).
Fig. S2.
Evolution of El Niño in 2014 and 1997. The Hovmöller diagrams show anomalies in (A and D) SST, (B and E) zonal SST derivative (dSST/dx; degrees Celsius per degree of longitude), and (C and F) zonal wind stress along the equatorial Pacific during the years (A–C) 2014 and (D–F) 1997. Anomalies are computed with respect to the climatology (Materials and Methods). A and C are reproduced from Fig. 2 A and B for completeness. In B and E, the SST anomaly field is spatially smoothed (with a running mean of 20° of longitude) before the zonal derivative is taken. Anom, anomalies; TauX, zonal wind stress.
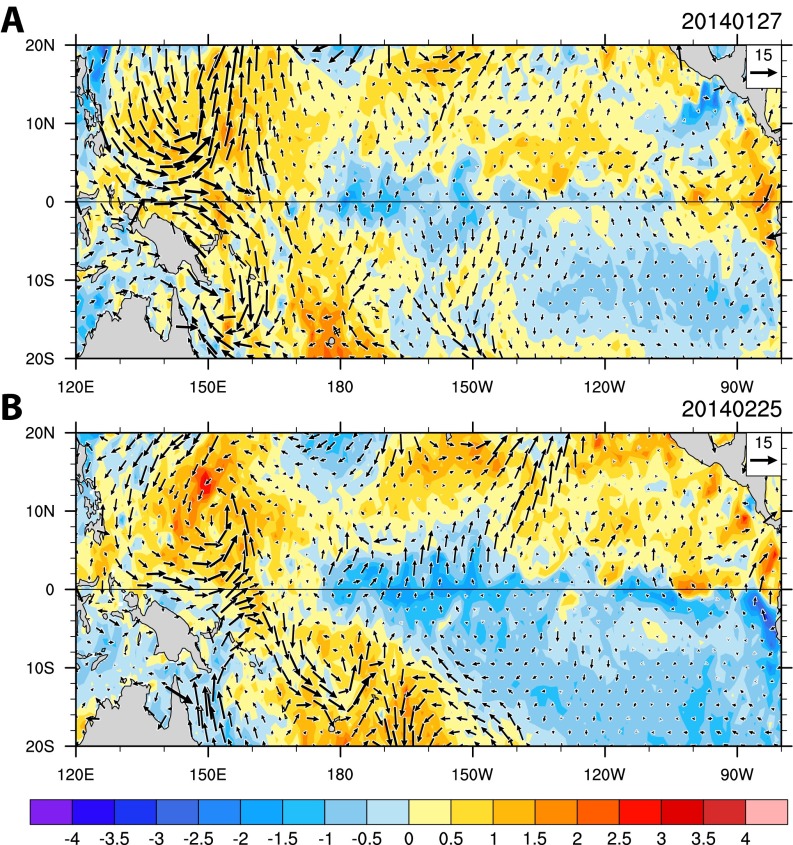
Conditions during the first several months of 2014 closely resembled those of the year 1997. The equatorial Pacific was heat-recharged (29), as indicated by positive SSH anomalies in the western Pacific (Fig. 2C). In January and February, two strong WWBs (Fig. 2B), induced by paired tropical cyclones that formed on opposite sides of the equator (Fig. S3), excited downwelling Kelvin waves (Fig. 2 C and D) similar or even stronger than those in 1997. Such twin tropical cyclones, often associated with convectively coupled equatorial waves (30), can form for arbitrary tropical conditions but occur more frequently during El Niño growth, resulting in state-dependent WWBs.
Fig. S3.
WWBs in the tropical Pacific in January and February of 2014. The spatial structures of anomalies in surface wind field (vectors; meters per second) and SST (colors; degrees Celsius) are shown at the peaks of the two WWBs that occurred in the early months of 2014, on (A) January 27 and (B) February 25. In both cases, twin cyclones were formed on opposite sides of the equator, generating strong anomalous westerly winds at the equator.
Subsequently, weaker WWBs followed, exciting subsequent downwelling Kelvin waves in late April. This entire development could have been the beginning of a strong El Niño, but why did it never happen? Surprisingly, westerly wind activity after the first two WWBs was very weak, and then, an easterly burst occurred in June, generating an exceptionally strong negative wind stress anomaly (Fig. 1C).
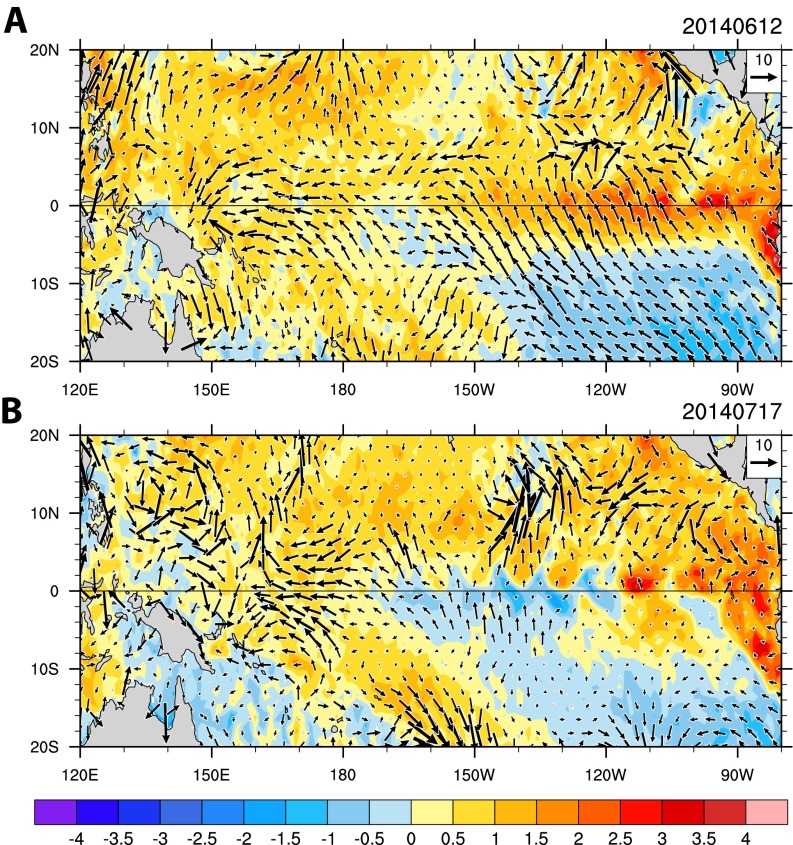
The strengthening of easterly winds along the equator started in early May and reached maximum amplitudes by mid-June (Figs. 1C and 2B). This EWB, stretching across the entire equatorial Pacific, was part of a large-scale atmospheric system that developed south of the equator (Fig. 3A). It occurred along with the strengthening of the south Pacific subtropical high, with wind and pressure anomalies extending to 20 °S or even farther south, and was accompanied by a cold SST anomaly in the subtropical southeast Pacific (Fig. 3A and Fig. S4A). This EWB was about 40% more intense than the next strongest EWBs at the El Niño developing stage in terms of both daily and weekly values (the latter accounts for the burst duration) when zonally averaged over the equatorial Pacific (Fig. 3B). Moreover, the burst induced the strongest zonal mean easterly wind stress anomaly during the entire period of satellite observations (1988–2014), including all La Niña and neutral years (Fig. 3B). Note that, here, we use satellite-based wind data (Materials and Methods), shown to be superior over atmospheric reanalysis products (31).
Fig. S4.
EWBs in June and July of 2014. The spatial structure of anomalies in surface winds (vectors; meters per second) and SST (colors; degrees Celsius) but at the peak of the two EWBs that occurred midyear in 2014, on (A) June 12 and (B) July 17. The first EWB is part of a large-scale atmosphere extending to the subtropical south Pacific. The second weaker burst is likely the response of the coupled system to a warm SST anomaly in the west. A is reproduced from Fig. 3A for completeness. Note the different scales for wind speed in Fig. S3 and this figure.
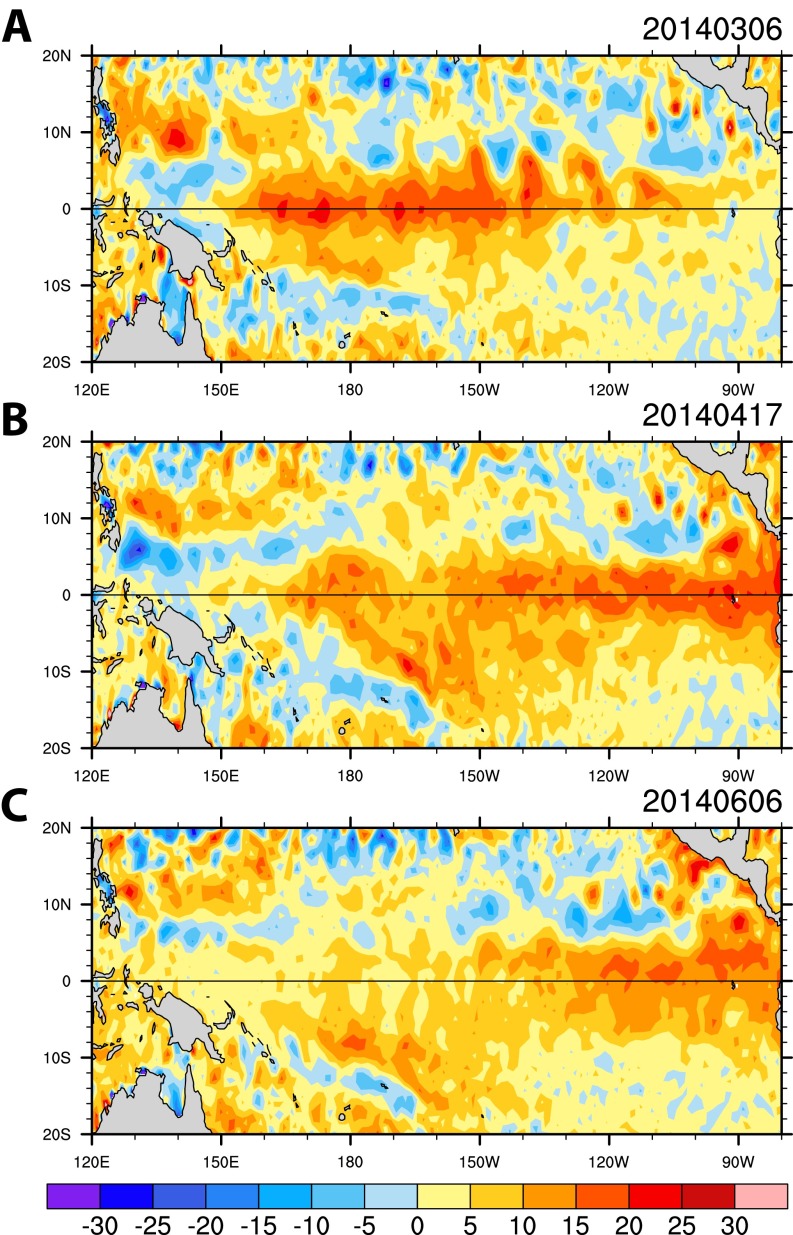
Because of the exceptional strength and long fetch of the June easterly burst, its dynamical impacts were felt almost immediately. Whereas the western boundary reflection of previously generated Rossby waves was minimal as seen from the spatiotemporal evolution of SSH (Fig. S5), the EWB excited a strong upwelling Kelvin wave (Fig. 2 C and D) that largely offset the initial warming in the eastern equatorial Pacific (Fig. 2A). Simultaneously, the burst pushed back the warm pool (Fig. 2 E and F) and cooled local SSTs (Fig. 2A). These impacts were apparently strong enough to stall the El Niño progression. Between June and July, the Niño indices dropped rapidly to almost normal values (Fig. 1A and Fig. S6). Another weaker EWB, now confined to the western Pacific, developed in July, possibly as an atmospheric response to the anomalous cooling in the central equatorial Pacific (Fig. 2B and Fig. S4B).
Fig. S5.
Propagation of Kelvin and Rossby waves induced by wind stress anomalies in the winter of 2014. Snapshots of SSH anomalies (in centimeters) are shown. Positive and negative SSH anomalies indicate thermocline deepening or shoaling, respectively. (A) March 6: positive equatorial and negative off-equatorial SSH anomalies corresponding to downwelling Kevin and upwelling Rossby waves are generated by westerly wind anomalies. (B) April 17: the Kelvin wave has propagated eastward, whereas the Rossby wave has propagated westward. (C) June 6: the Kelvin wave propagated farther east, whereas the Rossby wave has nearly vanished because of energy leakage through the western boundary. There is little evidence that the reflection of these Rossby waves contributed to the midsummer upwelling Kelvin wave seen in Fig. 2.
Fig. S6.
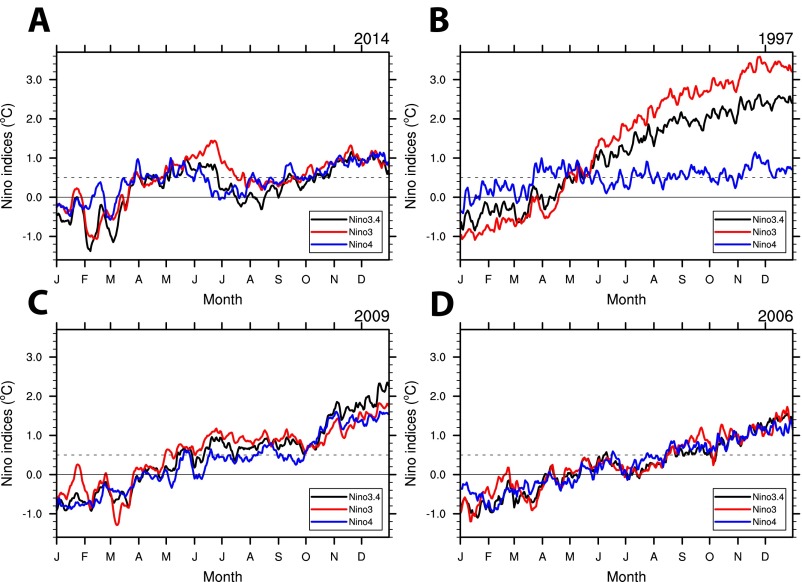
Evolution of different El Niño events as described by the Niño3, Niño4, and Niño3.4 indices in (A) 2014, (B) 1997, (C) 2009, and (D) 2006. The 1997/1998 and 2009/2010 events give examples of an extreme EP El Niño and a weak CP El Niño, respectively. The very weak 2014/2015 warm event is characterized by a small but relatively uniform warming, stretching in November and December across the entire equatorial Pacific basin and reminiscent of but slightly weaker than that in 2006. Note the rapid drop in all three indices in the middle of 2014 that can be explained by the June EWB. A and B are reproduced from Fig. 1 A and B.
The incidence of the EWBs was paralleled by a near absence of WWBs (32), which are critical for El Niño development. Why was the WWB activity so weak in the second half of the year? As in 1997, the early WWBs of 2014 induced an eastern Pacific warming (around 120 °W) by downwelling Kelvin waves and a central Pacific warming (around the Dateline) by the eastward displacement of the warm pool (Fig. 2A). However, in 2014, because of the midyear easterly wind anomaly, these two warming centers did not converge and remained separate. Consequently, an anomalous negative zonal SST gradient persisted along the equator around the Dateline (Fig. S2B), which strengthened the total east–west equatorial temperature gradient. This lasting two-maxima SST pattern effectively weakened the Bjerknes feedback in the second half of the year, weakening or inhibiting state-dependent WWBs (Figs. 1C and 2B).
Comparing the 2014 event with historic Central Pacific (CP) and Eastern Pacific (EP) El Niño (18, 19) (SI Text) highlights the dramatic turn that occurred midyear. Through May, the event’s progression followed or outpaced the previous extreme EP events—the Niño3 SST increased very rapidly, whereas the warm pool expanded eastward by about 30° (Fig. 2E). However, between June and August, there occurred an abrupt retreat, with the warm pool pushed back by 10° and the Niño3 SST all but reduced to its January values, which would be unusual, even for CP events (Fig. 2F). After September, the warm pool expanded slightly eastward, and the SST increased a little, leading to a weak warm event at year end.
Previously, it has been suggested that an EWB may have suppressed the development of El Niño in 2012 (24). However, in 2014, there were stronger early indications of an upcoming El Niño event favored by a combination of strong WWBs and a recharged ocean state reminiscent of the early 1997, whereas the midyear easterly burst was significantly more intense than that discussed in ref. 24.
Climate Model Simulations
To further show that the intense EWB in June was a key factor stalling the 2014 El Niño, we perform numerical experiments with superimposed WWBs and EWBs using a state-of-the-art climate model (Community Earth System Model; CESM). After selecting an ocean initial state most closely resembling the early 2014, we conduct three sets of ensemble experiments (Materials and Methods): the first set is control (named CTL), the second set has the two observed WWBs superimposed (named WWB), and the third set has the observed June EWB added as well (named E+WWB) (Fig. S7).
Fig. S7.
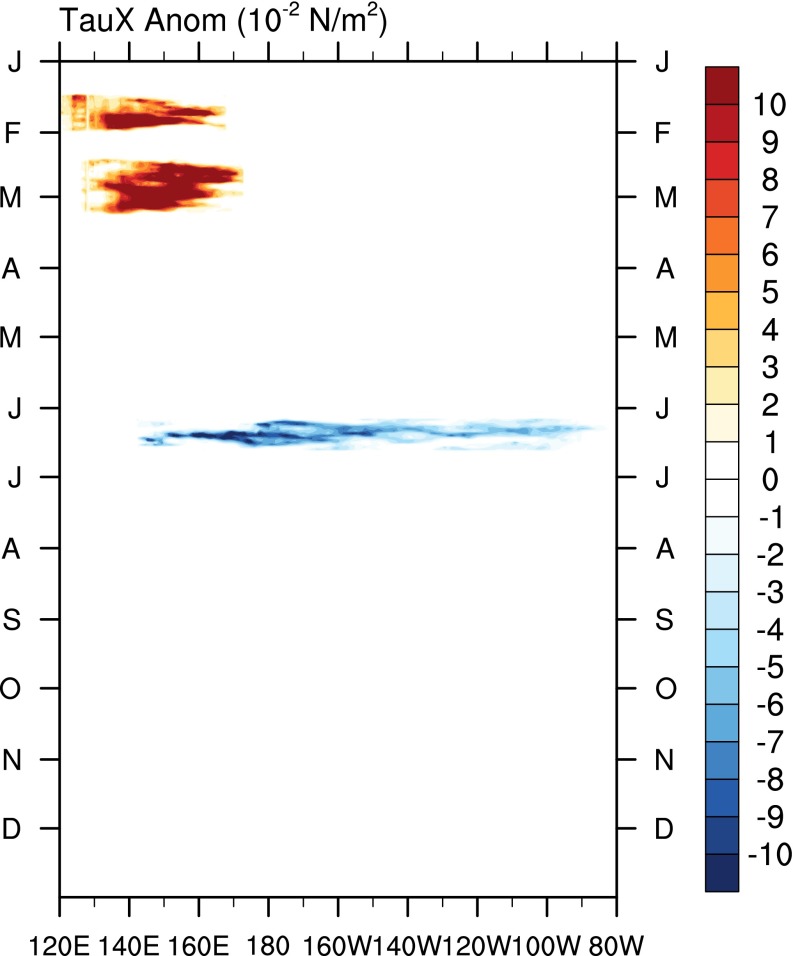
The spatiotemporal structure of the wind bursts superimposed in the coupled model. The Hovmöller diagram shows zonal wind stress anomalies along the equator of the two winter WWBs and the midyear EWB added to the simulations. Experiments in the WWB set use only the westerly bursts, whereas experiments in the E+WWB set use all three. Anom, anomalies; TauX, zonal wind stress.
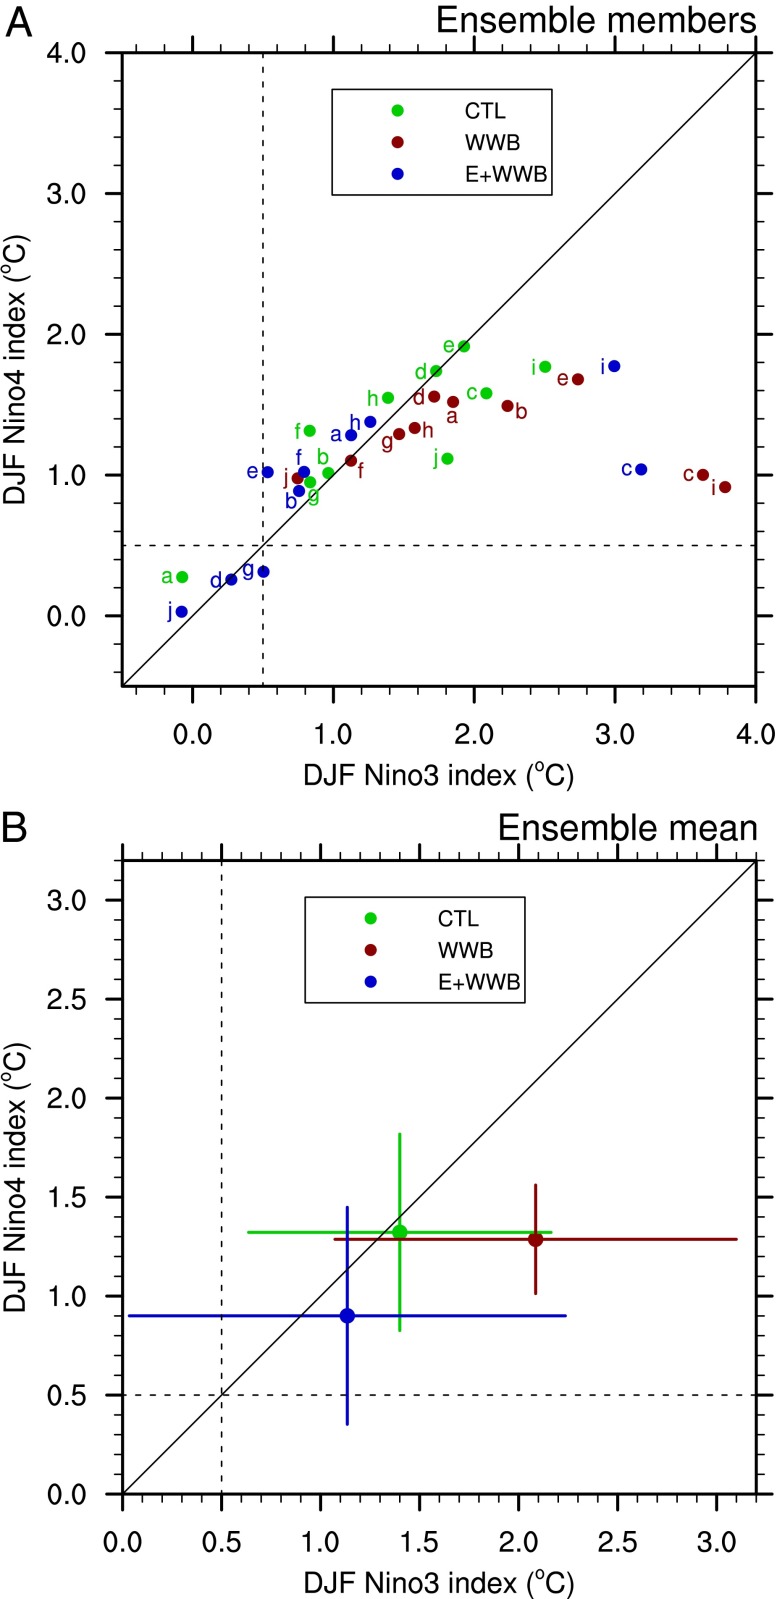
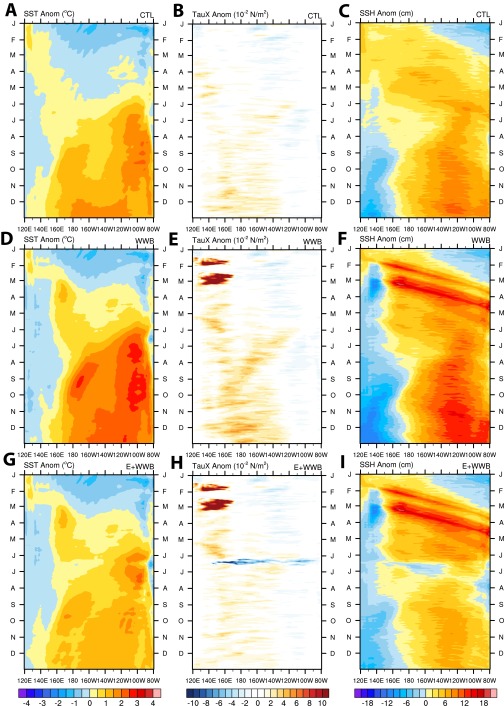
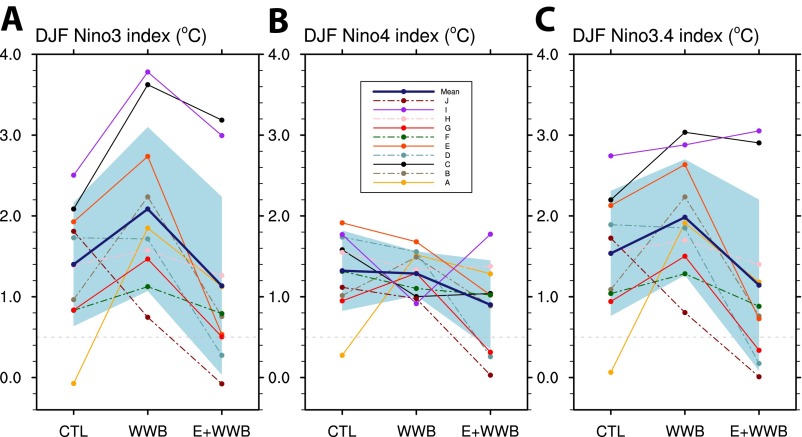
First, we examine the ensemble mean results (Fig. 4B and Fig. S8). The CTL set develops into a moderate El Niño, with the wintertime Niño3 and Niño4 indices reaching about 1.4 °C (Fig. 4B). Superimposing the two WWBs has a clear effect on the system, leading to a stronger El Niño, with the Niño3 index of 2.1 °C (Fig. 4B). However, adding the June EWB next, lasting just a few weeks, is sufficient to dampen the El Niño development; henceforth, the Niño3 and Niño4 indices reach only 1.1 °C in December, lower than in the CTL set (Fig. 4B).
Fig. 4.
Results of numerical experiments with superimposed wind bursts. The diagrams show the Niño4 index vs. the Niño3 index at the peak of warm events in different experiments for (A) individual ensemble members, and (B) ensemble means with bars indicating 1 SD for CTL (green), the WWB (red), and the E+WWB (blue) sets. Imposing the WWBs generally intensifies El Niño. Note the two extreme events with the Niño3 index above 3.5 °C in the WWB set. Imposing the EWB reduces the El Niño strength in the ensemble mean sense as well as for most of the individual events. Because of the stochastic nature of the system, there is an overlap between different experimental sets. The Niño indices are averaged from December to February (DJF). Dashed lines mark the 0.5 °C threshold.
Fig. S8.
Experimental results for three experimental sets. The Hovmöller diagrams show ensemble mean anomalies of (A, D, and G) SST, (B, E, and H) zonal wind stress, and (C, F, and I) SSH along the equatorial Pacific for (A–C) the CTL set, (D–F) the WWB set, and (G–I) the E+WWB set. In the ensemble mean sense, the two WWBs strengthen the El Niño event, whereas the subsequent EWB suppresses its development, resulting in a weak but relatively uniform warming along the equator that develops by the end of the year, consistent with the observations of the 2014 warm event. Anom, anomalies; TauX, zonal wind stress.
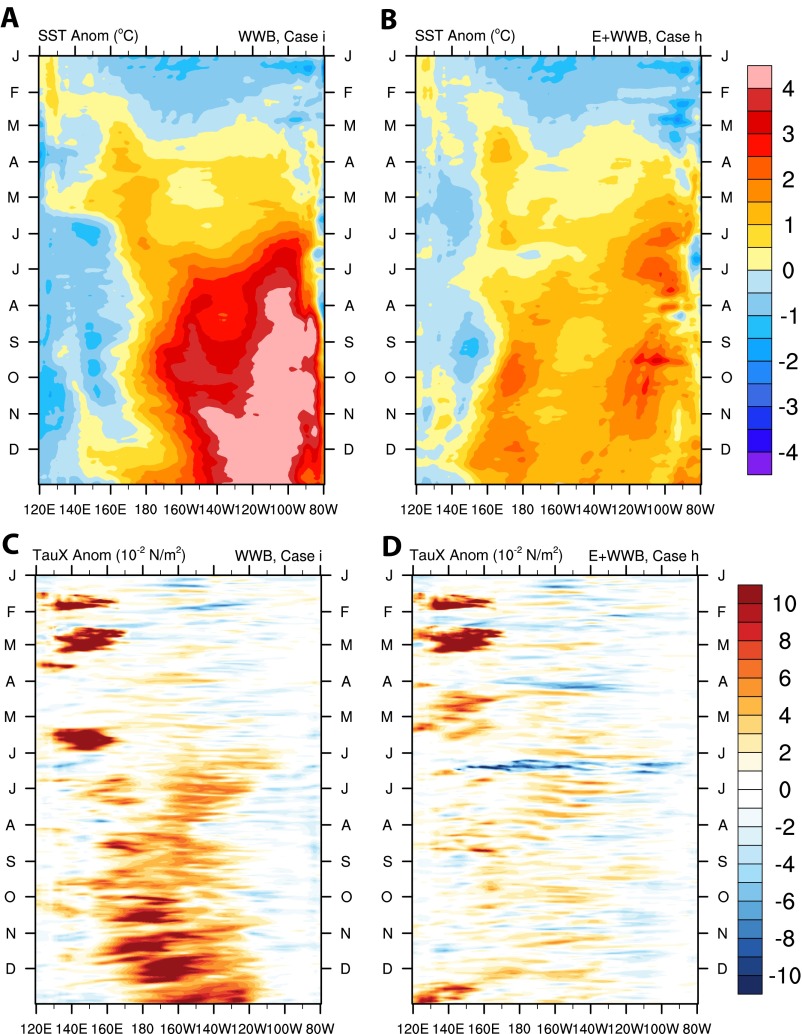
Inspecting individual members of the ensembles provides further insights relevant to the 2014 event (Fig. 4A and Fig. S9). As expected, each experimental set exhibits substantial spread among the ensemble members, characteristic of the stochastic nature of the system and resulting in overlap between the sets. In the CTL experiments, 9 of 10 members develop into El Niño events, but most of them are weak CP or hybrid events (Fig. 4A). In contrast, in the WWB set, all ensemble members develop into moderate to strong EP events, and two become extreme events, with the wintertime Niño3 index exceeding 3.5 °C (Fig. 4A). Thus, the WWBs significantly enhance the probability of an extreme El Niño, while shifting events from the CP to EP type in agreement with recent studies (18, 20). Nevertheless, the superimposed EWB is able to push most of these events back to weak CP or even no warming at all (Fig. 4A). In terms of temporal evolutions and spatial patterns, several cases in the WWB set closely resemble the 1997 El Niño, whereas some in the E+WWB set look similar to the 2014 event (Fig. S10).
Fig. S9.
The effect of the imposed wind bursts on the El Niño amplitude. The plot shows (A) Niño3, (B) Niño4, and (C) Niño3.4 indices averaged from December to February (DJF) at the peak of warm events in different experiments. Thin colored lines show individual ensemble members; thick blue lines show ensemble means, with shading indicating 1 SD. The horizontal dashed line marks +0.5 °C—the value typically used to define El Niño. Note that, typically, El Niño amplitude increases if the two WWBs are imposed but decreases by 1 °C or more when the EWB is added next.
Fig. S10.
Two examples of individual ensemble members from the perturbed sets. The Hovmöller diagrams show anomalies in (A and B) SST and (C and D) zonal wind stress for (A and C) experiment i of the WWB set and (B and D) experiment h of the E+WWB set. These two simulated events resemble the 1997 and 2014 El Niño, respectively (compare with Fig. S2). Anom, anomalies; TauX, zonal wind stress.
To test the robustness of our results, we have conducted a number of sensitivity experiments (SI Text) [for example, selecting different ocean initial states, adding the meridional wind stress component of the June EWB (Figs. 3A and 5A), or adding the second EWB]—these experiments support our conclusion that the superimposed WWBs amplify the El Niño, potentially leading to an extreme event, whereas the EWBs inhibit (partially or entirely) its development.
Fig. 5.
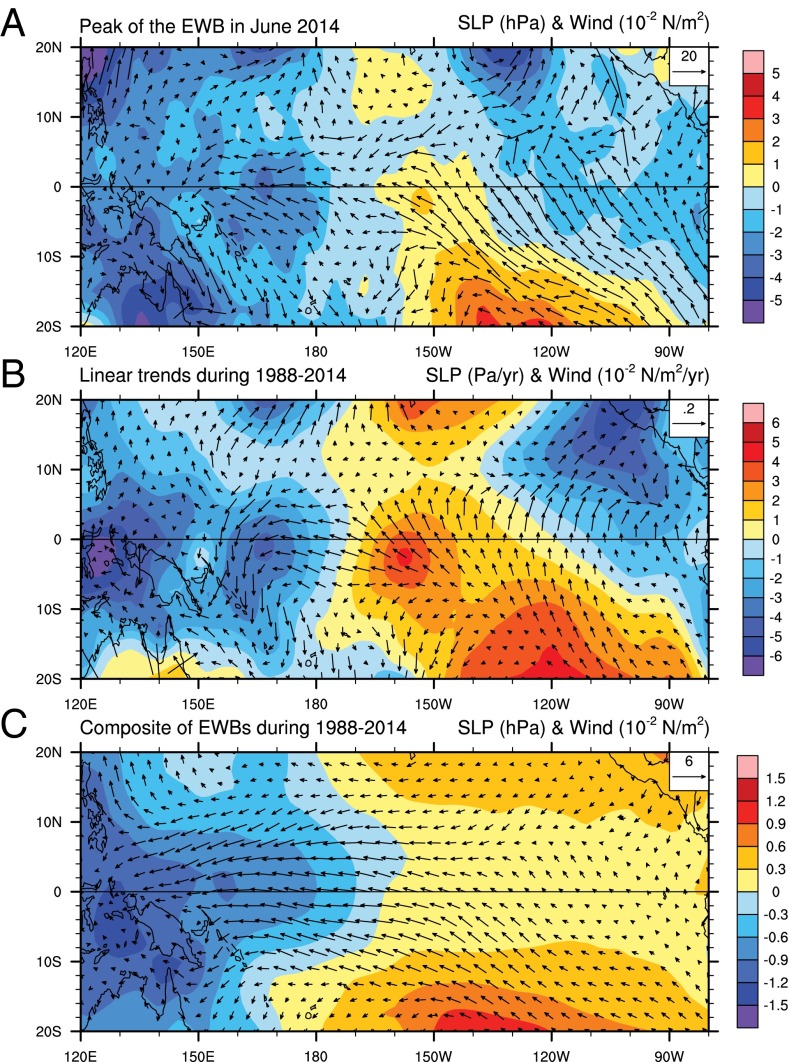
Intraseasonal wind bursts and decadal climate change. Anomalies in wind stress (vectors; 10−2 newtons per meter2 or 10−2 newtons per meter2 per year for trend) and sea level pressure (SLP; colors; hectopascals or pascals per year for trend) showing (A) the June of 2014 EWB, (B) the linear trend during 1988–2014, and (C) a composite of EWBs during the same time interval. The EWB composite is computed using a threshold of −1.25 × 10⁻² N/m2 (SD of the full time series) for the daily zonal wind stress index (Materials and Methods and Fig. 3B). Note the general agreement between the spatial patterns describing the EWBs and the decadal wind stress trend; for example, the spatial correlation of SLP patterns in A and B within 10 °S and 10 °N is above 0.8. Ref. 7 attributed the global warming hiatus to the strengthening of the easterly winds seen in B.
Implications for El Niño Predictability and Links to Decadal Climate Change
Thus, the evolution of the 2014 warm event, different from early expectations, has broad implications for El Niño predictability. Previous research has indicated that WWBs contribute to El Niño diversity (18, 20) and generally limit El Niño predictability (23, 33, 34). Our findings suggest that EWBs, when occurring during the development phase of El Niño, represent another important factor limiting this predictability. A more comprehensive investigation of EWBs will be needed to address all relevant questions, including for example, what causes EWBs during El Niño development, and whether those bursts are state-dependent or simply part of stochastic atmospheric dynamics.
Furthermore, the occurrence of the June of 2014 EWB, the strongest during satellite observations, coincided with the negative phase of the Pacific Decadal Oscillation, with persistently stronger easterly Trade winds (the corresponding increase in ocean heat absorption may have contributed to the global warming hiatus) (7, 8, 35–37). Could such EWBs themselves be part of the decadal wind strengthening? In fact, the spatial patterns associated with the June of 2014 burst and wind stress trends over the tropical Pacific during the past two decades look very similar and not unlike an easterly burst composite for this timeframe (Fig. 5). Thus, our findings point to potential links between short intraseasonal, longer interannual, and much longer decadal timescales, which can lead to decadal changes in El Niño properties. The dynamic mechanisms linking intraseasonal wind bursts and decadal changes in the Walker circulation will be investigated in a follow-up study.
Materials and Methods
Data and Key Variables.
We use satellite-based or “blended” data products to take advantage of their high resolution in both time and space compared with in situ observations. In particular, we use the National Oceanic and Atmospheric Administration (NOAA) National Climatic Data Center (NCDC) sea surface winds, which combine multiple satellite observations for wind speed with reanalysis products [National Centers for Environmental Prediction (NCEP) Reanalysis 2 and ECMWF NWP] for wind direction, and they are available at www.ncdc.noaa.gov/oa/rsad/air-sea/seawinds.html. Using these winds data, we compute surface wind stress based on the bulk formula used in a recent study (38)—the blended wind stress agrees reasonably well with that provided by NOAA NCDC. However, we did not use the NOAA NCDC wind stress directly, because their wind stress data are available only for years before 2011. Overall, the satellite-based winds are shown to be superior over atmospheric reanalysis products (31). The main features of the satellite-based winds, including the winter WWBs and the June EWB, are also seen in in situ observations (e.g., at www.pmel.noaa.gov/tao/) and reanalysis data.
Furthermore, we use the NOAA Optimum Interpolation SST V2 Product (www.esrl.noaa.gov/psd/data) and the AVISO Absolute Dynamic Topography Product for SSH, which was produced by Ssalto/Duacs and distributed by Aviso, with support from CNES (www.aviso.altimetry.fr/en/data/product-information/information-about-mono-and-multi-mission-processing/ssaltoduacs-multimission-altimeter-products.html). The resolution of these datasets is daily in time and 1/4° × 1/4° in space. For Fig. 2 E and F, we use the same SST dataset as mentioned above but with a coarser resolution: monthly in time and 1° × 1° in space. For ocean surface currents, we use the Ocean Surface Current Analyses - Real time (OSCAR) data-assimilated ocean current velocity with a 5-d temporal resolution and 1/3° × 1/3° spatial resolution (www.oscar.noaa.gov/). Sea level pressure is obtained from the NCEP Reanalysis 2 data provided by NOAA, with a daily temporal resolution and a 2.5° × 2.5° spatial resolution (www.esrl.noaa.gov/psd/). For the observations, anomalies are computed with respect to the 11-y climatology (1995–2005) typically used by NOAA when computing surface wind anomalies.
Niño3, Niño4, and Niño3.4 indices are defined as SST anomalies averaged between 5 °S–5 °N and 150 °W–90 °W, 160 °E–150 °W, or 170 °W–120 °W, respectively. For Hovmöller diagrams, all equatorial variables are averaged within the equatorial band 2 °S–2 °N. The Warm Pool Eastern Edge is defined following the work in ref. 39 as the position (in degrees of longitude) of the 29 °C isotherm for the equatorial SST averaged within 2 °S–2 °N.
To assess wind variations, we use a zonal wind stress index obtained by averaging zonal wind stress anomalies over the equatorial Pacific from 120 °E to 80 °W and between 5 °S and 5° N (Fig. 1 C and D). This wind index contains both high-frequency (intraseasonal) and low-frequency (interannual) signals. Furthermore, to distinguish WWBs and EWBs, we compute two similar indices but before taking averages over the same area, select only positive or negative values of wind stress anomalies, respectively.
Model and Experimental Setup.
The coupled general circulation model used in this study is the latest model developed by the National Center for Atmospheric Research (NCAR)–Community Earth System Model (CESM), version 1.0.6, in a high-resolution configuration (1.9 × 2.5 for the atmospheric component and gx1v6 for the oceanic component). This model resolves oceanic Kelvin and Rossby waves critical for the system response to wind bursts. It simulates a realistic ENSO (40) and at times, generates its own intraseasonal wind bursts as part of the model’s stochastic atmospheric dynamics in the tropics. More details about the model and its ENSO simulation can be found in ref. 40 and references therein.
As the first step, to generate the reference state for the experiments, we ran the coupled model starting from its preindustrial equilibrium state for additional 50 y. This time interval was then used to compute the model climatology. Previous studies showed that the impact of WWBs on El Niño development strongly depends on the ocean initial state (18, 20). Consequently, to replicate oceanic conditions of the early 2014, we inspected this reference run and then, selected an ocean initial state that closely resembled January of 2014 (details are in SI Text).
Next, we conduct three sets of experiments titled CTL, WWB, and E+WWB. They start with the same ocean initial state (the one selected from the reference run) but differ in whether we superimpose wind bursts or not. The CTL set has no externally imposed wind bursts. Within the WWB set, we add the two observed westerly bursts that occurred during January and February of 2014. Within the E+WWB set, we further superimpose the easterly burst of June of 2014 in addition to the two early WWBs. The timing, duration, and spatial structure of the bursts are taken from the satellite-based observations (Fig. 2B and Fig. S7). For westerly (easterly) wind bursts, only positive (negative) anomalies of zonal wind stress are used, and they are only within the regions specifically chosen to capture the main signals associated with the bursts. These regions are bounded between 10 °S–10 °N, and 120 °E–168 °E or 126 °E–173 °E for the two WWBs and 142 °E–80 °W for the EWB (Figs. S3 and S4). The durations of three imposed bursts are from January 16 to January 31, from February 13 to March 8, and from June 6 to June 19.
Following recent studies (18, 20), each experimental set has 10 ensemble members, which start with the same initial ocean state on January 1 but an initial atmospheric state shifted by several days (from 0 to 9 d). Each experiment is integrated for 2 years starting from January 1. For the model output, anomalies are defined with respect to the model climatology based on the 50-year reference run.
SI Text
ENSO “Flavors” and the 1997/1998 El Niño.
Each El Niño event is unique in terms of its temporal evolution, spatial patterns, and global impacts, reflecting the diversity of El Niño “flavors” within a broad ENSO continuum. Typically, two main types of El Niño are distinguished: EP El Niño vs. CP El Niño (sometimes referred to as canonical El Niño vs. El Niño Modoki or Cold Tongue El Niño vs. Warm Pool El Niño) (6, 18, 20, 41, 42). The former has the maximum SST anomaly located in the eastern equatorial Pacific, whereas the latter has the maximum SST anomaly located the central equatorial Pacific. The simplest definition of EP events is that the wintertime Niño3 index should exceed Niño4 and remain greater than 0.5 °C, whereas for CP events, the Niño4 index should exceed the Niño3 index (6, 43, 44). Sometimes, the term hybrid or mixed event is used when the Niño3 and Niño4 indices have comparable magnitudes and both exceed 0.5 °C. Recent studies (18, 20, 45, 46) show that intraseasonal wind bursts play an important role in the El Niño diversity.
It is instructive to examine the development of the 1997/1998 El Niño (Fig. S2 D–F), because it bears many similarities with the 2014 warm event at the onset stage (Fig. S2 A–C). At the beginning of 1997, the equatorial Pacific was in a recharged state with a substantial buildup of ocean heat content (26), setting favorable conditions for El Niño development (29). A strong WWB occurred in March (Fig. S2F), exciting downwelling equatorial Kelvin waves (26), propagating eastward, and inducing warming in the eastern equatorial Pacific about 2 months later (Fig. S2D). In addition to this remote effect, the WWB pushed the warm pool eastward, as revealed by the western Pacific warming slowly shifting eastward (Fig. S2D). By June, the two warming centers in the central and eastern Pacific converged (Fig. S2D), thus establishing an SST anomaly with a positive west–east gradient across the whole basin (Fig. S2E). The positive Bjerknes feedback (4) further amplified the warming until the coupled system advanced into an extreme EP El Niño event (Fig. 1 B and D). WWBs that occurred in the central Pacific (Fig. S2F), which excited more downwelling Kelvin waves, were apparently part of the Bjerknes feedback and can be viewed as the atmospheric response to the warming in the central and eastern Pacific—a viewpoint supported by good agreement between the patterns of wind stress and zonal SST derivative anomalies (Fig. S2 E and F). Those subsequent WWBs are typically referred to as state-dependent wind bursts, which play an important role in the development and predictability of El Niño events (47–50).
Selecting the Ocean Initial State for Model Experiments.
Previous studies showed that the impact of WWBs on El Niño development strongly depends on the ocean initial state (18, 20). Consequently, to replicate oceanic conditions of the early 2014, we inspected the model reference run and then, selected an ocean initial state that resembled January of 2014 using three, albeit not necessarily independent criteria. (i) The equatorial ocean heat content is in a heat-recharged state [that is, temperature anomaly averaged over the equatorial basin (5 °S to 5 °N and 120 °E to 70 °W at 0–300 m) should be sufficiently positive]. (ii) The equatorial SSH anomaly is positive in the west but negative in the east, indicating that the heat recharge is localized mainly in the western Pacific. (iii) The equatorial SST anomaly is slightly negative in the central and eastern Pacific regions.
Additional Sensitivity Experiments.
Additional sensitivity experiments were conducted to test the robustness of our model results. In the main experiments, only the zonal component of wind stress anomalies caused by the bursts was imposed. However, one may notice a strong meridional component in surface wind anomalies during the EWB (Fig. 3A and Fig. S4A), which could contribute to the advection of cold water from the subtropical southeast Pacific toward the equator and thus, amplify the SST cooling in the central Pacific (Fig. 2A and Fig. S4B). We conducted an additional set of sensitivity runs, wherein we added this meridional wind anomaly to the imposed EWB, but did not find any significant differences in terms of the simulated El Niño strength, which suggests that, in our experiments, the EWB impacts are dominated by the zonal component of surface wind stress. In another set of the experiments, we imposed the second (July) EWB (Fig. S4B) as well—its effect was to further dampen the El Niño amplitude by a few tens of degrees Celsius.
Finally, we selected another ocean initial state, still resembling the observations of the early 2014 but from a different part of the reference run, and conducted similar experiments by superimposing the same WWBs and EWBs as shown in Fig. S7. The results support our main conclusions (i.e., the superimposed WWBs amplify the El Niño event, whereas the June EWB inhibits the El Niño development, leading to about a 1 °C reduction of the wintertime El Niño amplitude in the ensemble mean sense).
Acknowledgments
We acknowledge computational support from the Yale University Faculty of Arts and Sciences High Performance Computing Facility and the National Science Foundation (NSF) /National Center for Atmospheric Research Yellowstone Supercomputing Center. We also thank two anonymous reviewers for useful suggestions on the first version of the manuscript and Brian Dobbins for his help in setting up the computational environment. This research was supported by NSF Grant AGS-1116885 and NOAA Grant NA14OAR4310277. S.H. acknowledges support from a National Aeronautics and Space Administration Earth and Space Sciences Fellowship.
Footnotes
The authors declare no conflict of interest.
This article is a PNAS Direct Submission.
This article contains supporting information online at www.pnas.org/lookup/suppl/doi:10.1073/pnas.1514182113/-/DCSupplemental.
References
- 1.Guilyardi E, et al. Understanding El Nino in ocean-atmosphere general circulation models progress and challenges. Bull Am Meteorol Soc. 2009;90(3):325–340. [Google Scholar]
- 2.Wang C, Deser C, Yu J-Y, DiNezio P, Clement A. 2014. El Nino-Southern Oscillation (ENSO): A review. Coral Reefs Eastern Pacific (Springer, Berlin), pp. 3–19.
- 3.Latif M, Keenlyside NS. El Nino/Southern Oscillation response to global warming. Proc Natl Acad Sci USA. 2009;106(49):20578–20583. doi: 10.1073/pnas.0710860105. [DOI] [PMC free article] [PubMed] [Google Scholar]
- 4.Bjerknes J. Atmospheric teleconnections from the equatorial pacific. Mon Weather Rev. 1969;97(3):163–172. [Google Scholar]
- 5.McPhaden MJ. A 21st century shift in the relationship between ENSO SST and warm water volume anomalies. Geophys Res Lett. 2012;39(9):L09706. [Google Scholar]
- 6.Yeh SW, et al. El Niño in a changing climate. Nature. 2009;461(7263):511–514. doi: 10.1038/nature08316. [DOI] [PubMed] [Google Scholar]
- 7.England MH, et al. Recent intensification of wind-driven circulation in the Pacific and the ongoing warming hiatus. Nat Clim Chang. 2014;4(3):222–227. [Google Scholar]
- 8.Kosaka Y, Xie SP. Recent global-warming hiatus tied to equatorial Pacific surface cooling. Nature. 2013;501(7467):403–407. doi: 10.1038/nature12534. [DOI] [PubMed] [Google Scholar]
- 9.Kaufmann RK, Kauppi H, Mann ML, Stock JH. Reconciling anthropogenic climate change with observed temperature 1998-2008. Proc Natl Acad Sci USA. 2011;108(29):11790–11793. doi: 10.1073/pnas.1102467108. [DOI] [PMC free article] [PubMed] [Google Scholar]
- 10.Ludescher J, et al. Very early warning of next El Niño. Proc Natl Acad Sci USA. 2014;111(6):2064–2066. doi: 10.1073/pnas.1323058111. [DOI] [PMC free article] [PubMed] [Google Scholar]
- 11.Tollefson J. El Niño tests forecasters. Nature. 2014;508(7494):20–21. doi: 10.1038/508020a. [DOI] [PubMed] [Google Scholar]
- 12. NOAA (2014) NOAA Climate Prediction Center. Available at www.cpc.ncep.noaa.gov/products/expert_assessment/ENSO_DD_archive.shtml. Accessed July 1, 2015.
- 13. ECMWF (2014) ECMWF El Niño Forecast. Available at www.ecmwf.int/en/forecasts/charts/seasonal/nino-plumes-public-charts-long-range-forecast. Accessed July 1, 2015.
- 14. NASA (2014) NASA Scientific News. Available at science.nasa.gov/science-news/science-at-nasa/2014/19may_elnino. Accessed July 1, 2015.
- 15.Blanke B, Neelin JD, Gutzler D. Estimating the effect of stochastic wind stress forcing on ENSO irregularity. J Clim. 1997;10(7):1473–1486. [Google Scholar]
- 16.Eckert C, Latif M. Predictability of a stochastically forced hybrid coupled model of El Nino. J Clim. 1997;10(7):1488–1504. [Google Scholar]
- 17.Kleeman R, Moore AM. A theory for the limitation of ENSO predictability due to stochastic atmospheric transients. J Atmos Sci. 1997;54(6):753–767. [Google Scholar]
- 18.Fedorov AV, Hu S, Lengaigne M, Guilyardi E. The impact of westerly wind bursts and ocean initial state on the development, and diversity of El Niño events. Clim Dyn. 2014;44(5):1381–1401. [Google Scholar]
- 19.Capotondi A, et al. Understanding ENSO diversity. B Am Meteorol Soc. 2015;96(6):921–938. [Google Scholar]
- 20.Hu S, Fedorov AV, Lengaigne M, Guilyardi E. The impact of westerly wind bursts on the diversity and predictability of El Nino events: An ocean energetics perspective. Geophys Res Lett. 2014;41(13):4654–4663. [Google Scholar]
- 21.Hartten LM. Synoptic settings of westerly wind bursts. J Geophys Res Atmos. 1996;101(D12):16997–17019. [Google Scholar]
- 22.Harrison DE, Vecchi GA. Westerly wind events in the tropical Pacific, 1986-95. J Clim. 1997;10(12):3131–3156. [Google Scholar]
- 23.Lengaigne M, Boulanger JP, Menkes C, Delecluse P, Slingo J. 2004. Westerly wind events in the tropical pacific and their influence on the coupled ocean-atmosphere system: A review. Earth Climate: The Ocean–Atmosphere Interaction. Geophysical Monograph Series, eds Wang C, Xie SP, Carton JA (American Geophysical Union, Washington, DC), Vol 147, pp 49–69.
- 24.Su J, Xiang B, Wang B, Li T. Abrupt termination of the 2012 Pacific warming and its implication on ENSO prediction. Geophys Res Lett. 2014;41(24):9058–9064. [Google Scholar]
- 25.Chiodi AM, Harrison D. Equatorial Pacific easterly wind surges and the onset of La Niña events. J Clim. 2014;28(2):776–792. [Google Scholar]
- 26.McPhaden MJ. Genesis and evolution of the 1997-98 El Nino. Science. 1999;283(5404):950–954. doi: 10.1126/science.283.5404.950. [DOI] [PubMed] [Google Scholar]
- 27.Fedorov AV. The response of the coupled tropical ocean-atmosphere to westerly wind bursts. Q J R Meteorol Soc. 2002;128(579):1–23. [Google Scholar]
- 28.Lengaigne M, et al. Triggering of El Nino by westerly wind events in a coupled general circulation model. Clim Dyn. 2004;23(6):601–620. [Google Scholar]
- 29.Jin FF. An equatorial ocean recharge paradigm for ENSO. 1. Conceptual model. J Atmos Sci. 1997;54(7):811–829. [Google Scholar]
- 30.Puy M, Vialard J, Lengaigne M, Guilyardi E. Modulation of equatorial Pacific westerly/easterly wind events by the Madden–Julian oscillation and convectively-coupled Rossby waves. Clim Dyn. 2015 doi: 10.1007/s00382-015-2695-x. [DOI] [Google Scholar]
- 31.Chelton DB, Schlax MG, Freilich MH, Milliff RF. Satellite measurements reveal persistent small-scale features in ocean winds. Science. 2004;303(5660):978–983. doi: 10.1126/science.1091901. [DOI] [PubMed] [Google Scholar]
- 32.Menkes CE, et al. About the role of Westerly Wind Events in the possible development of an El Niño in 2014. Geophys Res Lett. 2014;41(18):6476–6483. [Google Scholar]
- 33.Perigaud CM, Cassou C. Importance of oceanic decadal trends and westerly wind bursts for forecasting El Nino. Geophys Res Lett. 2000;27(3):389–392. [Google Scholar]
- 34.Fedorov AV, Harper SL, Philander SG, Winter B, Wittenberg A. How predictable is El Nino? Bull Am Meteorol Soc. 2003;84(7):911–919. [Google Scholar]
- 35.McGregor S, et al. Recent Walker circulation strengthening and Pacific cooling amplified by Atlantic warming. Nat Clim Chang. 2014;4(10):888–892. [Google Scholar]
- 36.Luo JJ, Sasaki W, Masumoto Y. Indian Ocean warming modulates Pacific climate change. Proc Natl Acad Sci USA. 2012;109(46):18701–18706. doi: 10.1073/pnas.1210239109. [DOI] [PMC free article] [PubMed] [Google Scholar]
- 37.Amaya DJ, Xie SP, Miller AJ, McPhaden MJ. Seasonality of tropical Pacific decadal trends associated with the 21st century global warming hiatus. J Geophys Res Oceans. 2015;120(10):6782–6798. [Google Scholar]
- 38.Harrison DE, Chiodi AM. Pre- and Post-1997/98 Westerly Wind Events and Equatorial Pacific Cold Tongue Warming. J Clim. 2009;22(3):568–581. [Google Scholar]
- 39.Drushka K, et al. Processes driving intraseasonal displacements of the eastern edge of the warm pool: The contribution of westerly wind events. Clim Dyn. 2015;44(3-4):735–755. [Google Scholar]
- 40.Deser C, et al. ENSO and Pacific decadal variability in the Community Climate System Model Version 4. J Clim. 2012;25(8):2622–2651. [Google Scholar]
- 41.Kao HY, Yu JY. Contrasting Eastern-Pacific and Central-Pacific types of ENSO. J Clim. 2009;22(3):615–632. [Google Scholar]
- 42.Kug JS, Jin FF, An SI. Two types of El Nino Events: Cold Tongue El Nino and Warm Pool El Nino. J Clim. 2009;22(6):1499–1515. [Google Scholar]
- 43.Kug JS, Choi J, An SI, Jin FF, Wittenberg AT. Warm Pool and Cold Tongue El Nino events as simulated by the GFDL 2.1 Coupled GCM. J Clim. 2010;23(5):1226–1239. [Google Scholar]
- 44.Capotondi A. ENSO diversity in the NCAR CCSM4 climate model. J Geophys Res Oceans. 2013;118(10):4755–4770. [Google Scholar]
- 45.Lopez H, Kirtman BP. Westerly wind bursts and the diversity of ENSO in CCSM3 and CCSM4. Geophys Res Lett. 2013;40(17):4722–4727. [Google Scholar]
- 46.Lian T, Chen DK, Tang YM, Wu QY. Effects of westerly wind bursts on El Nino: A new perspective. Geophys Res Lett. 2014;41(10):3522–3527. [Google Scholar]
- 47.Lopez H, Kirtman BP, Tziperman E, Gebbie G. Impact of interactive westerly wind bursts on CCSM3. Dyn Atmos Oceans. 2013;59:24–51. [Google Scholar]
- 48.Eisenman I, Yu LS, Tziperman E. Westerly wind bursts: ENSO’s tail rather than the dog? J Clim. 2005;18(24):5224–5238. [Google Scholar]
- 49.Gebbie G, Eisenman I, Wittenberg A, Tziperman E. Modulation of westerly wind bursts by sea surface temperature: A semistochastic feedback for ENSO. J Atmos Sci. 2007;64(9):3281–3295. [Google Scholar]
- 50.Gebbie G, Tziperman E. Incorporating a semi-stochastic model of ocean-modulated westerly wind bursts into an ENSO prediction model. Theor Appl Climatol. 2009;97(1-2):65–73. [Google Scholar]


