Significance
Diatoms are unicellular algae that form an intricate silica cell wall. A protective shell that is light enough to prevent sinking while simultaneously offering strength against predators is of interest to the design of lightweight structural materials. Using three-point bending experiments, we show that the diatom shell has the highest specific strength of all previously reported biological materials. Fracture analysis and finite element simulations also suggest functional differentiation between the shell layers and features to mitigate fracture. These results demonstrate the natural development of architecture in live organisms to simultaneously achieve light weight, strength, and structural integrity and may provide insight into evolutionary design.
Keywords: biomaterials, diatoms, nanoarchitecture, lightweight nanostructure, organic–inorganic composite
Abstract
We conducted in situ three-point bending experiments on beams with roughly square cross-sections, which we fabricated from the frustule of Coscinodiscus sp. We observe failure by brittle fracture at an average stress of 1.1 GPa. Analysis of crack propagation and shell morphology reveals a differentiation in the function of the frustule layers with the basal layer pores, which deflect crack propagation. We calculated the relative density of the frustule to be ∼30% and show that at this density the frustule has the highest strength-to-density ratio of 1,702 kN⋅m/kg, a significant departure from all reported biologic materials. We also performed nanoindentation on both the single basal layer of the frustule as well as the girdle band and show that these components display similar mechanical properties that also agree well with bending tests. Transmission electron microscopy analysis reveals that the frustule is made almost entirely of amorphous silica with a nanocrystalline proximal layer. No flaws are observed within the frustule material down to 2 nm. Finite element simulations of the three-point bending experiments show that the basal layer carries most of the applied load whereas stresses within the cribrum and areolae layer are an order of magnitude lower. These results demonstrate the natural development of architecture in live organisms to simultaneously achieve light weight, strength, and exceptional structural integrity and may provide insight into evolutionary design.
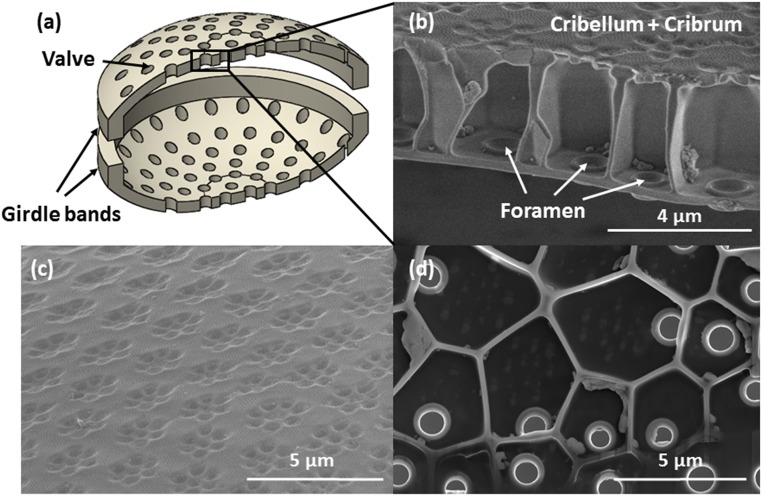
Diatoms are single-cell algae that form a hard cell wall made of a silica/organic composite. The ability to produce a functional biosilica shell presents several natural precedents that fascinate and inspire scientists and engineers. One fascinating aspect of such silica glass shells is their intricate, varied, and detailed architecture. Diatoms are generally classified based on the symmetry of their shells: Centric diatoms display radial symmetry whereas pennate diatoms have bilateral symmetry. Fig. 1A shows a schematic of a typical centric diatom and reveals that the shells are composed of two halves, called frustules, that fit together in a Petri-dish configuration. The frustules are attached to each other around the perimeter of the shell by one or several girdle bands. The frustules are usually porous with pore size and density varying between species. The frustule shell can also be composed of multiple layers with a cellular structure within the shell.
Fig. 1.
(A) Schematic of the diatom frustule shell. (B) Cross-section of shell demonstrating the honeycomb sandwich plate configure of the silica shell. (C) Cribrum, the outer layer of the frustule shell, displays hexagonal arrangements of pores. (D) The basal plate, the inner layer of the frustule shell, is punctuated by reinforced pores called foramen.
The proposed evolutionary functions for these intricate shell designs include nutrient acquisition, control of diatom sinking rate, control of turbulent flow around the cell, and protection from grazing and viral attack (1). Evidence in favor of a protective function is that the degree of shell silification depends on the environment, with greater amounts of silica found in shells grown in a predatory environment (2). As a deterrent to predation, the frustule makes use of an inherently brittle glass as a structurally protective material while balancing other evolutionary pressures. A denser shell may provide greater protection but will cause the diatom to sink beyond depths suitable for photosynthesis. A solid shell might also prevent exchange of resources and waste between the diatom cell and its environment. This requires adaption through control of the frustule micromorphology or modification of the constituent silica/organic composite material (3). The protective aspects of the frustule shell are clear; what remains an open question is how much the intricate pore structure and cellular design contribute to the amplified structural resilience vs. biological function.
The size of most diatom species ranges from 2 to 200 µm (4, 5), which renders most of the traditional mechanical testing methods inadequate to characterize such complex materials; a few mechanical studies on diatoms have been reported (6–11). The majority of studies perform atomic force microscopy (AFM) indentation (6–9) on a full frustule of centric or pennate diatoms. Reported values of hardness ranged from 0.06–12 GPa and values of elastic modulus from 0.35–22.4 GPa. Differences in local pore structure and the nonplanar geometry of the frustule were often cited for the variance in mechanical properties. Three-point bending tests on beams that were extracted from the diatom frustule reported failure strengths of 336 ± 73 MPa but were complicated by local penetration of the indenter tip and tilting of the frustule during testing (10, 11).
This overview demonstrates a wide range in the reported hardnesses and elastic moduli for biosilica shells. Most of these experiments were performed on full diatom shells, which in some instances contained organic cellular material; it is unclear whether the measured mechanical data represent the deformation of the constituent biosilica or the overall deformation of the shell through bending, local twisting, pivoting, and so on. Indentation using AFM can introduce inaccuracies such as tip sliding, and the resulting uncertainty in compliance within a single set of experiments, as well as among the data obtained with different instruments, makes it challenging to compare mechanical properties of the diatoms across the reported experiments. Within a single species, these mechanical data may provide qualitative trends in the structural response of the diatom shells; it is difficult to make any conclusions on the mechanical properties of the constituent biosilica. The mechanisms of silica biogenesis likely varies among the species (12), but it is unclear to what extent these differences reflect the variation in elastic modulus and hardness between species and within an individual frustule.
To investigate the mechanical properties of the diatom frustule and constituent biosilica as decoupled from the full-shell structural response, we conducted in situ three-point bending experiments on beams with roughly 3.5-µm-square cross-sections fabricated from the frustule of Coscinodiscus sp. performed in a scanning electron microscope (SEM) equipped with a nanoindenter, as well as ex situ nanoindentation on an individual basal plate that had been isolated from a frustule and the girdle band. We determined the elastic modulus to be 36.4 ± 8.3 GPa and the failure strength to be 1.1 ± 0.3 GPa. We discuss these results, as well as deformation and failure mode of the diatoms, in the context of their atomic-level microstructure obtained from transmission electron microscopy (TEM) and finite element method (FEM) simulations of the three-point bending tests.
Frustule Morphology and Microstructure
The cross-section of the frustule of a Coscinodiscus sp. is shown in Fig. 1B. The cribrum and cribellum constitute the distal surface of the shell, and the basal plate composes the proximal surface. Areolae walls span these two layers and approximate a honeycomb lattice configuration. Fig. 1C shows the hexagonal arrangement of pores of the cribrum and cribellum. The cribrum is composed of clusters of hexagonally arranged, elliptical pores with average dimensions of 364 nm for the major axis and 283 nm for the minor axis, and the clusters are arranged in a hexagonal pattern. The cribellum layer is composed of 50-nm-diameter pores that are hexagonally arranged across the entirety of the surface and is laid atop the cribrum. Fig. 1D shows the basal plate and areolae cells. Each areolae cell has five or six side walls and contains a single foramen with an average inner diameter of 822 nm.
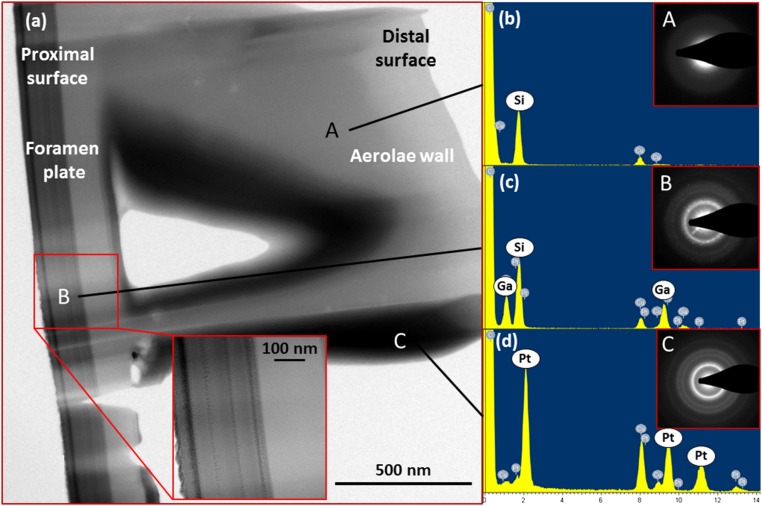
Fig. 2A shows a TEM micrograph of the frustule of Coscinodiscus sp. Fig. 2 B–D provide site-specific energy dispersive spectroscopy (EDS) data with diffraction patterns in the insets and convey that the material in the areolae wall is made nearly exclusively of silicon. Smaller copper peaks correspond to signal contamination from the copper TEM grid. The inset diffraction pattern indicates that the region is entirely amorphous. Fig. 2B shows nearby regions that correspond to the interior surfaces of the areolae cell; the amorphous/nanocrystalline Pt peaks come from the Pt needle that was used during ion-beam assisted deposition and not from the biological sample. Fig. 2C provides EDS data for a 275-nm-thick region of the basal plate and shows strong Si and Ga peaks, with the latter caused by the Ga+-ion milling during thinning. It seems that Ga was localized within this basal plate region even though the entire sample was exposed to ion milling. We believe that the porosity observed within the nanocrystalline region (Fig. 2C, Inset) facilitated Ga sequestration into it; Ga content is lower in the amorphous regions (Fig. 2B, Inset). The difference in the microstructure between the nanocrystalline and amorphous silica is reflected in the difference in the diffraction contrast between the two regions (Fig. 2A, Inset) and shows that a sharp interface exists between the two microstructures. Fig. S1 shows this contrast difference within the basal plate was also observed in SEM imaging.
Fig. 2.
(A) TEM micrographs of the frustule shell. (Inset) A zoomed in view of the basal plate. EDS data and spot patterns taken from (B) region A, (C) region B, and (D) region C show that the majority of the frustule shell is amorphous silica.
Fig. S1.
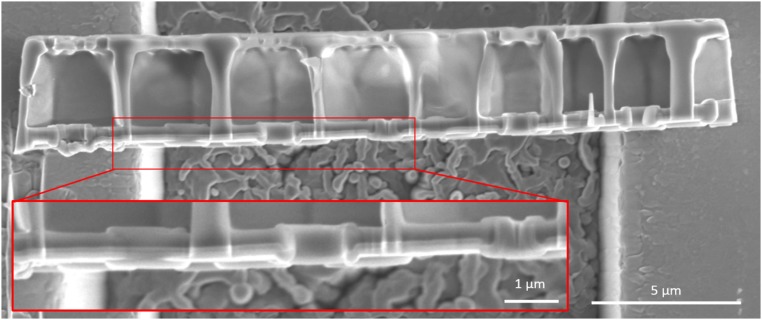
SEM image giving a top-down view of a representative beam sample. (Inset) The sharp contrast difference within the basal plate.
The vast majority of the frustule, including the areolae walls, shows a smooth, amorphous microstructure (labeled region A in Fig. 2A). The only place where microstructure deviated from amorphous was within the basal plate, which shows several bands between 50–80 nm in thickness, oriented parallel to the frustule surface, and separated by striated patterns of darker contrast (region B in Fig. 2A). There is a 10-nm-thick band that displays rough contrast that is adjacent to the smooth material in region A. The nanocrystalline diffraction pattern in Fig. 2C confirms the presence of these regions of local order. Region B has a total thickness of 275 nm, about 47% of the thickness of the basal plate, and displays a darker contrast than the material in region A, which suggests that it is either more densely packed or contains a higher silica/organics ratio than material in region A.
Previous work has uncovered that the microstructure of the frustule silica can vary between species and across stages of frustule development. Reported microstructures include compacted spheres, networks of fused spheres, silica microfibrils, and smooth homogeneous silica (13, 14). Schmid et al. (3) and Rogerson et al. (15) investigated wall morphogenesis in centric diatoms Thalassiosira eccentrica and Coscinodiscus asteromphalus and identified “growing zones” that are loose aggregates of 12-nm-diameter silica spheres, where new frustule growth occurred, and “compacting zones” that display a homogenous morphology where more mature growth had occurred. In the centric diatoms studied by these authors, the frustule growth occurred in a distal direction such that the growing zones were oriented outward relative to the compacting zones. This orientation suggests that the differences in microstructure observed here likely do not correspond to growing and compacting zones. Observations of wall morphogenesis by Schmid and Volcani (16) and Hildebrand et al. (17) reported the presence of clustered spheres in Coscinodiscus wailesii and Thalassiosira pseudonana. These authors reported that frustule growth began in the center and extended compacted silica sphere strings radially to the margin. Later growth stages of the basal plate occurred by cross extensions and compaction, forming an 85- to 100-nm-thick template for subsequent distal growth. The proximal nanocrystalline microstructures observed in this work may correspond to this initial basal template. It has been suggested that following radial growth, sintering plays an important part in the morphogenesis of the frustule by filling in the spaces of the compacted spheres with monomeric silica, flattening the deposition surface, increasing its radius of curvature, and promoting adherence (14, 18). This type of sintering would result in the amorphous material observed in region A shown in Fig. 2 A and B.
Mechanical Response in Bending and Nanoindentation
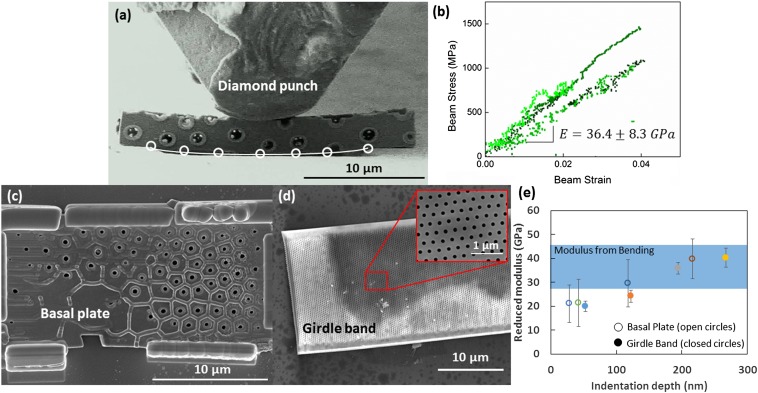
Fig. 3B shows the stress strain data for representative three-point bending tests. The data indicate linear elastic loading with no plastic deformation up to failure. Failure stress varied between 850–1,460 MPa and failure strain varied between 2.2–4.0%. The average elastic modulus was calculated to be 36.4 ± 8.3 GPa based on a linear fit to the slope. The experiments were performed in displacement-controlled mode, and if a settling event resulted in a displacement rate greater than the prescribed one the instrument controller adjusted the indenter head to maintain the prescribed rate. This feedback response occasionally manifested itself as a drop in stress when the feedback loop adjustment caused a short local unloading. Failure was catastrophic and occurred faster than the imaging scan rate of the SEM. Upon failure, most samples released the accumulated strain energy by launching from the substrate and could not be recovered. Fig. 4 shows one half of such a bending sample that was recovered and shows that failure occurred by propagation of a crack through the center of the beam.
Fig. 3.
(A) Snapshot from a video of three-point bending of the frustule shell. Circles show the locations that were used to fit a circle for strain calculation. (B) Stress-strain data collected from bending experiments that has been corrected for rigid-body displacements. Nanoindentation was performed on (C) an isolated basal plate and (D) girdle band. (E) The reduced modulus as measured from nanoindentation on both an isolated basal plate and girdle band plot against indentation depth. For comparison the elastic modulus as determined from bending experiments is also shown.
Fig. 4.
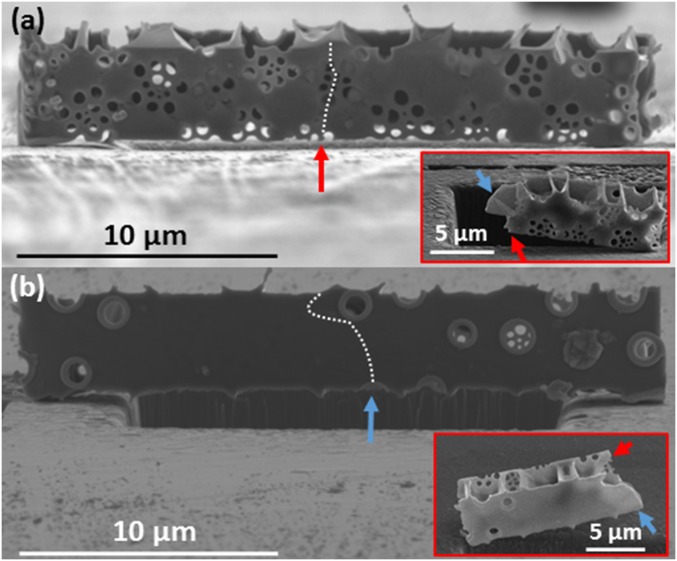
(A) The path of crack propagation through the cribrum. The crack follows the stress concentrations surrounding the cribrum pores. (B) The path of crack propagation through the basal plate. The crack is deflected by the reinforced foramen. (Insets) The fractured beam. The red arrow corresponds to the location where the crack intersects the bottom edge of the cribrum layer and the blue arrow corresponds to the location where the crack intersects the bottom of the basal layer.
Fig. 3E gives the calculated modulus against the contact depth acquired during nanoindentation of the basal plate and the girdle band. In both materials, the modulus decreased with contact depth. The modulus calculated from indentation on the basal plate varied from 21.0 ± 7.7 GPa at 28 nm to 39.7 ± 8.3 GPa at 217 nm and in the girdle band from 19.9 ± 2.1 GPa at 53 nm to 40.2 ± 4.0 GPa at 267 nm.
Differentiation of Frustule Layers in Mechanical Response
Fig. 4 shows the fractured surface of a representative bending test sample. Fig. 4 A and B show the path of crack propagation across the basal plate and the cribrum. Bending induces a compressive stress along the inner edge of the beam, abutting the indenter head, and a tensile stress along the outer edge, which is likely where the crack initiated. It seems that a central pore present in the basal plate (indicated by the blue arrow) and the cribrum (indicated by the red arrow) served as a stress concentrator and the crack nucleation site because it is close to the location of maximum bending moment. Within the cribrum, the crack traveled upward toward a cluster of pores beneath the applied load, and its trajectory continued through a series of these pores upward, tracing a path between stress concentrations (Fig. 4A). The postdeformation crack surface shown in Fig. 4A, Inset illustrates that the pores acted as perforations for the crack propagation. In the basal plate (Fig. 4B) the crack propagated upward, bending slightly to follow the path of the crack within the cribrum. These paths diverge when the crack propagating through the basal plate encounters a foramen near the top edge of the beam. Instead of traveling through the pore, the crack is deflected around the pore. The foramina differ from the cribrum pores in that they have a raised rim around the circumference of the pore. Our experiments revealed that the pores in the cribrum act as stress concentrators and fail by crack propagation whereas the rim reinforcements in the foramina seem to shield them against failure. This may shed light on the differentiation in function between the basal plate and the cribrum: The resilient pores in the basal plate may have a primarily structural function, whereas the pores of the cribrum and cribellum may serve more in the capacity of resource acquisition.
Elastic Properties of Diatom Shell Components
Fig. 3B shows that the stress strain data from bending tests has a signature of linear elastic loading ending in brittle failure. No plasticity or controlled crack nucleation or growth was observed before failure. Any nonlinearity in the data can be correlated to a rigid body movement of the beam captured in the video. We expect some variation in the measured load due to a small misorientation (∼2°) of the indenter head relative to the sample surface normal between tests as well as nonideal contact between the beam and the testing platform and indenter head. The measured elastic modulus from bending tests was consistent among all four reported samples, at 36.4 ± 8.3 GPa.
Nanoindentation response of the isolated basal plate and the girdle band shows remarkable similarity. Average elastic moduli varied with increasing contact depth from 21.0 ± 7.7 at 28 nm to 39.7 ± 8.3 GPa at 217 nm in the basal plate, and from 19.9 ± 2.1 at 53 nm to 40.2 ± 4.0 GPa at 267 nm in the girdle band. The submicron thickness of the samples and the nanomechanical experiments in general render it challenging to eliminate all sources of experimental error. For shallow contact depths, some measurement error likely stems from the nonideal geometry of the tip, and at greater contact depths we encounter effects from the stiff substrate. Despite the uncertainty, these extreme cases set a range that matches well with the modulus calculated from bending tests.
The elastic moduli obtained in this work are in contrast to previously reported elastic moduli for Coscinodiscus sp. between 0.06–0.53 GPa (9) obtained from AFM indentation as well as results reporting differences in mechanical properties between different components of the diatom shell. Beyond inherent differences between three-point bending, nanoindentation, and AFM indentation, the boundary conditions of the previous AFM indentation tests are the most significant difference from the results reported here. Indentation into the full diatom frustule shell or even into half of the frustule—in either a concave or convex configuration—can result in a deformation response of the entire structure, which would not be indicative of its material mechanical properties. This can include pivoting of the shell or localized shell buckling if the shell is immobilized. Such movement and localized deformation has been verified in situ during previous mechanical testing (10, 11). The low values and variance reported in previous studies are most likely due to movement or deflection of the frustule during testing and differences in compliance between loading the diatom axially and radially. By using the in situ bending tests on an extracted lamella representative of the frustule and nanoindentation on an isolated basal plate and girdle band we are able to significantly reduce these possible adverse displacements and to characterize the material more precisely.
The similarity in the elastic properties between the basal plate and the girdle band observed in this study suggests that they are mechanically equivalent composite materials. Swift and Wheeler (19) estimated that 20–40% of the dry weight inside the diatom silica valves is protein and carbohydrate. Kröger et al. (12) reported that the silica precipitated from in vitro studies of silica-depositing long-chain polyamines extracted from a diatom frustule had 1.25 μg of SiO2 per 1 μg of polyamine. Using the density of 2 g/cm3 for silica and 0.8 g/cm3 for the organic material in the diatoms studied here (14), we estimate the volumetric fraction of silica to be between 37.45 and 66.67%.
The rule of mixtures can provide an upper bound for the elastic modulus of the composite material. The expression for the composite modulus is given by
| [1] |
where f is the volume fraction of silica and and are the elastic moduli of the silica and organic component, respectively. It is reasonable to assume that the elastic modulus of the organic component is significantly lower than that of the silica; applying Eq. 1 to the estimated range of volume fractions predicts the composite modulus to be between 26.2–46.7 GPa, consistent with the values reported here and similar to synthetic bio-silica composites such as Bioglass45S5 (45% SiO2 by weight) at 35 GPa (20).
Strength vs. Relative Density
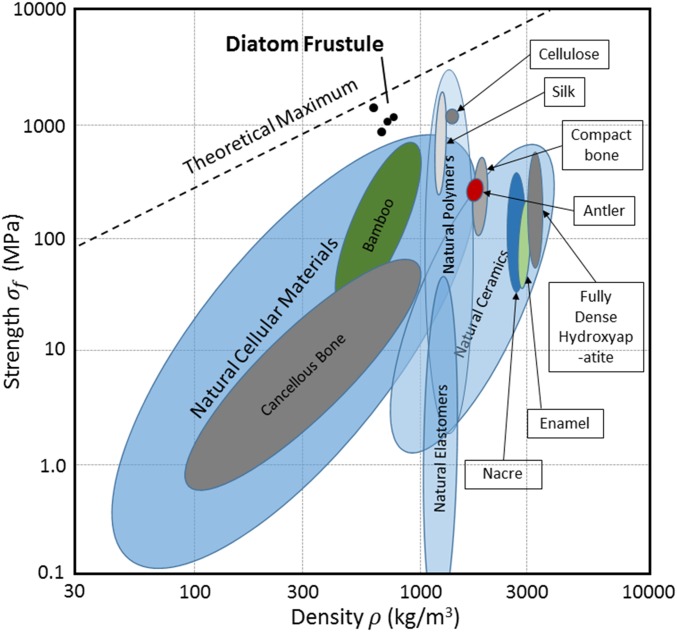
The average failure stress was 1.1 ± 0.3 GPa at a strain of 3.5 ± 0.7%, with variations up to 250 MPa, which seem to be partly related to the distribution of pores in the beam. The highest stresses occurred in samples that lacked foramen segments along the bottom edge of the testing beam. Samples that failed at lower stresses had foramen segments, which suggests that their role in strengthening the diatom against stress concentration does not prevent them from serving as the weak points for failure along the free edge when the beam is subjected to bending. The average relative density of the beam samples used in this study, as calculated from direct volume measurements taken in the SEM, is 30.1%. A schematic of the frustule and list of measured geometries and relative densities is provided in Fig. S2 and Tables S1 and S2. Using the density of bulk silica at 2,210 kg/m3, which provides the upper bound for the constituent material density, gives the frustule material a specific strength of 1702 kN⋅m/kg, a value well above those of other natural cellular, composite and silk materials including bamboo (693 kN⋅m/kg), mollusk shell (127 kN⋅m/kg) (21, 22), and spider silk (1,000 kN⋅m/kg) (23).
Fig. S2.
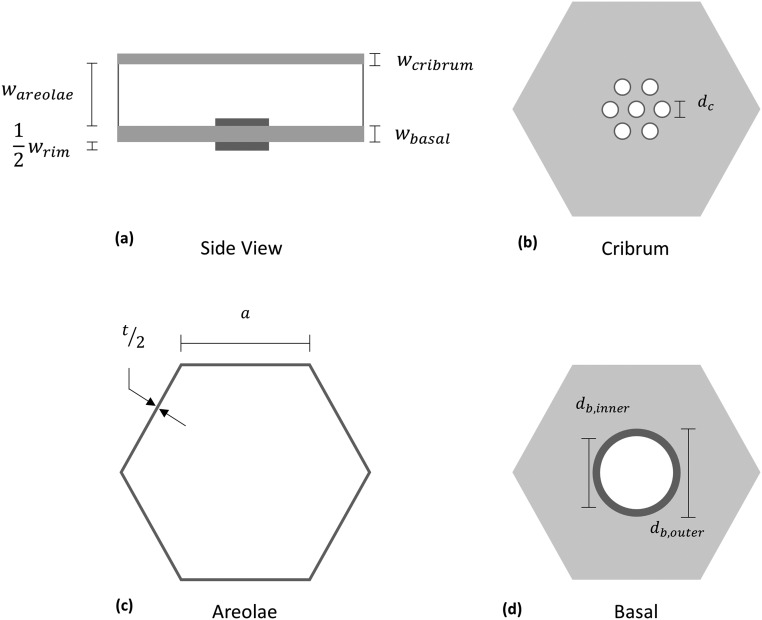
Schematic showing the hexagonal unit of frustule. (A) A cross-section of the frustule shell. (B–D) Top-down views of each layer of the frustule shell.
Table S1.
Pore dimensions and layer widths used in the general model for relative density
| Sample | dc, µm | db, inner, µm | db, outer, µm | wcribrum, µm | wareolae, µm | wbasal, µm | wrim, µm | ρrelative |
| 1 | 0.34 | 0.80 | 1.47 | 0.42 | 2.66 | 0.62 | 0.29 | 0.401 |
| 2 | 0.34 | 0.82 | 1.37 | 0.26 | 2.97 | 0.41 | 0.19 | 0.314 |
| 3 | 0.35 | 0.89 | 1.49 | 0.36 | 2.67 | 0.48 | 0.28 | 0.369 |
| 4 | 0.27 | 0.90 | 1.43 | 0.31 | 1.94 | 0.32 | 0.20 | 0.373 |
| 5 | 0.30 | 0.70 | 1.33 | 0.38 | 2.49 | 0.35 | 0.21 | 0.360 |
Table S2.
Layer and solid volumes for each beam sample and associated relative density
| Sample | Vcribrum, µm3 | Vareolae, µm3 | Vbasal, µm3 | Vrim, µm3 | Vsolid, µm3 | ρrelative |
| 1 | 25.05 | 20.38 | 44.80 | 4.20 | 280.65 | 0.336 |
| 2 | 17.98 | 28.46 | 35.84 | 1.38 | 322.33 | 0.260 |
| 3 | 38.40 | 39.75 | 57.39 | 5.01 | 455.15 | 0.309 |
| 4 | 20.52 | 16.30 | 21.80 | 1.80 | 196.42 | 0.308 |
| 5 | 27.84 | 22.17 | 28.83 | 2.51 | 277.52 | 0.293 |
Fig. 5 shows an Ashby plot of strength vs. density for several natural biomaterials (22). We find that the diatom frustule occupies a previously untapped space above the upper limit of natural cellular materials and has strengths comparable to the strongest natural polymers but at a lower density (22). We attribute this high specific strength to the honeycomb architecture combined with a low density of flaws in the constituent material. The TEM image in Fig. 2A shows no visible defects or flaws down to the estimated contrast roughness of ∼2 nm in the nanocrystalline layer within the basal plate.
Fig. 5.
Ashby plot of strength vs. density for naturally occurring biological materials (22). Diatom frustule samples show specific strengths above other reported cellular materials and are comparable to the strongest natural polymers. The theoretical maximum is determined by extrapolation of the strength and density of diamond.
This strength is still well below theoretical, in contrast to the strengths of synthesized high-purity silica nanowires that attain near-theoretical tensile strengths between 10–25 GPa (24). This is likely because the frustule is a silica composite rather than pure silica. Within the last decade, much research has been dedicated to elucidate the composite nature of the frustule, with some studies revealing the presence and function of species-specific biopolymers within the frustule (25). In vitro studies have shown that these biopolymers aid in polymerization and flocculation of silica particles (26). Among the studied biopolymers, Coscinodiscus seems to exclusively contain long-chain polyamines (LCPAs) with reported molecular masses ranging between 600–1,500 Da (12, 25). The exact distribution of silica and organic material within the frustule has not been experimentally verified, but it seems to be tightly bound to the silica within the frustule because it survived the cleaning process to remove the organic cellular material. Further evidence for these tight, likely chemical bonds is that active LCPAs were recovered from fossilized diatomaceous material (27, 28). A proposed mechanism for the promotion of silica precipitation by LCPAs is the presence of alternating protonated and nonprotonated tertiary amine groups in the polyamine chains, which form strong hydrogen bonds to silicic acid and facilitate the Si–O bond formation (29). Such a mechanism suggests that interactions in the composite material are through hydrogen bonding between silica and organic phases and through covalent bonding within the silica. Failure in the biosilica composite most likely occurs at the weaker hydrogen bonds between the silica and organic material.
Stress Distribution Within Frustule Layers
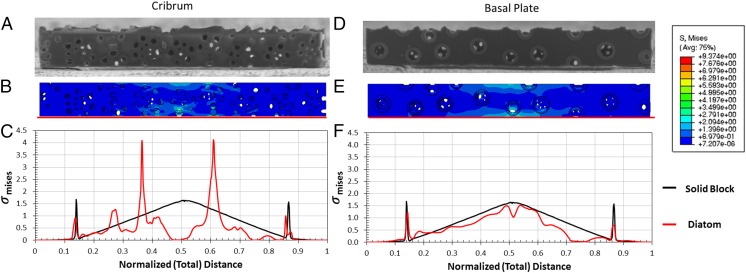
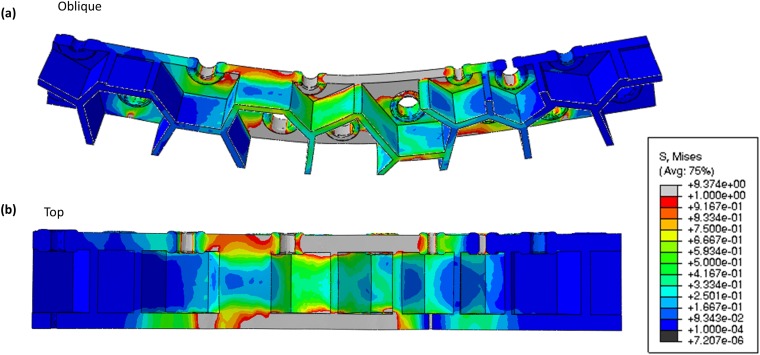
The presence of an architecture within the diatom design results in a heterogeneous stress distribution within the frustule. Fig. 6 shows the Mises stress distribution at the maximum bending strain of the simulated FEM beam (Fig. 6 B and E) along the bottom edge of the cribrum and basal plates (Fig. 6 C and F). The Mises stress of a solid beam at similar strain is shown as a black line for comparison. Within the cribrum, some thin sections surrounding the pores show local stress concentrations, manifested as two symmetric peaks ∼±0.12 away from the center and one peak −2.2 away from the center. In the rest of the sample, the stresses remain below those in the solid beam. This is likely because the multiple pores present along the bottom edge are unable to sustain high stresses along this edge. Within the basal plate, the stress distribution closely follows that in the solid beam and increases toward the center of the beam. Near the center, the presence of a reinforced foramen results in a local reduction of stress. Local fluctuations in the stress distribution within both layers likely stem from the presence of pores or locations where the areolae walls intersect the cribrum or the basal plate.
Fig. 6.
(A and D) SEM imaged of the cribrum layer and the basal plate of a bending sample. (B and E) The corresponding von Mises stress distribution from FEM simulations. (C and F) Variation in stress along the bottom edge, with the stress of a solid beam at equivalent strain shown in black for comparison. It appears that the variation in stress in the basal plate follows that of the solid beam more closely than in the cribrum.
Fig. S3 shows the Mises stress distribution within the areolae layer. This distribution shows that the stresses attained in the areola walls are less than those in the cribrum and in the basal plate. Within the center of the areolae walls, stresses are up to an order of magnitude lower than those in the cribrum and in the basal plate, and near the intersection with either outer layer the stresses in the areolae are approximately half of the maximum stresses observed in the cribrum and in the basal plate. At the locations where the areolae walls intersect the outer layers, the major contribution to Mises stress comes from the shear stresses, which suggests that under bending the areolae is not contributing significantly to the mechanical response, and maximum Mises stresses occur around the pores in the cribrum and the foramen within the basal plate.
Fig. S3.
Displays the von Mises stress distribution throughout the bending beam in an (A) oblique view to highlight the stress distribution in the areolae walls and (B) top-down view.
Conclusion
We used in situ three-point bending and nanoindentation experiments to investigate the mechanical properties and fracture behavior of the diatom Coscinodiscus sp. frustule. These experiments disclosed similarities in the elastic properties of the biosilica found in the frustule and in the girdle band, with average modulus from three-point bending tests of 36.4 ± 8.3 GPa. We discovered that the frustule has an unprecedentedly high specific strength, exceeding that of all other reported natural biomaterials, which we attribute to the combination of the honeycomb sandwich plate architecture and extremely low flaw density in the constituent biosilica. TEM analysis of the frustule revealed that it is almost entirely an amorphous, solid material, with some local regions displaying a nanocrystalline microstructure. Analysis of crack propagation at failure provides strong evidence for the biofunctional differentiation between the frustule layers, with the foramen deflecting crack propagation and the cribrum layer seen to fail along its pores. FEM simulations convey that most of the applied stress is supported by the basal plate and that the areolae walls do not contribute significantly to bearing load. These results provide useful insights toward understanding the extreme resilience of hard biological materials to failure and aid in efficient design of new classes of bioinspired, low-density, and high-strength materials.
Methods
Diatoms.
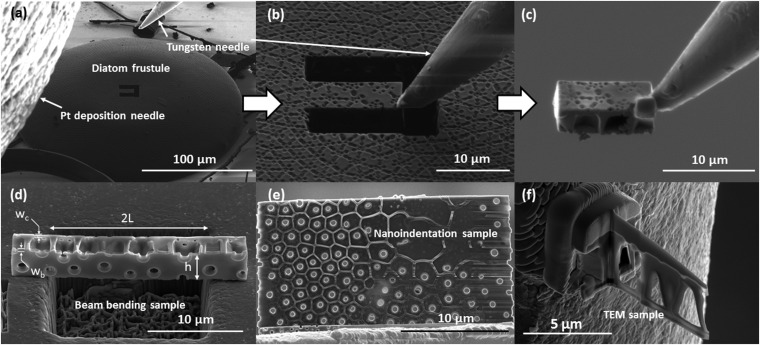
Coscinodiscus sp. used in this study were obtained from the Biological Institute at Norwegian University of Science and Technology and had been previously collected from the Trondheimsfjord inlet of the Norwegian Sea. These samples were washed in Milli-Q (MQ) water, centrifuged in a solution of 3 mL H2O2 and 1 mL HCl, and finally rinsed with MQ water and ethanol. This treatment was intended to remove the cellular organic material and to separate the frustule half-shells and girdle band from one another; this type of treatment also unintentionally fractured many of the components. Samples were stored in methanol before nanomechanical experiments. SEM samples were prepared by applying a drop of this methanol solution containing the cleaned diatoms onto a silicon chip that was coated with 100 nm of gold and then allowing the methanol to evaporate in air. Despite the absence of a conductive coating, we found that the diatoms could be successfully imaged in SEM with no excessive charge accumulation. Fig. 1 B–D show SEM images of an example frustule sample following cleaning and mounting. Fig. S4 provides a graphical description of the fabrication procedure for samples for three-point bending experiments, nanoindentation, and TEM analysis.
Fig. S4.
(A–C) SEM snapshots demonstrating the focused ion beam lift-out method. The FIB is used to mill out a rectangular sample and a Pt deposition needle is used to attach to the tungsten micromanipulator for lift-out. This technique can be used to prepare (D) bending samples, (E) nanoindentation samples, and (F) TEM lamella from the frustule shell. Dimensions of the beam sample are shown in D. The gauge length of the beam is 2L and the height of beam is h. Thickness of the cribrum layer, wc, and basal layer, wb, are also shown.
Three-Point Bending Experiments.
Bending tests were performed in a custom-made in situ SEM (FEI Quanta) with a nanomechanical module, InSEM (Nanomechanics, Inc.). A wedge-shaped diamond tip with a radius of 5 µm was used to indent the beam at a constant nominal displacement rate of 5 nm/s to failure. Load and displacement were continuously measured at a rate of 500 Hz with a simultaneous video capture of the deformation process. Stresses and strains were calculated along the bottom edge of the beam directly under the point of applied load, which corresponds to the point of maximum tensile stress. Expanded discussion of the stress calculation is included in Supporting Information.
TEM Analysis.
Microstructural analysis was performed via transmission electron microscopy (FEI Tecnai F30) at an accelerating voltage of 300 kV. Standard-less energy dispersive spectroscopy (INCA EDX; Oxford Instruments) was used to investigate the local elemental composition of the sample.
Nanoindentation.
Nanoindentation was performed ex situ in a Hysitron nanoindenter using a diamond Berkovich tip under a constant nominal displacement rate. The thickness of the basal plate and girdle used here was observed to vary between 600–700 nm, so indentation was performed up to a total displacement between 50–300 nm. Elastic moduli were calculated using the method of Oliver and Pharr (30).
Stress Analysis of Three-Point Bending Experiments
Stresses and strains were calculated along the bottom edge of the beam directly under the point of applied load, which corresponds to the point of maximum tensile stress:
| [S1] |
| [S2] |
where is the bending moment, is the perpendicular distance away from the neutral axis of the beam, is the cross-sectional moment of inertia, and is the radius of curvature (31). At the point of maximum tensile stress, the moment and , is the applied load, is half the span of the gauge section, and is the height of the beam. The contribution from the cribrum and basal plate to the moment of inertia are and , respectively, where is the thickness of the layer and subscripts c and b refer to the cribrum and basal plate. As shown in Fig. S4D, the gauge section, and the beam height, are dimensions that lie within the shell plane and the width is perpendicular to the shell plane. Estimation of the contribution to the moment of inertia from the areola lattice can be difficult due to the directionality of the hexagonal cell array. Under this loading configuration, an individual areolae wall has a thickness, and a width, μm, so that and . The predicted contributions to the area moment of inertia from the areolae walls with these dimensions are at least 2 orders of magnitude less than the individual contribution from the cribrum and from the basal plate, which makes it reasonable to exclude the contribution of areolae from the analysis. We observed a small, <3° biaxial curvature in the as-fabricated frustule beam, possibly due to relaxation of residual stresses after its extraction from the frustule. To account for this curvature, the height of the beam was calculated as the average of the two layers measured after sample extraction, . This results in the following expression for the uniaxial tensile bending stress in the bottom edge of the beam:
| [S3] |
The beams tested in this work were not fixed to the substrate to avoid generating boundary constraints, so any initial misorientation of the beam or misorientation of the indenter tip with respect to the beam resulted in “settling” events during testing manifested by marginal tilting and translation of the beam before attaining full contact. As a result, the measured indenter displacement could not be used to calculate strain in the sample. Using the acquired video frames, we analyzed 450 still images taken between incipient sample loading up to failure, to track the position of seven points along the bottom edge of the bending sample. A schematic in Fig. 3A shows these seven points whose positions were fit to a circle with radius ρ and used to determine the tensile strain as
| [S4] |
SEM Imaging Contrast Within Basal Plate
Fig. S1 shows a top-down view of a representative frustule beam. A sharp contrast difference is observed within the basal plate. Fig. S1, Inset shows a zoomed-in view of a section of the basal plate to highlight this contrast. This contrast difference was also observed in TEM analysis of the frustule (Fig. 2A), suggesting that these regions indicate layers of differing material or microstructure.
FEM Simulations
A computer-aided design model of one of the bending samples was meshed using 729,000 tetragonal elements in Abaqus simulation package 6.14 (Simulia). To emulate three-point bending, the beam was modeled in contact with steel supports on both ends and displacement was applied via a diamond roller from the top. The beam was assumed to have an elastic modulus of 35 GPa, closely matching the experimental value obtained here. The steel supports and diamond roller were assumed to have elastic moduli of 200 GPa and 1,000 GPa, respectively. Nodes on the bottom face of the steel supports were specified to have no displacement and hard, impenetrable contact via penalty enforcement was assumed between the beam and steel supports and between the beam and diamond roller. A friction coefficient of 0.1 was applied between the steel supports and the beam to prevent lateral sliding during bending. Displacement of the diamond roller was chosen such that the resulting maximum tensile beam strain was similar to experimental values calculated from the captured video. For comparison, bending simulations were also performed on a solid beam of similar dimensions and elastic modulus.
Fig. S3 shows the distribution of stress through a three-point bending sample recreated for FEM analysis. The stresses within the areolae region are up to an order of magnitude lower than the stresses supported in either the cribrum or basal layers.
Bending Beam, Nanoindentation, and TEM Sample Fabrication
Fig. S4 shows a graphical description of the procedure to fabricate samples for three-point bending experiments, nanoindentation, and TEM analysis from the diatom shell.
Samples for bending experiments, TEM analysis, and ex situ nanoindentation were fabricated using the focused ion beam (FIB) lift-out technique in a dual-beam SEM (FEI Versa 3D) (32). Once an intact frustule was identified, a cantilever beam with plane dimensions of 3.5 × 24 µm was milled out of the center of the frustule at 16 kV and 0.25 nA. The depth of the beam was set by the thickness of the frustule shell and was ∼3.5 µm. A site-specific, platinum deposition needle and tungsten micromanipulator (FEI EZLift) were used to extract the sample. The micromanipulator was welded to the free end of the cantilever beam using Pt deposition and the opposite end of the cantilever was milled away from the parent frustule. Fig. S4 A–C show SEM images of this lift-out procedure. The beam was then transferred onto a stainless steel substrate and placed over prefabricated 20- × 20- × 40-µm wells. The same micromanipulator was then used to position the beam such that its gauge section was parallel to the short edge of the well and spanned it entirely, ensuring that the shell plane normal was perpendicular to the loading direction, as shown in Fig. S4D. This type of parallel loading allows us to deform all frustule layers simultaneously and removes the complications caused by the compliance differences between layers and the possibility of localized deformation that emerges when the frustule layers are loaded in series (10, 11). This orientation also limits the influence of the areolae walls and simplifies the calculation of stresses within the beam.
Fabrication of a basal plate for nanoindentation was prepared using the described lift-out technique to extract a 25- × 25-µm plate from the basal diatom plate. The removed plate was then transferred to a copper TEM grid for thinning. The plane of the frustule shell was oriented parallel to the ion beam, and the cribellum, cribrum, and areolae walls were removed using milling conditions of 16 kV and 50 pA, leaving only the basal plate (Fig. S4E). Using the tungsten micromanipulator, the basal plate was transferred from the TEM grid to a stainless steel substrate and secured by depositing Pt along the edges of the plate. Decomposition and fracture of the diatom shell during cleaning resulted in several girdle bands suitably oriented for nanoindentation on the substrate, which was performed with no modification to the structure. Fig. 3 C and D show SEM images of the basal plate and the girdle band used in this study.
Samples for TEM analysis were fabricated using the described lift-out procedure, with the extracted lamella transferred and attached to the Cu TEM grid using the Pt deposition needle in the FIB. The attached TEM samples were then thinned using FIB to a thickness of less than 100 nm using a voltage of 16 kV and progressively decreasing currents from 50 to 11 to 4 pA to ensure electron transparency. A thinned TEM lamella is shown in Fig. S4F.
Analysis of Relative Density
We define the relative density of the diatom frustule as the ratio of material volume in the frustule, , to volume in a solid shell of equal dimension, :
| [S5] |
where , , and are the volume of the cribrum, areolae, and basal layers, respectively, and is the volume of the raised foramen rim. Owing to symmetry of the frustule, we start by considering a single hexagonal unit of the frustule as shown in Fig. S2 and develop a general model for the relative density. Fig. S2 B–D show schematics of the projected area in each layer of the frustule. By defining the relative projected area as the ratio of projected area for a given layer i, , and the solid area, , Eq. S5 can be rewritten as
| [S6] |
where , , and are the depth of the cribrum, areolae, and basal layers, respectively, and is the thickness of the raised foramen rim. is the total depth of the beam.
From the observed hexagonal arrangement of pores in the cribrum, we assume seven cribrum pores per hexagonal unit. The projected area of the cribrum is then given:
| [S7] |
where is the diameter of a cribrum pore. The total area of the walls that make up the areolae is
| [S8] |
where a and t are the length and thickness of the areolae wall, respectively. The area within the basal layer and area of the raised rim are
| [S9] |
| [S10] |
where and are the inner and diameter of the foramen rim. Noting that the solid area is simply the area of the hexagonal cell, , Eq. S6 then gives the final expression for the relative density of the frustule:
| [S11] |
Average measured values for , , and as well as measured values for , , , , and of each frustule beam are given in Table S1. Average values of and taken from 50 measurements of the indentation sample are 0.17 µm and 1.19 µm, respectively. For these values, the average relative density of each frustule beam is calculated and given in Table S1. The average relative density as determined by Eq. S11 is 36.4%.
By taking advantage of the periodicity of the frustule we have been able to develop a general model, but the simplifying assumptions used could lead to a misrepresentation of the relative density of a beam sample. From SEM imaging it is seen that the pores in the cribrum layer are typically elliptic and vary in number per hexagonal cell and that foramen are not necessarily regularly spaced. Similarly, hexagonal areolae cells are irregular and the number of cell walls can vary from 5 to 6. To test the veracity of this general model, we used direct measurement of SEM images of each frustule beam to calculate , , , and .
Ellipses were manually fit to each cribrum pore in the beam and the area of each ellipse was summed to provide the pore area, . The inverse area is determined by subtracting the pore area from the rectangular area, . Multiplying by the depth gives the cribrum volume :
| [S12] |
A similar procedure was used to determine the volume of the basal layer, , by fitting circles to the inner diameter of each foramen:
| [S13] |
The difference in area between circles fit to the outer and inner diameter of each foramen provides the total projected area of the foramen rims, . Multiplying by the average thickness of the foramen rims gives the total rim volume, :
| [S14] |
Determination of is difficult because the areolae walls are obscured by the cribrum and basal layers. To provide an estimation of the location of areolae walls, we generated a Voronoi diagram using the centers of the foramen as the seeds of each cell and bounded by the dimensions of the beam. This method generates a remarkably good match when applied to the visible areolae walls in the indentation plate shown in Fig. 2E. could then be determined from the total length of the cell walls, multiplied by the average areolae wall thickness, t and depth of the areolae layer:
| [S15] |
The solid volume was determined using the average heights and depths of each beam:
| [S16] |
where and are the lengths of the cribrum and basal layers, respectively. These volumes were then directly substituted into Eq. S5 to provide the measured relative density. The volumes , , , , and and resulting relative densities are shown in Table S2. The average relative density as calculated from direct image measurements was 30.1%, showing decent similarity with the generalized model.
For analysis and discussion in this paper we use the relative density calculated from image measurements as it provides a direct value for each unique beam sample.
Acknowledgments
We thank the Kavli Nanoscience Institute at Caltech for the availability of cleanroom facilities, Carol Garland for assistance with TEM analysis, and David Z. Chen for assistance with in situ mechanical testing. We also thank Hilde Skogen Chatou at the Norwegian University of Science and Technology (NTNU) for aid in diatom preparation and the NTNU Nanolab for access to the focused ion beam. This work was supported by the Institute for Collaborative Biotechnologies through Grant W911NF-09-0001 from the US Army Research Office.
Footnotes
The authors declare no conflict of interest.
This article is a PNAS Direct Submission.
This article contains supporting information online at www.pnas.org/lookup/suppl/doi:10.1073/pnas.1519790113/-/DCSupplemental.
References
- 1.Finkel ZV, Kotrc B. Silica use through time: Macroevolutionary change in the morphology of the diatom fustule. Geomicrobiol J. 2010;27(6-7):596–608. [Google Scholar]
- 2.Pondaven P, et al. Grazing-induced changes in cell wall silicification in a marine diatom. Protist. 2007;158(1):21–28. doi: 10.1016/j.protis.2006.09.002. [DOI] [PubMed] [Google Scholar]
- 3.Schmid A-MM, Schulz D. Wall morphogenesis in diatoms: Deposition of silica by cytoplasmic vesicles. Protoplasma. 1979;100(3-4):267–288. [Google Scholar]
- 4.Stoermer EF, Julius ML. 2003. Centric diatoms. Freshwater Algae of North America: Ecology and Classification, eds Wehr JD, Sheath RG (Elsevier, San Diego), pp 559–594.
- 5.Werner D. The Biology of Diatoms. Blackwell; Oxford: 1977. [Google Scholar]
- 6.Almqvist N, et al. Micromechanical and structural properties of a pennate diatom investigated by atomic force microscopy. J Microsc. 2001;202(3):518–532. doi: 10.1046/j.1365-2818.2001.00887.x. [DOI] [PubMed] [Google Scholar]
- 7.Subhash G, Yao S, Bellinger B, Gretz MR. Investigation of mechanical properties of diatom frustules using nanoindentation. J Nanosci Nanotechnol. 2005;5(1):50–56. doi: 10.1166/jnn.2005.006. [DOI] [PubMed] [Google Scholar]
- 8.Hamm CE, et al. Architecture and material properties of diatom shells provide effective mechanical protection. Nature. 2003;421(6925):841–843. doi: 10.1038/nature01416. [DOI] [PubMed] [Google Scholar]
- 9.Losic D, Short K, Mitchell JG, Lal R, Voelcker NH. AFM nanoindentations of diatom biosilica surfaces. Langmuir. 2007;23(9):5014–5021. doi: 10.1021/la062666y. [DOI] [PubMed] [Google Scholar]
- 10.Bjørnøy SH. 2012. Nanomechanical testing of diatoms. Master thesis (Norwegian Univ of Science and Technology, Trondheim, Norway)
- 11.Vebner MJ. 2013 Nanomechanical testing of diatoms. Master thesis (Norwegian Univ of Science and Technology, Trondheim, Norway). Available at hdl.handle.net/11250/241821.
- 12.Kröger N, Deutzmann R, Bergsdorf C, Sumper M. Species-specific polyamines from diatoms control silica morphology. Proc Natl Acad Sci USA. 2000;97(26):14133–14138. doi: 10.1073/pnas.260496497. [DOI] [PMC free article] [PubMed] [Google Scholar]
- 13.Li C-W, Volcani BE. Aspects of silicification in wall morphogenesis of diatoms. Philos Trans R Soc B Biol Sci. 1984;304(1121):519–528. [Google Scholar]
- 14.Gordon R, Drum RW. The chemical basis of diatom morphogenesis. Int Rev Cytol. 1994;150:243–372. [Google Scholar]
- 15.Rogerson A, Defreitas ASW, Mcinnes AG. Observations on wall morphogenesis in Coscinodiscus asteromphalus (Bacillariophyceae) Trans Am Microsc Soc. 1986;105(1):59–67. [Google Scholar]
- 16.Schmid A-MM, Volcani BE. Wall morphogenesis in Coscinodiscus Wailesii Gran and Angst. I. Valve morphology and development of its architecture. J Phycol. 1983;19(4):387–402. [Google Scholar]
- 17.Hildebrand M, et al. Nanoscale control of silica morphology and three-dimensional structure during diatom cell wall formation. J Mater Res. 2011;21(10):2689–2698. [Google Scholar]
- 18.Iler RK. The Chemistry of Silica: Solubility, Polymerization, Colloid and Surface Properties and Biochemistry. Wiley; New York: 1979. [Google Scholar]
- 19.Swift DM, Wheeler AP. Evidence of an organic matrix from diatom biosilica. J Phycol. 1992;28(2):202–209. [Google Scholar]
- 20.Hench LL. Bioceramics. J Am Ceram Soc. 2005;81(7):1705–1728. [Google Scholar]
- 21.Meyers MA, Chen P-Y, Lin AY-M, Seki Y. Biological materials: Structure and mechanical properties. Prog Mater Sci. 2008;53(1):1–206. doi: 10.1016/j.jmbbm.2008.02.003. [DOI] [PubMed] [Google Scholar]
- 22.Wegst UGK, Ashby MF. The mechanical efficiency of natural materials. Philos Mag. 2004;84(21):2167–2186. [Google Scholar]
- 23.Vollrath F, Madsen B, Shao Z. The effect of spinning conditions on the mechanics of a spider’s dragline silk. Proc Biol Sci. 2001;268(1483):2339–2346. doi: 10.1098/rspb.2001.1590. [DOI] [PMC free article] [PubMed] [Google Scholar]
- 24.Brambilla G, Payne DN. The ultimate strength of glass silica nanowires. Nano Lett. 2009;9(2):831–835. doi: 10.1021/nl803581r. [DOI] [PubMed] [Google Scholar]
- 25.Sumper M, Kröger N. Silica formation in diatoms: The function of long-chain polyamines and silaffins. J Mater Chem. 2004;14(14):2059. [Google Scholar]
- 26.Poulsen N, Sumper M, Kröger N. Biosilica formation in diatoms: Characterization of native silaffin-2 and its role in silica morphogenesis. Proc Natl Acad Sci USA. 2003;100(21):12075–12080. doi: 10.1073/pnas.2035131100. [DOI] [PMC free article] [PubMed] [Google Scholar]
- 27.Bridoux MC, Annenkov VV, Keil RG, Ingalls AE. Widespread distribution and molecular diversity of diatom frustule bound aliphatic long chain polyamines (LCPAs) in marine sediments. Org Geochem. 2012;48:9–20. [Google Scholar]
- 28.Bridoux MC, Ingalls AE. Structural identification of long-chain polyamines associated with diatom biosilica in a Southern Ocean sediment core. Geochim Cosmochim Acta. 2010;74(14):4044–4057. [Google Scholar]
- 29.Pohnert G. Biomineralization in diatoms mediated through peptide- and polyamine-assisted condensation of silica. Angew Chem Int Ed Engl. 2002;41(17):3167–3169. doi: 10.1002/1521-3773(20020902)41:17<3167::AID-ANIE3167>3.0.CO;2-R. [DOI] [PubMed] [Google Scholar]
- 30.Oliver WC, Pharr GM. Measurement of hardness and elastic modulus by instrumented indentation: Advances in understanding and refinements to methodology. J Mater Res. 2011;19(1):3–20. [Google Scholar]
- 31.Craig RR. 2000. Mechanics of Materials (Wiley, New York), pp 338–447.
- 32.Zaykova-Feldman L, Moore T. The total release method for FIB in-situ TEM sample preparation. Microscopy and Microanalysis. 2005;11(S02):848–849. [Google Scholar]


