Abstract
Introduction:
Ground water is the ultimate and most suitable fresh water resource for human consumption in the urban areas of India. Studies regarding ground water quality have shown that the higher rate of exploration as compared to the rate of recharging, inappropriate dumping of solid, as well as liquid waste, lack of strict enforcement of law has led to the deterioration of ground water quality. The present study was thus, carried out to evaluate physicochemical, as well as a microbiological profile of tap water, and filtered water in urban areas of Patiala, Punjab.
Materials and Methods:
The three zones under Municipal Corporation and two areas under Public Health Department were chosen according to the simple random sampling from Patiala city. From each area, 10 houses were chosen according to the systematic random sampling technique (n = 50). Water was taken from two sources, tap water, and from the water filter. Two samples were taken from each source one for the physicochemical analysis and another for bacteriological analysis. The samples which were sent for bacteriological assessment were collected in a sterile container.
Results:
The number of water samples found to be within desirable limits with respect to physicochemical parameters were significantly more with the filter water sample than the tap water samples. Suspicious/unsatisfactory microbiological quality of water was observed in 28% and 4% of tap and filter water samples, respectively.
Conclusion:
The results indicate that certain chemical parameters such as hardness, chloride, and fluoride levels were beyond the permissible limits. Therefore, we recommend that home filters should be installed, serviced appropriately, and their water quality should be checked routinely. Also, any leak from sewage pipes should be promptly repaired to prevent contamination of drinking water.
Keywords: Coliform count, filter water, tap water, water quality
Introduction
Ground water is the ultimate and most suitable fresh water resource for human consumption in the urban areas of India. Groundwater is highly valued because of certain properties not possessed by surface water.[1] There are several states in India where more than 90% of the population is dependent on groundwater for drinking and other purposes.[2] Ground water can be tapped by several means, e.g. submersible pump, wells, and tube wells. In India, there are over 20 million people owned wells in addition to government tube wells.[3]
The wells are generally considered as the worst type of ground water source in terms of physiochemical contamination due to the lack of concrete plinth and surrounding drainage system.[4] Over burden of the population pressure, unplanned urbanization, unrestricted exploration policies, and dumping of the polluted water at the inappropriate place has led to infiltration of harmful compounds to the ground water.[5] Global environmental changes induced by natural variability and human activities influence both water quantity and quality at regional and local scales, as well as, at the global scale.[6] Urban growth, increased industrial activities, intensive farming, and overuse of fertilizers in agricultural production have been identified as culprits for these changes.[7]
Studies regarding ground water quality have shown that the high rate of exploration as compared to recharging, inappropriate dumping of solid as well as liquid waste, lack of strict enforcement of law has led to deterioration of ground water quality.[8,9,10,11,12] It is a well-known fact that potable safe water is absolutely essential for healthy living. The problem of drinking water contamination, water conservation, and water quality management has assumed a very complex shape. Attention on water contamination and its management has become the need of the hour because of far reaching impact on human health.[13]
The present study was thus carried out at the community level to evaluate physicochemical as well as a microbiological profile of tap water and filtered water in urban areas of Patiala, Punjab.
Materials and Methods
Patiala district is an administrative district in the state of Punjab, India. Total area under Patiala district is about 3175 km2 and has a population of 1,892,282. About 40.27% of those live in the urban area. As per provisional reports of Census India, the population of Patiala city in 2011 is 405,164. Patiala city is governed by Municipal Corporation. The city gets its drinking water supply from the underground sources. It is divided into 15 zones according to the water supply scheme of the municipal corporation [Figure 1]. Each zone has its own independent tube well network, and five areas are under Public Health Department. In this study, three zones under Municipal Corporation and two areas under Public Health Department were chosen according to the simple random sampling scheme. From each area, 10 houses were chosen according to the systematic random sampling technique. Net 50 houses were selected for taking water samples.
Figure 1.
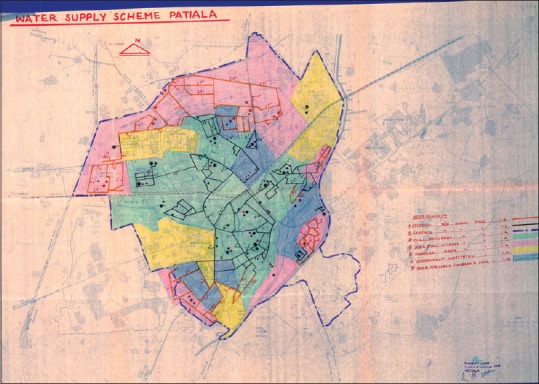
Map of the sampling area
Criteria for inclusion of the houses:
Houses which have installed the purifier for more than 1-year
Water purifier system should be either reverse osmosis [RO] or ultraviolet (UV) system or both.
This cross-sectional study was conducted over a period of 1-year, June 2011 to June 2012. In this study, water was taken from two sources tap and water filter. Two samples were taken from each source one sample for the physicochemical analysis and another for bacteriological analysis. A total of four samples was taken from each house making the total number of samples 200. For bacteriological assessment, two 200 ml sample were collected in 250 ml containers. The samples were sent for bacteriological assessment and were collected in a sterile container.
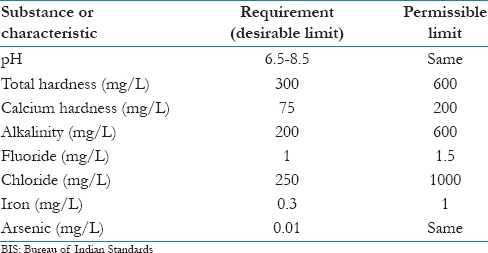
Water samples were taken from the tap which supplies water from the service pipe directly and not from a storage tank in the house. Tap water was allowed to run for 2–3 min before filling the container. Also, just before filling, the flow was reduced to prevent splashing when filling the bottle. Samples were sent within an hour to the Microbiology Department in Government Medical College, Patiala for microbiological analysis of water. Samples were held <10°C during transit to the lab, according to the sample collection, storage, and transport methods given in standard methods of examination of water, APHA, AWWA, WEF 1999. Microbiologically, water analysis was done by the multiple tube method.[14] Physicochemical properties (pH, alkalinity, total hardness, calcium hardness, chloride, fluoride, iron, and arsenic) were tested by using water testing kits from Nice Chemicals Private Limited (an ISO: 9001 Certified kits) and judged according to drinking water specifications, Bureau of Indian Standards (BIS) [Table 1]. Statistical analysis was done using Microsoft Excel 2007 and Epi Info version 7.1.4 (CDC Atlanta, USA) freely available at CDC website. Fisher exact test was applied, and P < 0.05 was considered significant.
Table 1.
Test characteristics for drinking water (BIS)
Results
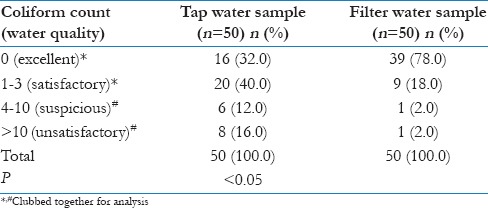
A number of water samples found to be within desirable limits with respect to physicochemical parameters were significantly more with filter water sample than tap water samples except for pH levels [Table 2]. In this study, 45 tap water samples and nine filter water samples showed pH values within the desirable limits according to BIS (6.5–8.5). 84% (42 samples) of the tap water samples and 94% (47 samples) of filtered water samples show alkalinity within desirable limits (200 mg/L). Only 6% and 2% of tap and filter water samples had moderately hard water as per WHO criteria (desirable). Forty-five tap water samples (90%) were found to be hard, and two of the tap water samples were found to be very hard out of the total 50 tap water samples. Also, 43 filter water samples (86%) were found to be soft [Table 3]. None of the tap water samples and 84% filter water samples showed calcium hardness within desirable limits according to BIS (<75 mg/L). Only 14% tap water samples showed chloride values within the desirable limits according to BIS (<250 mg/L). 82% tap water samples showed arsenic values within the desirable limits according to BIS (0.01 mg/L). All the filter water samples showed no traces of arsenic. Excellent microbiological quality of water (no coliforms) was observed in only one-third (16 samples, 32%) of tap water samples compared to three-fourth (39 samples, 78%) of filter water samples (P < 0.05). More than four coliforms were observed in 28% (14 tap water samples) and 4% (2 filter water samples), respectively [Table 4].
Table 2.
Water samples within desirable limits for physicochemical parameters (according to BIS)
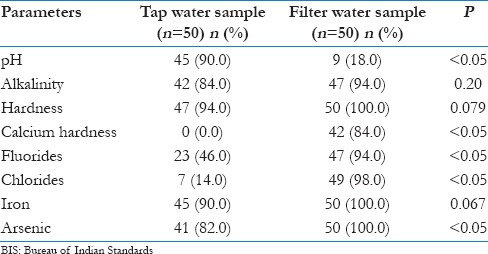
Table 3.
Hardness of water samples as per WHO standards
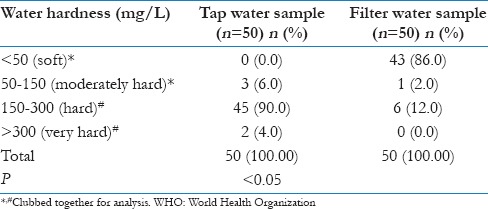
Table 4.
Microbiological quality of water samples
Discussion
Ninety percentage of the tap water samples showed pH within the desirable limits. Most of the filtered water samples (82%) showed pH lower than the desirable limits. This is supported by the fact that the filtration technology leads to the acidification of drinking water. Similar results showing pH value of neutral to slightly alkaline were reported by Mishra et al.,[15] Pandey and Tiwari,[16] Asadi et al.,[17] and Reza and Singh.[18] The alkalinity and hardness of most of the tap, as well as filtered water samples, were within desirable limits of the BIS. Similar results with alkalinity and hardness were shown in a study by Pandey and Tiwari.[16]
In the present study, 47 tap water samples and seven filter water samples showed hardness levels >150 mg/L (hard water) requiring treatment of water before drinking. These cases also report the history of signs and symptoms suggesting arthropathies, however, no correlation can be established taking only the drinking water in consideration. Also, it was seen that the 43 of the filter water samples have soft water quality. The soft water samples have been related to the increased risk of cardiovascular diseases.[19] The rest of the seven samples from the filter are those which are either never serviced after installation or they have only had UV filtration system installed (no RO or carbon filter).
The mean calcium hardness and fluoride level of the tap water were higher, whereas, that of the filtered water was within the desirable limit of BIS (227.0 vs. 57.6 mg/L; 1.3 vs. 0.46 mg/L). In a study by Pandey and Tiwari,[16] higher levels of calcium hardness of Ghazipur city have been reported similar to the results of this study. Also, in the present study, 16% of the filtered water samples show calcium hardness more than the desirable limits. These are mostly the UV Filters without activated carbon or the RO Filters which were not regularly serviced. In a study by Asadi et al.,[17] concentration of fluoride was observed to be more than 1.5 ppm near Jubilee hills, Sheik put, Erragadda and Sanathnagar, and concentration of fluoride at Yellareddyguda was observed to be 3.15 mg/L. This may be due to the fact that ground water in that area usually contains fluoride dissolved by geological formation and increased fluoride may be due to the result of industrial activities and weathering of fluorine bearing minerals such as fluoride and apatite.
Eight six percentage had chloride levels more than desirable limits. This may be due to the presence of decaying organic matter in the pipes supplying the drinking tap water. In studies by Sinha and Saxena,[20] Reza and Singh,[21] and Shantha Kumari et al.,[22] most of the collected water samples showed chloride within the desirable limits according to BIS.
In the present study, the mean value of arsenic in tap water was 0.1 ± 0.19 mg/L, which is higher than the desirable limit of arsenic according to BIS. Whereas there was no trace of arsenic in all the filter water samples. Similar results of having higher levels of arsenic in drinking water from the wells have been reported from a study by Zandsalimi et al.[23] Epidemiological studies show that arsenic exposure increases the mortality associated with bladder, kidney, lung, and skin cancers.[24] Arsenic exposure is also associated with greater mortalities from neoplasms of the nasal cavity, bone, liver, larynx, colon, stomach, and from lymphoma.[25]
In the present study, suspicious/unsatisfactory microbiological quality of water was observed in 28% and 4% of tap and filter water samples, respectively. The reason may be due to the inappropriate or lack of service of filters. The microbiological contamination may be due to the fact that the sewage pipes are laid over the pipes supplying tap water. Any leak from the sewage pipes can lead to contamination of drinking water. In a study by Rajendran et al.,[26] regarding the bacteriological analysis of water samples from the tsunami which hit the coastal areas of Kanyakumari district, Tamil Nadu showed contamination in 56 (37%) drinking water sources.
Conclusion
The results indicate that certain chemical parameters such as hardness, chloride, and fluoride were beyond the permissible limits in this area, which is densely residential. The overall view of the water quality of the present study zone showed an unsatisfactory result especially with respect to microbiological quality. Therefore, we recommend that home filters should be installed, serviced timely, properly, and their water quality should be checked routinely. Also, any leak from sewage pipes should be promptly repaired to prevent contamination of drinking water.
Financial support and sponsorship
Nil.
Conflicts of interest
There are no conflicts of interest.
References
- 1.Goel PK. Water Pollution: Causes, Effects and Control. Ch. 3. New Delhi: New Age International Publisher Limited; 2006. Structure, properties and uses of water; pp. 21–3. [Google Scholar]
- 2.Ramachandraiah C. Hyderabad, India: Hyderabad Working Papers, Centre for Economic and Social Studies; 2004. [Last cited on 2015 Jul 13]. Right to drinking water in India. Centre for Economic and Social Studies; p. 56. Available from: http://www.EconPapers.repec.org/RePEc: ind: cesswp: 56 . [Google Scholar]
- 3.Datta PS. Ground water ethics for its sustainability. Curr Sci. 2005;89:812–7. [Google Scholar]
- 4.2nd ed. Vol. 3. Geneva, Switzerland: Surveillance and Control of Community Supplies; 1997. [Last cited on 2015 July 08]. World Health Organization. Guidelines for Drinking Water Quality. Available from: http://www.who.int/water_sanitation_health/dwq/gdwqvol32ed.pdf . [Google Scholar]
- 5.Rao SM, Mamatha P. Water quality in sustainable water management. Curr Sci. 2004;87:942–7. [Google Scholar]
- 6.Chang H. Water quality impacts of climate and land use changes in Southeastern Pennsylvania. Prof Geogr. 2004;56:240–57. [Google Scholar]
- 7.Patwardhan A, Sahasrabuddhe K, Mahabaleshwarkar M, Joshi J, Kanade R, Goturkar S, et al. Changing status of urban water bodies and associated health concerns in Pune, India. In Proceedings of the Third International Conference on Environment and Health, 15-17 December; Chennai, India. Chennai; Department of Geography, University of Madras and Faculty of Environmental Studies, York University. 2003:339–45. [Google Scholar]
- 8.Gupta BK, Gupta RR. Physio-chemical and biological study of drinking water in Satna, Madhya Pradesh. Pollut Res. 1999;18:523–5. [Google Scholar]
- 9.Pandian RK, Banu MG, Kumar G, Smila KH. Physico-chemical characteristics of drinking water in selected areas of Namakkal town (Tamil Nadu), India. Indian J Environ Prot. 2005;10:789–92. [Google Scholar]
- 10.Rajan MR, Paneerselvam I. Evaluation of drinking water quality in Dindigul city, Tamil Nadu. Indian J Environ Ecoplan. 2005;10:771–6. [Google Scholar]
- 11.Thakare SB, Parvate AV, Rao M. Analysis of fluoride in the ground water of Akola district. Indian J Environ Ecoplan. 2005;10:657–61. [Google Scholar]
- 12.Bisht S, Patra BA, Gupta NC, Arora S, Singh RA. Assessment of Drinking Water Quality of Delhi, India. In: Proceedings of 12th ISMAS Symposium Cum Workshop on Mass Spectrometry; March, 25-30; Cidade de Goa, Dona Paula, Goa. 2007 [Google Scholar]
- 13.Sinha DK, Srivastava AK. Physicochemical characteristics of River Sai at Rae Bareli. Indian J Environ Health. 1995;37:205–10. [Google Scholar]
- 14.Senior BW. General methods. Examination of water, milk, food, and air. In: Colle JG, Fraser AG, Marmion BP, Simmons A, editors. Mackie and McCartney. Practical Medical Microbiology. 14th ed. Ch. 51. Sec. G. New Delhi: Churchill Livingstone, Elsevier; 2007. p. 885. [Google Scholar]
- 15.Mishra D, Mudgal M, Khan MA, Padmakaran P, Chakradhar B. Assessment of ground water quality of Bhavnagar region (Gujrat) J Sci Ind Res. 2009;68:964–6. [Google Scholar]
- 16.Pandey KS, Tiwari S. Physico-chemical analysis of ground water of selected area of Ghazipur city – A case study. Nat Sci. 2008;6:25–8. [Google Scholar]
- 17.Asadi SS, Vuppala P, Reddy MA. Remote sensing and GIS techniques for evaluation of groundwater quality in municipal corporation of Hyderabad (Zone-V), India. Int J Environ Res Public Health. 2007;4:45–52. doi: 10.3390/ijerph2007010008. [DOI] [PMC free article] [PubMed] [Google Scholar]
- 18.Reza R, Singh G. Physicochemical analysis of ground water in Angul Talcher region of Orrisa, India. J Am Sci. 2009;5:53–8. [Google Scholar]
- 19.Park K. Park's Textbook of Preventive and Social Medicine. 23rd ed. Ch. 12. Jabalpur, Madhya Pradesh, India: Banarsidas Bhanot Publishers; 2015. Environment and health. Topic: Hardness of water; p. 727. [Google Scholar]
- 20.Sinha DK, Saxena R. Statistical assessment of underground drinking water contamination and effect of monsoon at Hasanpur, J. P. Nagar (Uttar Pradesh, India) J Environ Sci Eng. 2006;48:157–64. [PubMed] [Google Scholar]
- 21.Reza R, Singh G. Heavy metal contamination and its indexing approach for river water. Int J Environ Sci Technol. 2010;7:785–92. [Google Scholar]
- 22.Shantha Kumari D, Srinivasalu S, Subramanian S. Fluoride contaminated water and its implications on human health in Vellore District, Tamil Nadu, India. Res J Environ Toxicol. 2007;1:16–26. [Google Scholar]
- 23.Zandsalimi S, Karimi N, Kohandel A. Arsenic in soil, vegetation and water of a contaminated region. Int J Environ Sci Technol. 2011;8:331–8. [Google Scholar]
- 24.Chiou HY, Chiou ST, Hsu YH, Chou YL, Tseng CH, Wei ML, et al. Incidence of transitional cell carcinoma and arsenic in drinking water: A follow-up study of 8,102 residents in an arseniasis-endemic area in Northeastern Taiwan. Am J Epidemiol. 2001;153:411–8. doi: 10.1093/aje/153.5.411. [DOI] [PubMed] [Google Scholar]
- 25.Tsai SM, Wang TN, Ko YC. Mortality for certain diseases in areas with high levels of arsenic in drinking water. Arch Environ Health. 1999;54:186–93. doi: 10.1080/00039899909602258. [DOI] [PubMed] [Google Scholar]
- 26.Rajendran P, Murugan S, Raju S, Sundararaj T, Kanthesh BM, Reddy EV. Bacteriological analysis of water samples from tsunami hit coastal areas of Kanyakumari district, Tamil Nadu. Indian J Med Microbiol. 2006;24:114–6. doi: 10.4103/0255-0857.25188. [DOI] [PubMed] [Google Scholar]


