

Abstract
Calcium [Ca(II)] is a fundamental transducer of electrical activity in the central nervous system (CNS). Influx of Ca(II) into the cytosol is responsible for action potential initiation and propagation, and initiates interneuronal communication via release of neurotransmitters and activation of gene expression. Despite the importance of Ca(II) in physiology, it remains a challenge to visualize Ca(II) flux in the central nervous system (CNS) in vivo. To address these challenges, we have developed a new generation, Ca(II)-activated MRI contrast agent that utilizes ethyl esters to increase cell labeling and prevent extracellular divalent Ca(II) binding. Following labeling, the ethyl esters can be cleaved, thus allowing the agent to bind Ca(II), increasing relaxivity and resulting in enhanced positive MR image contrast. The ability of this probe to discriminate between extra- and intracellular Ca(II) may allow for spatiotemporal in vivo imaging of Ca(II) flux during seizures or ischemia where large Ca(II) fluxes (1–10 μM) can result in cell death.
Graphical Abstract
INTRODUCTION
Gradients and fluctuations in Ca(II) concentration play critical roles in virtually all cellular events including membrane potential maintenance, action potential propagation, signal transduction cascades, and apoptosis.1–4 In the central nervous system (CNS), Ca(II) flux is critical to neuronal function where aberrant fluctuations of intracellular Ca(II) cause a number of pathologies affecting brain activity resulting in seizures, ischemia, and hypoglycemia.1,5–10
The pivotal role of Ca(II) flux in physiology has led to the development of Ca(II) sensitive imaging techniques to investigate the fundamental mechanisms of this important cation. The most common technique for Ca(II) visualization has been the use of optical imaging which relies on the use of Ca(II)-sensitive fluorescent dyes.11–13 The major challenge for optical techniques is limited penetration depth (~5–10 mm) due to light scattering and tissue absorption. As a result, noninvasive in vivo longitudinal studies using optical techniques such as bioluminescence and two-photon confocal microscopy of Ca(II) flux are challenging.11 More recent methods have combined electrophysiology or fiberoptic Ca(II) imaging with MRI to record neural activity with Ca(II) flux simultaneously but are technically challenging and have limited clinical potential.14 Additionally, the acquired data is in the form of maps that are not in real time and are fundamentally static representations of dynamic activity.
An alternative Ca(II) imaging strategy has been the use of blood-oxygen-level-dependent (BOLD) contrast generated in functional magnetic resonance imaging (fMRI).15–19 While fMRI is not limited by tissue depth, the alterations in BOLD contrast used to measure brain activity are not necessarily Ca(II) flux and are indirect, as they arise from changes in cerebral blood flow, blood volume, and oxygenation.17,18 Although optical imaging and BOLD fMRI approaches have yielded insights regarding Ca(II) signaling, transport, and trafficking, these techniques are unable to provide high-resolution, real-time in vivo imaging of Ca(II) flux. In order to overcome the limitations, an alternative in vivo imaging strategy is required to visualize in vivo Ca(II) flux.
Contrast-enhanced magnetic resonance imaging (MRI) is an attractive alternative to both optical imaging and BOLD fMRI due to its unlimited penetration depth, soft-tissue contrast, high-resolution tomographic (3D) information, and the ability to provide anatomical and physiological information about surrounding tissues.20 In order to visualize Ca(II) via contrast-enhanced MR imaging we developed bioactivated contrast agents that are conditionally activated by the presence of Ca(II).21,22 Since these initial studies, several agents have been prepared that detect Ca(II) by a similar mechanism.23–27 However, these agents are either confined to the extracellular space or cannot discern between intra- and extracellular Ca(II) limiting their effectiveness to report on intracellular Ca(II) flux.
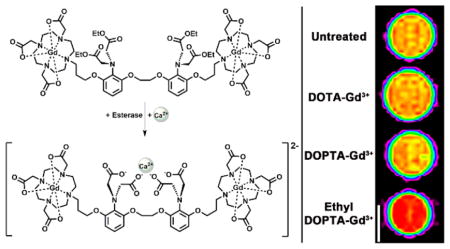
Our work has focused on conjugating two paramagnetic Gd(III) complexes (1,4,7,10-tetraazacycloddodecane-1,4,7,10-tetraacetic acid, Gd(III)-DOTA) to the well-known Ca(II) chelator 1,2-bis(O-aminophenoxy) ethane-N,N,N′,N′-tetraacetic acid (BAPTA). Complex 2 [DOPTA-Gd(III)] relies on the four carboxylates of the BAPTA domain to block water coordination to the Gd(III) ions (q) in the absence of Ca(II) (low relaxivity or “off” state). In the presence of 1–100 μM Ca(II), the four carboxylates of BAPTA preferentially bind Ca(II) allowing water access to the Gd(III) ions. and resulting in an 80% increase in T1 relaxivity allowing Ca(II) fluctuations to be visualized via small molecule contrast-enhanced MR imaging. However, while the relaxivity enhancement of complex 2 (Figure 1) is adequate to detect Ca(II) binding at low concentrations (~10 μM), the overall negative charge of the complex could limit cell permeability. Further, complex 2 is not capable of distinguishing intracellular versus extracellular Ca(II) (1–2 mM) in vivo.
Figure 1.

Schematic of complex 1 activation after ethyl ester hydrolysis and subsequent Ca(II) binding. Esterases cleave the ethyl esters on the BAPTA moiety unmasking four carboxylates that coordinate to the metal center blocking water access to the macrocyclic chelates maintaining the agent in a low relaxivity state. In the presence of Ca(II) a conformational change occurs whereby the free carboxylates bind Ca(II) providing water access to the Gd(III) centers, thereby increasing contrast agent relaxivity. Complex 3 was used in a parallel experiment as a control.
To overcome these limitations we have designed and synthesized complex 1 [DOPTA-Ethyl-Gd(III)] where the negatively charged imino acetates of BAPTA are protected via esterification (Figure 1).28–30 The addition of the esters to the BAPTA ligand address the two issues cited above simultaneously: (i) increases the lipophilicity and cell permeability of the agent and, more importantly, (ii) prevents extracellular Ca(II) binding maintaining the contrast agent in a low relaxivity (“off”) state prior to cell internalization. Upon cell uptake, endogenous cytosolic esterases cleave the esters of complex 1 deprotecting the aromatic imino acetates (resulting in complex 2) and allowing intracellular Ca(II) binding with a concomitant increase in relaxivity (Figure 1).
RESULTS AND DISCUSSION
Synthesis
Complex 1 was synthesized in five steps according to modified literature procedures31 using 1,2-bis(o-aminophenoxy)-ethane-N,N,N′,N′-tetraacetic acid (BAPTA) as a Ca(II)-binding domain due to its 105-fold selectivity for Ca(II) over other divalent metal cations such as Mg(II) and protons.14,21,22,32 The intermediate diol, 4, was brominated to the dibromide 5 using bromine and triphenylphosphine. Attachment of the 2,2′,2″-(1,4,7,10-tetraazacyclododecane-1,4,7-triyl triacetate (DO3A) was accomplished using excess tris-t-butyl-DO3A in order to minimize the formation of the monoalkylated product. The cyclen imino tris-t-butyl acetates as part of 6 were selectively hydrolyzed with excess formic acid at 50 °C (the aromatic imino ethyl diacetates on the BAPTA ligand remain). Metalation using GdCl3 was performed under weakly acidic conditions (pH = 5.5), and after purification by semipreparative HPLC, the final product 1 was isolated (Figure 2).
Figure 2.

Synthetic scheme of DOPTA-Ethyl-Gd(III). (a) Br2, PPh3, TEA, DCM, 60%. (b) Tris-t-butyl-DO3A, K2CO3, MeCN, 65%. (c) Formic acid, 55 °C. (d) GdCl3, NaOH, pH 5–6, 44%.
The design of the agent incorporates a propyl linker to couple the aromatic iminoacetates of BAPTA to the macrocycle. We have designed the linker to maximize acetate back-binding (after ester cleavage) to Gd(III) when the Ca(II) concentration is low (<1 μM). As a result, the relaxivity of the complex is minimized. An internal rearrangement allows water to bind to Gd(III) when the Ca(II) concentration is between 5 and 10 μM. Utilizing the stable ethyl bromoacetates in place of acetoxymethyl esters reduced synthetic challenges while decreasing the rate of ethyl ester hydrolysis and as a result minimized cleavage by extracellular esterases.
Effect of Ester Hydrolysis and Ca(II) Binding on Relaxivity
Ethyl ester hydrolysis of 1 was investigated using HPLC-MS equipped with an evaporative light scattering detector (ELSD) to monitor the reaction with porcine esterase.28,30,33–35 The kinetics of ester hydrolysis were determined by following the disappearance of the HPLC peak of 1 postincubation with porcine esterase at 37 °C in HEPES buffer at pH 7.4 (Figure 3 and Supporting Information Figure 6). After 50 h, 92.4% of 1 was hydrolyzed resulting in a rate constant of 1.69 × 10⁻⁵ s−1 (kobs, 37°C). By employing pseudo first-order kinetics this result corresponds to an 11.4 h half-life.
Figure 3.

Plot of ethyl ester hydrolysis of 1 by porcine esterase at 37 °C (in pH 7.4 HEPES buffer) monitored by HPLC-MS using an evaporative light scattering detector (ELSD). Individual data points represent the integration of the HPLC-MS peak of 1 after exposure to porcine esterase divided by the HPLC-MS peak of 1 prior to porcine esterase exposure (multiplied by 100 to give percent complex hydrolysis). The line corresponds to a pseudo first-order kinetic fit of the data with an 11.4 h half-life for 1.
Relaxivities (r1) of 1, 2, and 1,4,7,10-tetraazacyclododecane-N,N′,N″,N‴-tetraacetic acid, 3 [DOTA-Gd(III)] were measured. The r1 of 1, 2, and 3 were 10.6 mM−1 s−1, 7.4 mM−1 s−1, and 3.1 mM−1 s−1, respectively, prior to activation and Ca(II) binding (Table 1). Following ester hydrolysis (in pH 7.4 HEPES buffer and 37°C for 24 h), the r1 of 1 is 7.6 mM−1 s−1 in the absence of Ca(II) and reaches a maximum of 12.6 mM−1 s−1 in the presence of 1 mM Ca(II) with a dynamic relaxivity range between 1 and 100 μM Ca(II) (Table 1, Figure 4). To confirm that ester hydrolysis of 1 produces the same relaxivity changes as 2, this complex was independently synthesized and the r1 measured in the presence of increasing Ca(II) concentration. The increase in r1 upon ester hydrolysis and subsequent Ca(II) binding to 1 is 66%, while the increase in r1 of 2 post Ca(II) binding is 64% suggesting the product of the ester hydrolysis of 1 is complex 2 (Figure 4). Additionally, these same relaxivity samples were then run on a 7 T imaging spectrometer to determine high field relaxivity. As shown in Supporting Information Figure 10 the high field relaxivity of 2 is 6.21 mM−1 s−1 and of 1 is 9.14 mM−1 s−1. This is very promising since the relaxivity decrease due to increased field strength is less than 20% for both molecules.
Table 1.
Relaxivity, Octanol–Water Partition Coefficients, and Hydration Numbers of Complexes 1, 2, and 3
| log P | −Ca(II)
|
+ 1 mM Ca(II)
|
+ esterase +1 mM Ca(II)
|
||||
|---|---|---|---|---|---|---|---|
| r1 (mM−1 s−1) | q | r1 (mM−1 s−1) | q | r1 (mM−1 s−1 | q | ||
| 1 | −2.44 | 10.6 ± 0.3 | 0.5 ± 0.1 | 10.2 ± 0.2 | 0.5 ± 0.1 | 12.6 ± 0.3 | 0.9 ± 0.1 |
| 2 | −3.69 | 7.4 ± 0.2 | 0.3 ± 0.1 | 12.5 ± 0.4 | 1.0 ± 0.1 | - | - |
| 3 | −3.42 | 3.1 ± 0.3 | 1 ± 0.1 | 3.1 ± 0.2 | - | - | - |
Figure 4.

Relaxivity (r1, mM−1s−1) changes of complex 1 (after ethyl ester hydrolysis via porcine esterase) and 2 upon addition of Ca(II) at 1.41 T and 37 °C (in pH 7.4 0.1 M HEPES buffer with 0.1 M KCl and 1% DMSO). Both synthesized 2 and ester hydrolyzed 1 show a >64% change in r1 upon Ca(II) binding. Lines represent nonlinear sigmoidal dose–response fits to the data. EC50 value for compound 1 is 16.6 μM Ca2+ and for compound 2 is 11.5 μM Ca2+.
To determine q of 1, fluorescence lifetime of the Tb(III) analog (1b) was measured in D2O and H2O. Tb(III) was chosen over Eu(III) due to its increased luminescence and longer luminescent lifetime in both H2O and D2O.36–38 The difference in luminescence lifetimes in H2O versus D2O reflects the number of inner-sphere water molecules, q, and can be calculated using Equation 1.38
| (1) |
The fluorescence lifetimes of the complexes were measured and fit to an exponential curve with observed decay times of 1.41 and 2.42 ms in H2O and D2O, respectively, where q is 0.5 for 1b and 0.3 for 2b (per metal). This result indicates that the ethyl esters of 1b prevent water from coordinating to Gd(III) as efficiently as the acetates of 2b. Furthermore, q was measured for 1b and 2b after the addition of porcine esterase and Ca(II) to determine whether the changes in the relaxivities of the complexes are due to changes in the inner-sphere water coordination of the Gd(III) chelates. As shown in Table 1, q for 2b increases from 0.3 to 1 in the presence of 1 mM Ca(II), whereas q for 1c (prior to ester hydrolysis) remains constant at 0.5 even in the presence of 1 mM Ca(II). This data shows the ethyl ester protected iminoacetates likely do not participate in Ca(II) binding prior to enzymatic hydrolysis. Following hydrolysis, the q value of 1 increases from 0.5 to 0.9 confirming that the ester hydrolysis of 1 results in 2.
To investigate whether changes in low field relaxivity can be visualized via high field MRI (7 T, 300 MHz), phantoms of a 100 μM solution of 2 [200 μM Gd(III)] were prepared with different stoichiometric concentrations of CaCl2 with concentrations of 100, 50, 25, 12.5, and 6.25, and 0 μM Ca(II) (Figure 5). There is a 32% decrease in T1 from 0 μM Ca(II) to 100 μM Ca(II) which is visible via high field MRI. Additionally, Ca(II) concentrations as low as 6.25 μM produce a T1 decrease of at least 10% which is required to visualize large Ca(II) fluxes of approximately 10 μM.
Figure 5.

MR images and T1 analysis of 100 μM solution phantoms of 2 binding with increasing amounts of Ca(II) corresponding to 100, 50, 25, 12.5, and 6.25 μM Ca(II) at 7 T and 25 °C. Scale bar (white) represents 1 mm. T1 values are calculated as the average of 5, 1 mm slices ± 1 standard deviation. %T1 decrease is calculated versus the 0 μM Ca(II) sample.
In Vitro Cellular Uptake and Retention
The previous data showed that Ca(II) can only bind to complex 1 following ester hydrolysis resulting in its detectable form (complex 2) which can then bind Ca(II) (5–10 μM) leading to a decrease in T1 providing positive MR image contrast. This provides a novel bioactivated probe for determining intracellular Ca(II) fluxes but requires cellular uptake of the contrast agent. One factor that has been used to predict the ability of a molecule or drug to diffuse into biomembranes is lipophilicity where a balance in amphilicity is desired for ease of aqueous administration and cell uptake.39,40 In order to determine the lipophilicity of Ca(II)-sensitive MRI contrast agents, octanol–water partition coefficients (log P) were determined for each complex where 1 was 1 order of magnitude more hydrophobic than 2 (−2.44 versus −3.69) which should lead to an increase in cell uptake.41,42
To determine the cell labeling properties of 1, 2, and 3, a hippocampal neuronal cell line (HT-22 cells were chosen as they have frequently been used to investigate neuronal activity).43,44 Concentration-dependent uptake of 1, 2, and 3 was determined by incubating HT-22 cells with 31.25, 62.5, and 125 μM of the complexes for 48 h. After incubation, cells were washed, trypsinized, counted, and digested with nitric acid. Gd(III) content was measured using ICP-MS of the acid-digested samples (Figure 6A, Supporting Information Table 1). As shown, cellular labeling is concentration dependent and directly correlated to the octanol–water partition coefficients of the complexes where the more hydrophobic 1 exhibited higher uptake than 2 at incubation concentrations of 125 μM. At lower incubation concentrations, uptake of 1 and 2 was the same.
Figure 6.

Concentration-dependent (A), time-dependent (B), and cellular retention studies (C) of 1, 2, and 3 in the hippocampal neuronal cell line, HT-22. Cellular uptake of 1 was significantly higher than that of 2 and 3. A small amount of contrast agent (<7%) leached out of the cells in 24 h. All samples were washed 3× with DPBS, trypsinized, counted, and digested in nitric acid to determine Gd(III) content via ICP-MS. Data are mean ± standard deviation of triplicate runs.
To determine the time-dependent cell labeling, HT-22 cells were incubated with 125 μM of the complexes for 1, 4, 8, 24 h. After incubation, cells were washed, trypsinized, counted, and digested with nitric acid. Finally, Gd(III) content was measured using ICP-MS of the acid-digested samples. As shown in Figure 6B (and Supporting Information Table 2) maximum Gd(III) labeling occurs after a 4 or 8 h incubation followed by a significant decrease after 24 h.
To elucidate the relationship between cellular labeling and cellular retention HT-22 cells were incubated with 125 μM of each complex for 2 h. After incubation, cells were washed with DPBS (2×) followed by the addition of fresh media. Cells were allowed to efflux (leach) for various time points (0, 1, 2, 3, 4, and 24 h) in fresh media followed by media removal, cell washing with DPBS (2×), cell harvesting, and Gd(III) determination via ICP-MS. At each time point cell samples were counted and analyzed by ICP-MS.
Figure 6C shows that, despite multiple washes, greater than 90% of the Gd(III) is retained. The cells treated with 1 lost ~5% more of the agent compared to cells treated with the other two agents. However, because the cellular uptake of 1 is more than 200% higher than complex 2 (and more than 500% higher than complex 3), the overall amount of cell associated 1 remains higher than that of 2 and 3 prior to and after leaching. The absolute quantities were divided by their respective initial concentrations (those collected at time = 0) in order to quantify the relative amount of cellular retention for each agent.
To determine whether the cell labeling and molecular relaxivity of 1 and 2 leads to detectable image contrast, HT-22 cells were treated with 125 μM of 1, 2, and 3 complexes for 4 h and centrifuged into capillaries (~1.0 mm diameter) prior to MR imaging. The greyscale and color intensity MR images of the cell pellets show increases in image intensity for cells treated with 1 or 2 compared with cells treated with 3 or untreated cells where the contrast to noise ratio (CNR) between 1 and 3 is 11 (Figure 7A). Lastly, The amount of Gd(III) per cell was determined by ICP-MS for each cell pellet, and as expected, T1 was found to be inversely proportional to Gd(III) content (Figure 7B).
Figure 7.

(A) T1-weighted MR image with corresponding image-intensity color map of HT-22 cells incubated with 1, 2, and 3 and media alone for 4 h (scale bar = 1 mm). 9.4 T (400 MHz) and 25 °C. (B) Calculated values corresponding to the MR image in (A). Values represent the average of four 1 mm slices and the error is plus or minus one standard deviation of the mean.
The findings from these in vitro studies show that 1 labels cells up to 2-fold more efficiently than 2 or 3, which is directly correlated to the octanol–water partition coefficients. The results are in agreement with our hypothesis that esterification enhances lipophilicity and consequently cell labeling.
CONCLUSION
We have synthesized a cell-permeable version of a previously reported Ca(II)-sensitive MRI contrast agent, 1, for visualizing intracellular Ca(II) signaling. By incorporating ethyl esters in the BAPTA binding ligand the charge of the complex is neutralized resulting in increased lipophilicity and concurrent cellular labeling. In addition, the ethyl esters maintain the contrast agent in a low relaxivity or “off” state until ethyl ester hydrolysis resulting in the active form, 2, which is capable of binding Ca(II) producing a high relaxivity or “on” state. This probe design will allow for the discrimination between extra- and intracellular Ca(II) by MR imaging and thereby providing the ability to monitor intracellular Ca(II) signaling.
MATERIALS AND METHODS
General Methods
Unless otherwise noted, materials and solvents were purchased from Sigma-Aldrich Chemical Co. (St. Louis, MO) and used without further purification. Common precursor 4 (2-{2-[3-(3-hydroxypropoxy)-2-di-(ethoxycarbonylmethyl)aminophenoxy]ethoxy}-6-(3-hydroxypropoxy)- N,N-di(ethoxycarbonylmethyl)benzenamine), tris-t-butyl- DO3A (Tris-tert-butyl 2,2′,2″-(1,4,7,10-tetraazacyclododecane-1,4,7-triyl) triacetate) were prepared according to literature procedures.3e,20 Unless noted, all reactions were performed under a nitrogen or argon atmosphere. Acetonitrile was purified using a Glass Contour Solvent system (Pure Process Technology, Nashua, NH, USA). Deionized water (18.2 MΩ·cm) was obtained from a Millipore Q-Guard System (Billerica, MA). Thin-layer chromatography (TLC) was performed on EMD 60 F254 silica gel plates. Standard grade 60 Å 230–400 mesh silica gel (Sorbent Technologies, Norcross, GA, USA) was used for flash column chromatography. 1H and 13C NMR spectra were obtained on a Bruker 500 MHz Avance III NMR spectrometer (Bruker Biospin, Billerica, MA, USA) or a Varian Inova 400 MHz NMR spectrometer (Agilent Technologies, Santa Clara, CA, USA) with deuterated solvents as noted. Electrospray ionization mass spectrometry (ESI-MS) was carried out using a Varian 1200L single-quadrupole mass spectrometer (Agilent Technologies, Santa Clara, CA, USA). Matrix-assisted laser desorption ionization time-of-flight mass spectra (MALDI-TOF-MS) were recorded on a Bruker AutFlex III (Bruker, Billerica, MA, USA), using 2,5-dihydroxybenzoic acid as the matrix. Analytical reverse-phase HPLC-MS was performed on a Varian Prostar 500 system (Agilent Technologies, Santa Clara, CA, USA) using either a Waters (Milford, MA, USA) Atlantis C18 column (4.6 × 250, 5 μm) or an XBridge C18 column (4.6 × 150, 5 μm). This system is equipped with a Varian 380 LC ELSD system, a Varian 363 fluorescence detector, a Varian 335 UVvis detector, and a Varian 1200L quadrupole MS detector (Agilent Technologies, Santa Clara, CA, USA). Preparative runs were performed on a Waters (Milford, MA, USA) Atlantis C18 column (19 × 250, 10 μm). The mobile phase consisted of water or water with NH3·H2O (pH = 10.4) (solvent A) and HPLC-grade acetonitrile (solvent B).
2-{2-[3-(3-Bromopropoxy)-2-di(ethoxycarbonylmethyl)-aminophenoxy]ethoxy}-6-(3-bromopropoxy)-N,N-di- (ethoxycarbonylmethyl)benzenamine, 5
0.37 mL of TEA (2.66 mmol) was added via syringe to 0.70 g of triphenylphosphine (2.66 mmol) dissolved in 10 mL of dry dichloromethane at 0 °C. 0.14 mL of bromine (2.66 mmol), diluted in 15 mL of dry dichloromethane, was added to the reaction mixture. Stirring was continued at 0 °C for 30 min. 0.89 g of compound 4 (1.21 mmol), in 10 mL of dichloromethane, was added via syringe and the reaction mixture was stirred at room temperature. Absence of starting material was confirmed by TLC after 24 h. The crude material was purified by flash column chromatography over silica gel with hexanes:ethyl acetate (3:1) to afford a yellow oil (0.63g, 60%, Rf = 0.45). 1H NMR (500 MHz, CDCl3): δ 6.93 (t, 2H, J = 8.3 Hz), 6.60 (d, 2H, J = 8.2 Hz), 6.56 (d, 2H, J = 8.2 Hz), 4.30 (s, 4H), 4.09 (t, 4H, J = 5.8 Hz), 4.08 (s, 8H), 4.05 (q, 8H, J = 7.15 Hz), 3.63 (t, 4H, J = 6.5 Hz), 2.30 (m, 4H), 1.16 (t, 12H, J = 7.15 Hz); 13C-{H} NMR (126 MHz, CDCl3): δ 172.2, 154.2, 128.3, 123.6, 106.9, 106.7, 67.5, 66.5, 60.2, 53.9, 32.5, 30.4, 14.2.
2-{ 2-[3-(3-(Tris-t-butyl-DO3A) propoxy)-2-di-(ethoxycarbonylmethyl)aminophenoxy] ethoxy}-6-(3-(tris-tbutyl- DO3A)propoxy)-N,N-di(ethoxycarbonylmethyl) benzenamine, DOPTA-Ethyl, 6
131 mg (0.26 mmol) of tris-t-butyl-DO3A in 50 mL of acetonitrile and 49.7 mg (0.36 mmol) of K2CO3 was added to a 100 mL round-bottom flask. The mixture was sealed, stirred, and placed under nitrogen atmosphere for 30 min before 100 mg (0.12 mmol) of 5 in 10 mL of acetonitrile was added. The mixture was heated to 75 °C and stirred for 48 h. The reaction was monitored by mass spectrometry to follow the disappearance of the starting materials. The reaction was filtered and evaporated to yield a yellow oil. The crude material was purified by flash column chromatography over silica gel with dichloromethane:methanol (50:1) to afford a yellow oil (135 mg, 65% Rf = 0.90). 1H NMR (400 MHz, DMSO-d6, 70 °C): δ 6.92 (2H, br), 6.64 (4H, br), 4.28 (s, 4H), 3.97 (m, 20H), 3.67–1.79 (m, 52H), 1.43 (s, 54H), 1.11 (t, 12H, J = 6.92 Hz); MALDI-MS m/z observed: 1730.33, calculated: 1730.17 [M + H]+.
2-{2-[3-(3-(4,7,10-Tris(carboxymethyl)-1,4,7,10-tetraazacyclododecyl)propoxy)-2-di(ethoxycarbonylmethyl)-aminophenoxy]ethoxy}-6-(3-(4,7,10-tris(carboxymethyl)-1,4,7,10-tetraazacyclododecyl)propoxy)-N,N-di-(ethoxycarbonylmethyl) benzenamine-gadolinium(III), DOPTA-Ethyl-Gd(III), 1
200 mg (0.12 mmol) of compound 6 was dissolved in 50 mL of formic acid and heated to 55 °C for 18 h. After formic acid was evaporated on a rotary evaporator, the resulting oil was redissolved in methanol 3 × 10 mL and evaporated again to remove most of the formic acid. The resulting glassy solid 7 was dissolved in 20 mL of water and the pH of the solution was adjusted to 5. 107 mg (0.28 mmol) of GdCl3·6H2O was added and the pH of the reaction was adjusted back to 6 every 4–6 h until no further change occurred. (Typically the reaction was completed in 1–2 days.) The reaction was evaporated and purified by reverse-phase HPLC according to method 1, retention time of 44.5 min, and 99% purity, followed by lyophilization to yield 87 mg of 1 as a white powder in 44%. MALDI-TOF-MS m/z observed: 1703.2 (M + H+) calcd for C64H94Gd2N10O24 1702.0.
The terbium(III) analog of 1 was prepared in a similar manner for luminescence lifetime measurements. HPLC and MALDI-TOF-MS were used to determine the purity. DOPTAEthyl-Tb(III), retention time: 47.0 min, yield: 42%, m/z observed: 1705.1, calcd for C64H94Yb2N10O24 1705.3.
Relaxation Time Measurements
1 was dissolved in 500 μL of filtered, 0.1 M HEPES, 0.1 M KCl containing 1% DMSO for T1 acquisition. Relaxation times were measured on a Bruker mq60 NMR analyzer equipped with Minispec v 2.51 Rev.00/NT software (Bruker Biospin, Billerica, MA, USA) operating at 1.41 T (60 MHz), and 37 °C T1 relaxation times were measured using an inversion recovery pulse sequence (T1_ir_mb) using the following parameters: 4 scans per point, 10 data points for fitting, monoexponential curve fitting, phase cycling, 10 ms first pulse separation, and a recycle delay and final pulse separation ≥5 T1. The Gd(III) concentrations of each solution were determined using ICP-MS. The relaxivity r1 was calculated from Equation 2. The inverse of the longitudinal relaxation time (1/T1, s−1) was plotted against Gd(III) concentration (mM) and fitted to a straight line with an R2 > 0.99. The slope of the fitted line was recorded as the relaxivity, r1.
| (2) |
Octanol–Water Partition Coefficients
0.5 mg samples of 1, 2, and 3 were dissolved in 1 mL of a 1:1 mixture of water:1- octanol. After shaking for 30 s, tubes containing the mixtures were placed on a rotator for gentle mixing to equilibrate for 48 h. After mixing, samples were allowed to settle at room temperature for 24 h. Gd(III) concentrations of each layer were determined by ICP-MS. Partition coefficients were calculated from the Equation log P = log(Co/Cw), where log P is the logarithm of the partition coefficient, Co is the concentration of Gd in the 1-octanol layer, and Cw is the concentration of Gd in the water layer.
Luminescence Lifetime Measurements of 1C
The luminescence lifetime of a 1 mM solution of 1c was measured in H2O and D2O on a Hitachi (San Francisco, CA) F4500 fluorometer, using a λex = 232 nm and λem = 544 nm. Twenty-five scans were acquired, averaged, and fit to a monoexponential decay function.
Kinetics of Ethyl Ester Hydrolysis
Porcine liver esterase was diluted 10 times with 0.1 M HEPES, 0.1 M KCl, and 1% DMSO buffer and used to hydrolyze 1. The solution of 1 was prepared by dissolving the agent in in the aforementioned buffer to give a final concentration of 1 mM. 10 U/mL of porcine esterase was added to the solution and was maintained at 37 °C. 200 μL aliquots of the reaction were taken at different time points for 72 h and centrifuged at 4000 rpm for 5 min and filtered through a microporous (0.2 μm) membrane filter. The filtrate was analyzed by HPLC-MS with an evaporative light scattering detector (ELSD). Pseudo-first-order rate constants for enzymatic hydrolysis were determined based on the equation y = A0 × e−x/t (where A0 = 1 and t−1= kobs), using Origin 7 (OriginLab, Northampton, MA).
General Cell Culture
Dulbecco’s modified phosphate buffered saline (DPBS), media, and TrypLE were purchased from Invitrogen (Carlsbad, CA). Serum is from VWR (Corning, Mediatech). Cell culture consumables (flasks, plates, etc.) were purchased from VWR (Radnor, PA). Charcoal dextran stripped FBS was purchased from Atlanta Biologicals (Lawrenceville, GA). The HT-22 hippocampal neuronal cell line obtained from Professor Schubert at Salt Institute (La Jolla, CA) and were cultured using phenol red free DMEM supplemented with 10% FBS. Experiments and incubations were done in a 5.0% CO2 incubator at 37 °C unless otherwise noted. Cells were harvested by incubation with 0.25% TrypLE for 10 min at 37 °C in a 5.0% CO2 incubator.
Cellular Uptake Studies Concentration-Dependent Uptake
Cell studies were performed to determine the ability of 1, 2, and 3 to label cells. HT-22 hippocampal neuronal cells were grown to 60% confluence in a 24 well cell culture plate at 350 μL per well. Media was then replaced with media containing 1% DMSO and increasing concentrations (31.25 μM, 62.5 μM, and 125 μM) of the three agents in duplicate. The plate was incubated for 48 h and washed three times with sterile phosphate buffered saline. Each sample was then trypsinized and tested for cell count and viability on a Guava PCA system using the Guava viacount protocol according to the manufacturer’s instructions. The remaining volume in each sample was dissolved in concentrated nitric acid and diluted for analysis by ICP-MS to determine the amount of Gd(III) associated with the cells. Viability analysis revealed no change in viability of treated cells.
Time-Dependent Uptake
The cells were prepared in a similar fashion to previous assays. HT-22 hippocampal neuronal cells were grown to 60% confluence and incubated with 125 μM of the three agents for 1, 4, 8, and 24 h in duplicate. After incubation, the medium was removed, and the cells were rinsed three times with DPBS. These cells were trypsinized, counted, and analyzed for Gd(III) content using Guava EasyCyte Mini PCA System and ICP-MS.
Cellular Retention Studies
The cells were prepared in a similar fashion to previous assays. HT-22 hippocampal neuronal cells were grown to 60% confluence and incubated with 125 μM of the three agents for 2 h. After incubation, the cells were washed with DPBS (time = 0, initial amount), placed in fresh media, and allowed to leach for 0, 1, 2, 3, 4, and 24 h. After each time point, cells were harvested, counted, and analyzed for Gd(III) content by ICP-MS.
Cell Counting Using a Guava EasyCyte Mini Personal Cell Analyzer (PCA) System
After cell harvesting, an aliquot of the cell suspensions was mixed with Guava ViaCount reagent and allowed to stain at room temperature for at least 5 min (no longer than 20 min). Stained samples were vortexed for 10 s and percent cell viability was determined via manual analysis using a Guava EasyCyte Mini Personal Cell Analyzer (PCA) and ViaCount software module. For each sample, 1000 events were acquired with dilution factors that were determined based upon optimum machine performance (~25–100 cells/μL). Instrument reproducibility was assessed daily using Guava-Check Beads and following the manufacturer’s suggested protocol using the Daily Check software module.
MR Imaging and T1 Analysis of Cell Pellets at 9.4 T
9.4 T MR imaging and T1 measurements were performed on a Bruker Biospec 9.4 T imaging spectrometer fitted with shielded gradient coils at 25 °C. For cell pellet images, ~2.0 × 10⁶ HT-22 cells were incubated in 25 cm2 T-flasks with 125 μM of 1, 2, and 3 for 4 h. The cells were rinsed with DPBS (3 × 5 mL/flask), and harvested with 500 μL of a 0.25 vol % trypLE Express solution. After addition of 500 μL of the appropriate fresh media (1.0 mL total volume/flask), cells were transferred to 1.5 mL microcentrifuge tubes and centrifuged at 200 g for 5 min. The supernatant was removed, and cell pellets were resuspended in 1 mL of complete media, added to 5 3/4″ flame-sealed Pasteur pipets, and centrifuged at 200 g and 4.0 °C for 5 min. The bottom sections of the flame-sealed pipets were scored with a glass scribe, broken into small capillaries, and imaged using a RF RES 400 1H 089/038 quadrature transmit receive 23 mm volume coil (Bruker BioSpin, Billerica, MA, USA).
Spin–lattice relaxation times (T1) were measured using a rapid-acquisition rapid-echo (RARE-VTR) T1-map pulse sequence, with static TE (10 ms) and variable TR (100, 200, 400, 500, 750, 1000, 2500, 5000, 7500, and 10000 ms) values. Imaging parameters were as follows: field of view (FOV) = 25 × 25 mm2, matrix size (MTX) = 256 × 256, number of axial slices = 3, slice thickness (SI) = 1.0 mm, and averages (NEX) = 4 (total scan time = 2 h 58 min). T1 analysis was carried out using the image sequence analysis tool in Paravision 5.0 pl3 software (Bruker, Billerica, MA, USA) with monoexponential curve-fitting of image intensities of selected regions of interest (ROIs) for each axial slice.
Quantification of Gd(III) with Inductively Coupled Plasma Mass Spectrometry
Quantification of Gd(III) was accomplished using ICP-MS of acid digested samples. Specifically, solution samples were digested in ACS reagent grade nitric acid (70%, Sigma, St. Louis, MO, USA) and incubated in a water bath at 70 °C for at least 2 h to allow for complete sample digestion. A portion of the digested sample was added to a 15 mL conical tube along with 5 ng/mL of multielement internal standard containing Bi, Ho, In, Li, Sc, Tb, and Y (Inorganic Ventures, Christiansburg, VA, USA) in filtered, deionized H2O (18.2 MΩ·cm). Instrument calibration was accomplished by preparing individual-element Gd standard (Inorganic Ventures, Christiansburg, VA, USA) using concentrations of 1.000, 5.000, 10.00, 20.00, 50.00, 100.0, and 200.0 ng/mL containing 3.0% nitric acid (v/v) and 5.0 ng/mL of multielement internal standard.
ICP-MS was performed on a computer-controlled (Plasma-lab software) Thermo X series II ICP-MS (Thermo Fisher Scientific, Waltham, MA, USA) operating in standard mode equipped with an ESI SC-2 autosampler (Omaha, NE, USA). Each sample was acquired using 1 survey run (10 sweeps) and 3 main (peak jumping) runs (100 sweeps). The isotopes selected for analysis were 157,158Gd with 115In and 165Ho isotopes selected as internal standards for data interpolation. Instrument performance is optimized daily by an autotune followed by verification via a performance report (passing manufacturer specifications). Addition of all reagents for all samples and standards were weighed using a Mettler Toledo (Columbus, OH, USA) XS205 DeltaRange analytical microbalance (with 0.01 mg resolution for up to 81 g of sample).
Supplementary Material
Acknowledgments
This work was supported by the National Institutes of Health grants R01EB005866 and R01EB014806 as well as a CBC Spark Award S-003 and National Science Foundation Graduate Research Fellowship (C.E.C.). A portion of this work was completed at the Northwestern University Integrated Molecular Structure Education and Research Center. Imaging was performed at the Northwestern University Center for Advanced Molecular Imaging generously supported by NCI CCSG P30 CA060553 awarded to the Robert H. Lurie Comprehensive Cancer Center. MRI was performed on the 7 T Bruker Pharmscan system purchased with the support of NCRR 1S10RR025624-01. Metal analysis was performed at the Northwestern University Quantitative Bioelement Imaging Center generously supported by NASA Ames Research Center NNA06CB93G.
Footnotes
Notes
The authors declare no competing financial interest.
The Supporting Information is available free of charge on the ACS Publications website at DOI: 10.1021/acs.bioconjchem. 5b00561. NMR spectra, HPLC and MALDI-TOF, cellular uptake data, relaxivity measurements, and cytotoxiticy (PDF)
References
- 1.Berridge MJ. Neuronal calcium signaling. Neuron. 1998;21:13–26. doi: 10.1016/s0896-6273(00)80510-3. [DOI] [PubMed] [Google Scholar]
- 2.Bading H. Nuclear calcium signalling in the regulation of brain function. Nat Rev Neurosci. 2013;14:593–608. doi: 10.1038/nrn3531. [DOI] [PubMed] [Google Scholar]
- 3.Bean BP. The action potential in mammalian central neurons. Nat Rev Neurosci. 2007;8:451–465. doi: 10.1038/nrn2148. [DOI] [PubMed] [Google Scholar]
- 4.Clapham DE. Calcium signaling. Cell. 2007;131:1047–1058. doi: 10.1016/j.cell.2007.11.028. [DOI] [PubMed] [Google Scholar]
- 5.Charles A. Intercellular calcium waves in glia. Glia. 1998;24:39–49. doi: 10.1002/(sici)1098-1136(199809)24:1<39::aid-glia5>3.0.co;2-w. [DOI] [PubMed] [Google Scholar]
- 6.Meldolesi J. Calcium signalling: oscillation, activation, expression. Nature. 1998;392:863–866. doi: 10.1038/31804. [DOI] [PubMed] [Google Scholar]
- 7.Somjen GG. Ions in the brain: normal function, seizures, and stroke. Oxford University Press; USA: 2004. [Google Scholar]
- 8.Massimini M, Amzica F. Extracellular calcium fluctuations and intracellular potentials in the cortex during the slow sleep oscillation. J Neurophysiol. 2001;85:1346–1350. doi: 10.1152/jn.2001.85.3.1346. [DOI] [PubMed] [Google Scholar]
- 9.Silver IA, Erecińska M. Intracellular and extracellular changes of [Ca2+] in hypoxia and ischemia in rat brain in vivo. J Gen Physiol. 1990;95:837–866. doi: 10.1085/jgp.95.5.837. [DOI] [PMC free article] [PubMed] [Google Scholar]
- 10.Waters J, Larkum M, Sakmann B, Helmchen F. Supralinear Ca2+ influx into dendritic tufts of layer 2/3 neocortical pyramidal neurons in vitro and in vivo. J Neurosci. 2003;23:8558–8567. doi: 10.1523/JNEUROSCI.23-24-08558.2003. [DOI] [PMC free article] [PubMed] [Google Scholar]
- 11.Grienberger C, Konnerth A. Imaging calcium in neurons. Neuron. 2012;73:862–885. doi: 10.1016/j.neuron.2012.02.011. [DOI] [PubMed] [Google Scholar]
- 12.Thestrup T, Litzlbauer J, Bartholomäus I, Mues M, Russo L, Dana H, Kovalchuk Y, Liang Y, Kalamakis G, Laukat Y. Optimized ratiometric calcium sensors for functional in vivo imaging of neurons and T lymphocytes. Nat Methods. 2014;11:175–182. doi: 10.1038/nmeth.2773. [DOI] [PubMed] [Google Scholar]
- 13.Egawa T, Hanaoka K, Koide Y, Ujita S, Takahashi N, Ikegaya Y, Matsuki N, Terai T, Ueno T, Komatsu T. Development of a far-red to near-infrared fluorescence probe for calcium ion and its application to multicolor neuronal imaging. J Am Chem Soc. 2011;133:14157–14159. doi: 10.1021/ja205809h. [DOI] [PubMed] [Google Scholar]
- 14.Schulz K, Sydekum E, Krueppel R, Engelbrecht CJ, Schlegel F, Schröter A, Rudin M, Helmchen F. Simultaneous BOLD fMRI and fiber-optic calcium recording in rat neocortex. Nat Methods. 2012;9:597–602. doi: 10.1038/nmeth.2013. [DOI] [PubMed] [Google Scholar]
- 15.Logothetis NK. What we can do and what we cannot do with fMRI. Nature. 2008;453:869–878. doi: 10.1038/nature06976. [DOI] [PubMed] [Google Scholar]
- 16.Logothetis NK, Pauls J, Augath M, Trinath T, Oeltermann A. Neurophysiological investigation of the basis of the fMRI signal. Nature. 2001;412:150–157. doi: 10.1038/35084005. [DOI] [PubMed] [Google Scholar]
- 17.Logothetis NK, Wandell BA. Interpreting the BOLD signal. Annu Rev Physiol. 2004;66:735–769. doi: 10.1146/annurev.physiol.66.082602.092845. [DOI] [PubMed] [Google Scholar]
- 18.Heeger DJ, Ress D. What does fMRI tell us about neuronal activity? Nat Rev Neurosci. 2002;3:142–151. doi: 10.1038/nrn730. [DOI] [PubMed] [Google Scholar]
- 19.Stephan KE, Weiskopf N, Drysdale PM, Robinson PA, Friston KJ. Comparing hemodynamic models with DCM. NeuroImage. 2007;38:387–401. doi: 10.1016/j.neuroimage.2007.07.040. [DOI] [PMC free article] [PubMed] [Google Scholar]
- 20.Heffern MC, Matosziuk LM, Meade TJ. Lanthanide probes for bioresponsive imaging. Chem Rev. 2014;114:4496–4539. doi: 10.1021/cr400477t. [DOI] [PMC free article] [PubMed] [Google Scholar]
- 21.Li W-h, Fraser SE, Meade TJ. A calciumsensitive magnetic resonance imaging contrast agent. J Am Chem Soc. 1999;121:1413–1414. [Google Scholar]
- 22.Li W-h, Parigi G, Fragai M, Luchinat C, Meade TJ. Mechanistic studies of a calcium-dependent MRI contrast agent. Inorg Chem. 2002;41:4018–4024. doi: 10.1021/ic0200390. [DOI] [PubMed] [Google Scholar]
- 23.Angelovski G, Fouskova P, Mamedov I, Canals S, Toth E, Logothetis NK. Smart magnetic resonance imaging agents that sense extracellular calcium fluctuations. ChemBioChem. 2008;9:1729–1734. doi: 10.1002/cbic.200800165. [DOI] [PubMed] [Google Scholar]
- 24.Angelovski G, Gottschalk S, Milošević M, Engelmann Jr, Hagberg GE, Kadjane P, Andjus P, Logothetis NK. Investigation of a Calcium-Responsive Contrast Agent in Cellular Model Systems: Feasibility for Use as a Smart Molecular Probe in Functional MRI. ACS Chem Neurosci. 2014;5:360–369. doi: 10.1021/cn500049n. [DOI] [PMC free article] [PubMed] [Google Scholar]
- 25.Atanasijevic T, Shusteff M, Fam P, Jasanoff A. Calcium-sensitive MRI contrast agents based on superparamagnetic iron oxide nanoparticles and calmodulin. Proc Natl Acad Sci U S A. 2006;103:14707–14712. doi: 10.1073/pnas.0606749103. [DOI] [PMC free article] [PubMed] [Google Scholar]
- 26.Hagberg GE, Mamedov I, Power A, Beyerlein M, Merkle H, Kiselev VG, Dhingra K, Kubìček V, Angelovski G, Logothetis NK. Diffusion properties of conventional and calcium - sensitive MRI contrast agents in the rat cerebral cortex. Contrast Media Mol Imaging. 2014;9:71–82. doi: 10.1002/cmmi.1535. [DOI] [PubMed] [Google Scholar]
- 27.Verma KD, Forgács A, Uh H, Beyerlein M, Maier ME, Petoud S, Botta M, Logothetis NK. New Calcium - Selective Smart Contrast Agents for Magnetic Resonance Imaging. Chem - Eur J. 2013;19:18011–18026. doi: 10.1002/chem.201300169. [DOI] [PubMed] [Google Scholar]
- 28.Giardiello M, Lowe MP, Botta M. An esteraseactivated magnetic resonance contrast agent. Chem Commun. 2007:4044–4046. doi: 10.1039/b711989e. [DOI] [PubMed] [Google Scholar]
- 29.Li W-h, Llopis J, Whitney M, Zlokarnik G, Tsien RY. Cell-permeant caged InsP3 ester shows that Ca2+ spike frequency can optimize gene expression. Nature. 1998;392:936–941. doi: 10.1038/31965. [DOI] [PubMed] [Google Scholar]
- 30.Woodroofe CC, Won AC, Lippard SJ. Esterase-activated two-fluorophore system for ratiometric sensing of biological zinc (II) Inorg Chem. 2005;44:3112–3120. doi: 10.1021/ic048789s. [DOI] [PubMed] [Google Scholar]
- 31.Kadjane P, Logothetis NK, Angelovski G. A straightforward and convenient pathway for the synthesis of functional bismacrocyclic ligands. Tetrahedron Lett. 2011;52:1619–1622. [Google Scholar]
- 32.Grynkiewicz G, Poenie M, Tsien RY. A new generation of Ca2+ indicators with greatly improved fluorescence properties. J Biol Chem. 1985;260:3440–3450. [PubMed] [Google Scholar]
- 33.Bonina FP, Arenare L, Palagiano F, Saija A, Nava F, Trombetta D, Caprariis PD. Synthesis, stability, and pharmacological evaluation of nipecotic acid prodrugs. J Pharm Sci. 1999;88:561–567. doi: 10.1021/js980302n. [DOI] [PubMed] [Google Scholar]
- 34.Palagiano F, Arenare L, Barbato F, La Rotonda MI, Quaglia F, Bonina FP, Montenegro L, de Caprarüs P. In vitro and in vivo evaluation of terpenoid esters of indomethacin as dermal prodrugs. Int J Pharm. 1997;149:171–182. [Google Scholar]
- 35.Woodroofe CC, Lippard SJ. A novel two-fluorophore approach to ratiometric sensing of Zn2+ J Am Chem Soc. 2003;125:11458–11459. doi: 10.1021/ja0364930. [DOI] [PubMed] [Google Scholar]
- 36.Batsanov A, Dickins R, Foster C, Howard JK, Moloney J, Norman T. Nuclear magnetic resonance, luminescence and structural studies of lanthanide complexes with octadentate macrocyclic ligands bearing benzylphosphinate groups. Dalton Trans. 1997:3623–3636. [Google Scholar]
- 37.Horrocks WD, Jr, Sudnick DR. Lanthanide ion luminescence probes of the structure of biological macromolecules. Acc Chem Res. 1981;14:384–392. [Google Scholar]
- 38.Supkowski RM, Horrocks WD., Jr On the determination of the number of water molecules, q, coordinated to europium(III) ions in solution from luminescence decay lifetimes. Inorg Chim Acta. 2002;340:44–48. [Google Scholar]
- 39.Leo A, Hansch C, Elkins D. Partition coefficients and their uses. Chem Rev. 1971;71:525–616. [Google Scholar]
- 40.Sangster J, editor. Wiley Series in Solution Chemistry. Vol. 2. John Wiley & Sons; Chichester: 1997. Octanol-water partition coefficients: Fundamentals and physical chemistry. [Google Scholar]
- 41.Núñez FAA, Yalkowsky SH. Correlation between log P and ClogP for some steroids. J Pharm Sci. 1997;86:1187–1189. doi: 10.1021/js970050a. [DOI] [PubMed] [Google Scholar]
- 42.Sukerkar PA, MacRenaris KW, Meade TJ, Burdette JE. A steroid-conjugated magnetic resonance probe enhances contrast in progesterone receptor expressing organs and tumors in vivo. Mol Pharmaceutics. 2011;8:1390–1400. doi: 10.1021/mp200219e. [DOI] [PMC free article] [PubMed] [Google Scholar]
- 43.Brimson JM, Tencomnao T. Rhinacanthus nasutus protects cultured neuronal cells against hypoxia induced cell death. Molecules. 2011;16:6322–6338. doi: 10.3390/molecules16086322. [DOI] [PMC free article] [PubMed] [Google Scholar]
- 44.Gursoy E, Cardounel A, Al-khlaiwi T, Al-drees A, Kalimi M. Tamoxifen protects clonal mouse hippocampal (HT-22) cells against neurotoxins-induced cell death. Neurochem Int. 2002;40:405–412. doi: 10.1016/s0197-0186(01)00105-x. [DOI] [PubMed] [Google Scholar]
Associated Data
This section collects any data citations, data availability statements, or supplementary materials included in this article.