Abstract
The electrodynamic ion funnel facilitates efficient focusing and transfer of charged particles in the higher-pressure regions (e.g., ion source interfaces) of mass spectrometers, thus providing increased sensitivity. An “off-axis” ion funnel design has been developed to reduce the source contamination and interferences from, e.g. ESI droplet residue and other poorly focused neutral or charged particles with very high mass-to-charge ratios. In this study, a dual ion funnel interface consisting of an orthogonal higher pressure electrodynamic ion funnel (HPIF) and an ion funnel trap combined with a triple quadrupole mass spectrometer was developed and characterized. An orthogonal ion injection inlet and a repeller plate electrode was used to direct ions to an ion funnel HPIF at a pressure of 9–10 Torr. Key factors for the HPIF performance characterized included the effects of RF amplitude, the DC gradient, and operating pressure. Compared to the triple quadrupole standard interface more than 4-fold improvement in the limit of detection for the direct quantitative MS analysis of low abundance peptides was observed. The sensitivity enhancement in liquid chromatography selected reaction monitoring (LC-SRM) analyses of low-abundance peptides spiked into a highly complex mixture was also compared with that obtained using both a commercial S-lens interface and an in-line dual-ion funnel interface.
The sensitivity of measurements using liquid chromatography with electrospray ionization tandem mass spectrometry (LC/ESI/MS/MS) is significantly dependent on the overall ion utilization efficiency,1,2 including both the effectiveness of the ionization processes and the efficiency of ion transmission from the source to the detector. The ESI efficiency for producing gas-phase ions is related to the solvent evaporation, as well as repeated droplet fission3 that can take place at atmospheric pressure but also in the lower-pressure regions, introducing both thermodynamic and kinetic constraints upon ion production.2,3
Numerous approaches and interface designs for intermediate-pressure ion sampling and transmission devices4–7 have been developed to enhance ion transfer from subambient pressure regions to the vacuum required for mass spectrometry (MS). The electrodynamic ion funnel has been shown to be broadly effective for the capture and focus of ions over a wide pressure range (from <0.1 Torr to >30 Torr).5,8,9 Ion funnel designs generally utilize a stack of ring electrodes with gradually decreasing inner diameters. Ions traveling through the ion funnel are confined due to the radio frequency (RF) potentials of 180° phase-shifted on adjacent electrodes, typically in conjunction with an auxiliary direct current (DC) field to drive ions through the ion funnel5,6 to focus ions though a conductance limit to the subsequent stages of the mass spectrometer. While ion funnels effectively transfer ions through subambient pressure regions, they also have a modest focusing effect for larger particles and droplets, especially if entrained in a strong axial gas flow. The mixture of the ions and neutrals (e.g., from an electrosprayed solution) in a high collision rate environment can lead to additional gas-phase chemistry that can impact measurements (e.g., by proton transfer), as well as performance degradation due to the deposition on downstream ion optics. Problems become more pronounced as ions are more effectively transferred from ESI sources through multiple inlets in order to increase measurement sensitivity.10,11 Thus, the primary objectives of “off-axis” ion introduction are (i) to reduce the interface and related ion optics contamination, and (ii) to decrease detector noise from excited and fast neutrals or very high m/z particles.12 The charged particles originating from the shrinking droplets are influenced by both gas dynamics and electric fields. Off-axis source concepts have been implemented, e.g., using ion funnels,13,14 S-lens,15,16 conjoined ion guides,17,18 and bent RF-only quadrupole ion guides at intermediate pressure regions.12,19 The separation of the ions and neutrals within these devices can be facilitated by additional off-axis electrodes to obstruct neutral species and to produce fields that divert ions away from any directed gas flow.
In the present study, we introduce an orthogonal ion funnelion funnel trap configuration on a triple quadrupole (QqQ) MS to improve robustness, in conjunction with sensitivity. In comparison to conventional off-axis interfaces, incomplete desolvated droplets are unlikely to reach the exit orifice by the orthogonal ion funnel. While ions are sharply turned by 90° away from the direction of gas flow, the large acceptance area provided by the ion funnel maximizes the ion transmission efficiency. The reduced directed gas flow from the source and effective elimination of neutral particles can significantly improve both system robustness and detector signal-to-noise ratios. In this work, the characterization of the orthogonal ion funnel in a triple quadrupole MS was evaluated and improved limits of detection (LODs) in both single-stage MS and liquid chromatography selected reaction monitoring (LC-SRM) modes were achieved.
INSTRUMENTATION
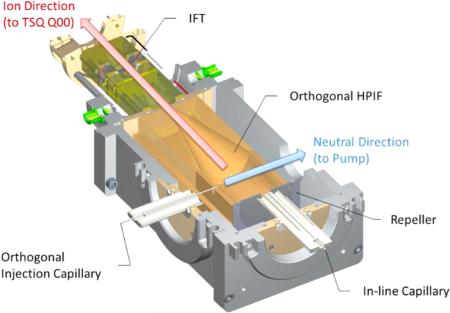
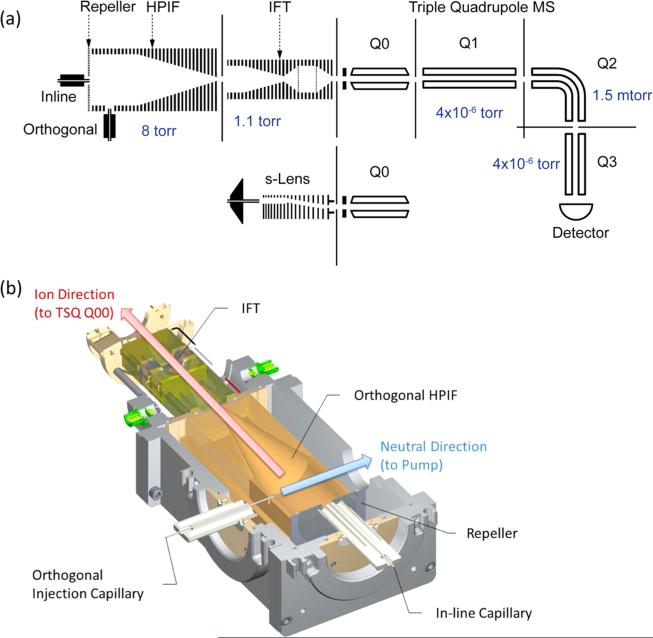
The dual-stage ion funnel interface used in this work consists of a high-pressure ion funnel (HPIF) and an ion funnel trap (IFT),20,21 as shown schematically in Figure 1a. Ions generated at atmospheric pressure were introduced through either an inline injection capillary (10 mm offset from the instrument centerline) or an orthogonal injection capillary. Following the HPIF is an IFT that can either trap or continuously transmit ions to the ion optics of the next stage. For the experiments presented in this manuscript, the IFT was operated in the continuous (nontrapping) mode (i.e., functioning as a conventional ion funnel). As shown in Figure 1b, a mechanical pump connected to the HPIF chamber pumps out neutral species through an exhaust port and aligned with the expanding gas and charged particles from the injection capillary. Stainless steel capillaries with 1 mm inner diameter (i.d.) and 10 cm long for both interfaces were chosen to increase the number of ions in conjunction with the HPIF chamber. The pressures of HPIF and IFT chambers were in the range of 8–10 Torr and ~1 Torr, respectively, and a 2.5 mm i.d. conductance limit orifice followed the IFT, allowing efficient optimal transmission to the triple quadrupole MS (TSQ Vantage, Thermo Fisher Scientific, San Jose, CA). The HPIF incorporated a repeller electrode that aided in directing ions toward the IFT that incorporated a stack of 46 tin-coated copper ring electrodes with 50.8 mm i.d. (i.e., the HPIF straight section in Figure 1), followed by a stack of 72 ring electrodes transitioning from an initial i.d. of 50.8 mm and decreasing gradually to a final electrode i.d. of 2.5 mm (i.e., the HPIF converging section). An RF waveform of equal amplitude but opposite phase was applied to adjacent ring electrodes, in conjunction with a DC gradient to drive ion motion through the interface.
Figure 1.
(a) Schematic diagram of the triple quadrupole MS with the standard source (S-lens), orthogonal and in-line high-pressure ion funnel and ion funnel trap, and the ion optical configuration for the each segment along HPIF and IFT. (b) Section view of the orthogonal injection HPIF-IFT atmospheric pressure interface. Inlet capillaries of 1 mm i.d. are used for in-line and orthogonal injection.
EXPERIMENTAL SECTION
Chemicals and Materials
For the initial tuning of the instrument, the triple quadrupole calibration stock solution (25 μM polytyrosine-1,3,6 in 1:1 water/methanol that contained 0.1% formic acid, Thermo Scientific Pierce, Rockford, IL) was used to optimize the DC gradient and RF amplitude applied to the HPIF and IFT. For quantitative analysis experiments, samples with different concentrations were prepared, including (i) the mixture of nine peptides (see Table S1 in the Supporting Information), purchased from Sigma–Aldrich (St. Louis, MO), was prepared at concentrations from 6 pmol/μL to 400 nmol/μL in an electrospray solution of 1:1 water/methanol that contained 0.1% acetic acid by volume, and (ii) synthetic peptides (Thermo Scientific, San Jose, CA) labeled with 13C/15N on C-terminal lysine and arginine residues for the four target proteins (bovine carbonic anhydrase, bovine β-lactoglobulin, Escherichia coli β-galactosidase, and prostate-specific antigen). Heavy peptides were estimated to be >95% pure, were spiked into a tryptic digest of Shewanella oneidensis strain MR-1 to final concentrations ranging from 1 fmol/μL to 7.8 amol/μL. Detailed information on the target peptides is given in Table S3 in the Supporting Information.
LC-SRM Analysis
The prepared solution was analyzed with a nanoAcquity UPLC system (Waters Corporation, Milford, MA) equipped with one analytical capillary column, 100 μm i.d. × 100 mm with a 1.7 μm C18 (stationary phase, BEH130, Waters Corporation, Milford, MA), and an autosampler. Solvents used in the UPLC system consisted of 0.1% formic acid in water (mobile phase A) and 0.1% formic acid in 90% acetonitrile (mobile phase B). Two microliters (2 μL) of the solution for each concentration were loaded into the analytical column, at a flow rate of 300 nL/min. The LC-SRM separation used a binary gradient of 10–15% B in 4.5 min, 15–25% B in 17 min, 25–38.5% B in 11 min, 38.5–95% B in 1 min, and 95% B for 4 min.
Nano-ESI Source
A chemically etched emitter,22 of 20 μm i.d., was directly connected to a 75 μm i.d. capillary (Polymicro Technologies, Phoenix, AZ) for the MS analysis or to a LC analytical column through a zero volume stainless steel union (Valco Instrument Co., Inc., Houston, TX) for LC-SRM analysis. For the MS analysis, sample solutions were directly infused using a syringe pump (Thermo Scientific, San Jose, CA).
Data Analysis
MS and MS2 data acquired using the TSQ Vantage were analyzed using an in-house-developed data extraction program. The most abundant peaks (MS) or the three most abundant transitions (MS2) for each peptide (Tables S1 and S3 in the Supporting Information) were used for quantification analyses. In the MS quantitation, the LOD was defined as the lowest concentration point of target proteins at which the signal-to-noise ratio (S/N) of surrogate peptides was >3 in a mass range of ±2 Da for the target peptides. In the LC-SRM quantitation, the tandem MS data from TSQ Vantage were analyzed using Skyline23 software to produce the peak area of extracted ion chromatograms (XICs) from multiple transitions monitored for target peptides. The S/N for LC-SRM measurements were calculated by the peak apex intensity over the highest background noise in a retention time region of ±30 s for each target peptide. All data were processed by the program automatically and were later manually inspected to ensure correct peak detection and accurate integration.
RESULTS AND DISCUSSION
Characterization of the Orthogonal Injection HPIF
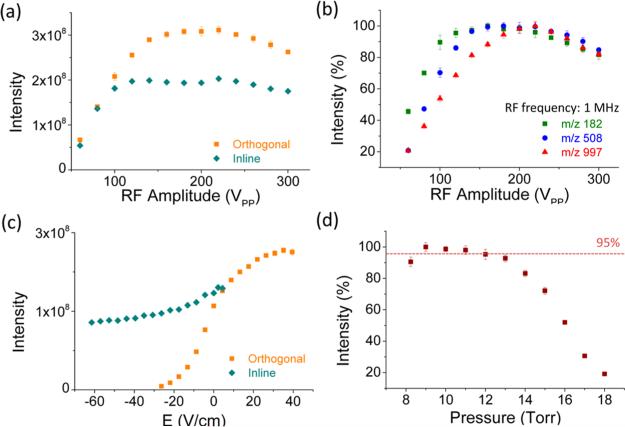
The optimal tuning of optics for orthogonal ion injection was expected to be different from the in-line injection, since ions experience significantly different gas dynamics. The characterization of RF amplitude was first performed to provide optimal radial confinement. During the experiment, the pressures of HPIF, IFT, and analyzer chambers were maintained at 8 Torr, 1 Torr, and 4 × 10⁻⁶ Torr, respectively. Figure 2a shows the total ion current (TIC) for singly charged polytyrosine-1,3,6, as a function of the RF amplitude with frequency of 1 MHz in the orthogonal (orange squares) and in-line injection (aqua diamonds) modes. The ion signal in the in-line mode reached a plateau at lower RF amplitude of 120 Vp-p, in comparison to the orthogonal mode at 160 Vp-p, which indicates that a stronger RF confinement in radial direction is required for orthogonal injection. The higher RF confinement, presumably, is required to overcome the effect of gas dynamics in the orthogonal direction and prevent ions from hitting the side of the HPIF. Figure 2b shows the normalized selected ion chromatogram (SIC) measurements for three individual ions, as a function of the RF amplitude in the orthogonal mode. The intensity is normalized to the highest value for each. The highest SICs for ions of m/z 182 (green squares), 508 (blue circles), and 997 (red triangles) were obtained with RF amplitudes of 160, 180, and 220 Vp-p, respectively. These shifts of the curves with RF amplitude are ascribed to the influence of low mass cutoff, resulting from the different RF trapping potentials. The results indicate that RF >220 Vp-p is sufficient for efficient ion transmission over at least a range of m/z 182 to m/z 997.
Figure 2.
(a) Comparison of total ion current (TIC), as a function of RF amplitude in orthogonal and in-line injection modes. (b) Comparison of ion intensities from ions of m/z 182, 508, and 997, as a function of RF amplitude varied from 60 Vp-p to 300 Vp-p in orthogonal injection mode. (c) Measurement of ion transmission efficiency at HPIF straight section. (d) effect of pressure on ion transmission for the HPIF in orthogonal and inline injection mode.
Figure 2c compares TIC measurements for the orthogonal (orange squares) and in-line (aqua diamonds) injection modes, as a function of electrical field along the HPIF straight section. The variation of the electrical field was implemented by changing the voltages applied at the repeller and the HPIF entrance (and which then dictates the potentials applied to the HPIF electrodes through its resistor chain). As can be observed in Figure 2c ions, in both injection modes, are still transmitted through the straight region with a negative electrical field gradient due to gas dynamic effects, but, as expected, fewer ions were transmitted in the orthogonal injection mode. For instance, at a repulsive electric field of 30 V/cm, no ions were transmitted in the orthogonal injection mode, whereas, for the in-line capillary, 70% of the maximum signal (for in-line injection mode) is still observable. These results indicate that ions were accelerated by the expansion of gas exiting the inlet capillary, which also can transmit undesirable charged droplets and neutral particles. The ion currents increased with a positive electrical field gradient in both modes. The highest observable current was at the gradient of 2.2 V/cm for in-line injection and 35.1 V/cm for orthogonal injection mode when the repeller voltage reached its maximum output at 380 V, because of the limitations of the power supply. The higher field strength for the optimal transmission in the orthogonal injection mode reflects the differences in gas dynamics for the two arrangements. Contrary to the effect of DC gradient observed in Figure 2c, the repulsive DC field on the converging section show no effect (see Figure S1 in the Supporting Information) on ion intensities in either modes, orthogonal or in-line, because of the reduced gas dynamics in the region far away from the inlet capillary.
Figure 2d shows the effect of the pressure on TIC measurements in the orthogonal mode. The ion intensities were measured as the function of HPIF chamber pressure, while the IFT chamber pressure was maintained at 1 Torr and the RF parameters for both funnels were fixed at 220 Vp-p/1 MHz for HPIF and 184 Vp-p/1.3 MHz for the IFT. The pressures of both chambers were adjusted by choking the flow to the mechanical pumps. MS results were optimized at 8–12 Torr, corresponding to ≥95% above the maximum intensity achieved in the orthogonal injection mode. Insufficient RF focusing at higher pressure (>12 Torr) resulted in a decrease in ion intensities in both injection modes (and which can be mitigated by further increasing the RF amplitude).9
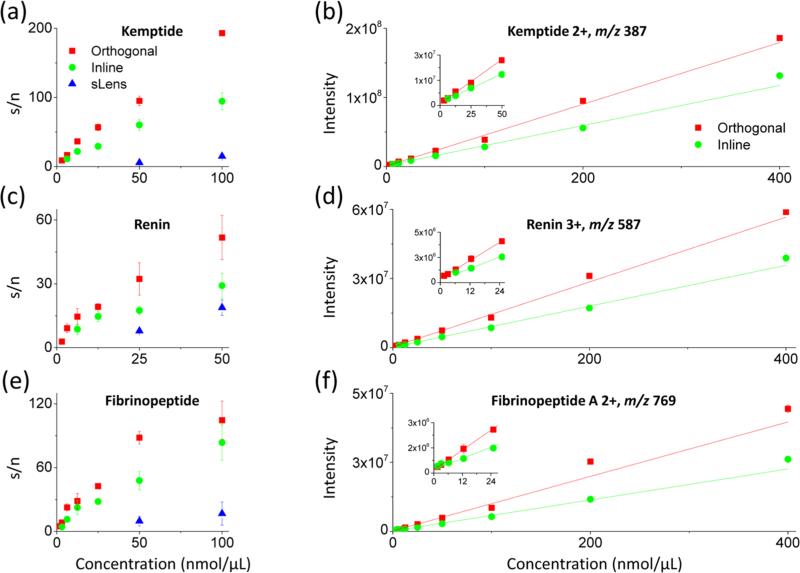
The sensitivity of the orthogonal HPIF/IFT interface was first evaluated using a nine-peptide mixture. A label-free MS quantitation of a peptide mixture (Table S1 in the Supporting Information) was performed prior to the LC-SRM experiment, and baselines were established using both a commercial interface (S-lens) and an in-line HPIF/IF interface on the same triple quadrupole MS. During the experiment, the capillary temperature was set at 140 °C for HPIF and 310 °C for a commercial interface (Figure 1a) and the resolution setting on triple quadrupole has a peak width of 0.7 Da for Q1 and Q3. The sensitivities of MS quantitation and LC-SRM were assessed based on the LOD and limit of quantification (LOQ) values. Figure 3 shows three randomly selected examples of calibration curves from Kemptide (Figure 3a and Figure 3b), Renin (Figure 3c and Figure 3d) and Fibrinopeptide A (Figure 3e and Figure 3f) by the orthogonal (red squares), in-line HPIF-IF (green circles) and commercial standard S-lens interface (blue triangles). The results in Figure 3a, Figure 3c, and Figure 3e show that the 4-fold to 32-fold improvements in LODs and overall higher S/N was obtained by the ion funnel configurations (orthogonal and in-line) in comparison to the standard source. In Figure 3 b, Figure 3d, and Figure 3f, the results of intensity measurement indicate that the best LOD values with good linearity were obtained by the orthogonal injection, in comparison to the in-line injection mode. The detailed measurement of all nine target peptides in Table S2 in the Supporting Information shows that orthogonal injection HPIF significantly improves the signal-to-noise (S/N) ratio and coefficient of variation (CV) for the analytes at levels of 6.25 nmol. Overall, the LOD and LOQ values obtained from each surrogate peptide by orthogonal injection show sensitivities 2-fold to 8-fold better than that of in-line injection HPIF and 8-fold to 32-fold better than that of the commercial S-lens interface.
Figure 3.
Three selected calibration curves from the nine-peptide mixture for concentrations ranging from 200 pmol/μL to 400 nmol/μL using orthogonal injection HPIF, in-line injection HPIF, and standard triple quadrupole atmospheric pressure interfaces.
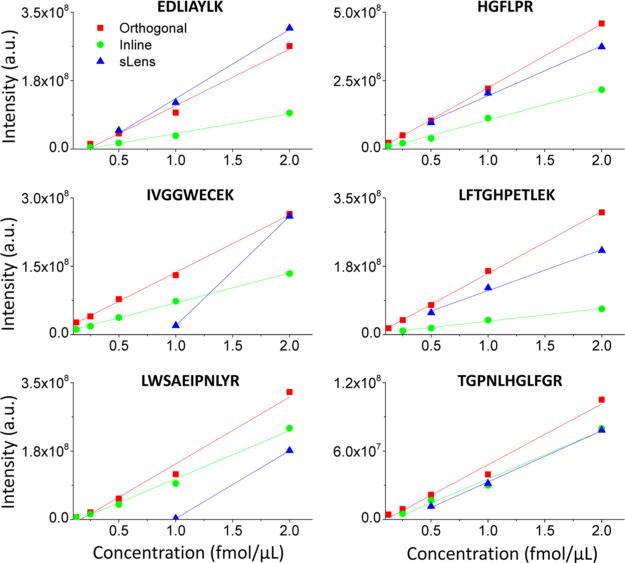
A further evaluation on the utility of the orthogonal injection was conducted using a label-free LC-SRM analysis of 18 peptides (Table S3 in the Supporting Information) from four proteins prepared at equal concentrations ranging from 31.2 amol/μL to 2 fmol/μL for the three interfaces. Figure 4 illustrates the calibration curves of 6 selected target peptides out of the 18 peptides analyzed. The scan width for the QqQ was set at 0.002 m/z and 15 ms for the scan time in the SRM mode. The sensitivities of LC-SRM data were assessed based on the LOD and the linearity of the calibration curves. The integrated peak areas of three monitored transitions for each peptide were recorded as a function of the amount loaded at the LC column. The results indicate that the lowest detectable concentrations from orthogonal injection HPIF are estimated to be 2-fold better than those obtained using in-line injection HPIF and are 2-fold to 8-fold better than those of the S-lens interface for most of the peptides. The summary of quantitative performance of the 18 peptides using three interfaces is shown in Table S4 in the Supporting Information. Better detection limits were obtained in 13 out of 18 peptides by orthogonal, 6 of 18 peptides by in-line injection HPIF, and 3 of 18 peptides from standard interface. For linearity, moderate improvements were shown using orthogonal injection HPIF upon the LCSRM, which also was attributed to a reduced chemical background.
Figure 4.
Typical calibration curves for 18 peptide mixed solution at concentration from 1.56 amol/μL to 2 fmol/μL using LC through orthogonal injection HPIF, in-line injection HPIF, and standard triple quadrupole atmospheric pressure interfaces to MS in SRM mode.
CONCLUSIONS
An orthogonal injection ion funnel interface has been designed, implemented, characterized, and evaluated in conjunction with a liquid chromatography selected reaction monitoring (LC-SRM) triple-quadrupole mass spectrometry (MS). Orthogonal extraction of ions from the source gas flow path is shown to significantly enhance the sensitivity for detection of analytes from peptide mixture and complex biological samples. In comparison with the standard triple-quadrupole interface, the significant improvement in the signal-to-noise (S/N) measurement and a 4-fold to 32-fold enhancement in the limit of detection (LOD) for single-stage MS quantitation were achieved using a peptide mixture. For the LC-SRM-based protein quantification, the extracted ion chromatograms (XICs) of monitored peptides showed 2-fold to 8-fold enhancement of the LOD with good linearity of measurements.
Supplementary Material
ACKNOWLEDGMENTS
The authors thank Dr. Tujin Shi, Dr. Ian Webb, Dr. Jonathan Cox, and Dr. Jia Guo for helpful discussions. The authors also thank Mr. Grant Fujimoto for the assistance for the data processing programming. Portions of this research were supported by the NIH National Cancer Institute (No. 1R33CA155252) and General Medical Sciences Proteomics Research Resource at Pacific Northwest National Laboratory (PNNL) (No. GM103493-12), the Laboratory Directed Research and Development Program at PNNL, and the Department of Energy offce of Biological and Environmental Research Genome Sciences Program under the Pan-omics program. All the experiments were performed in the Environmental Molecular Sciences Laboratory, a U.S. Department of Energy (DOE) national scientific user facility located at PNNL in Richland, WA. PNNL is a multiprogramming national laboratory operated by Battelle for the DOE, under Contract No. DE-AC05-76RLO01830.
Footnotes
The authors declare no competing financial interest.
Supporting Information
The Supporting Information is available free of charge on the ACS Publications website at DOI: 10.1021/acs.anal-chem.5b01482.
REFERENCES
- 1.Cox J, Marginean I, Smith R, Tang K. J. Am. Soc. Mass Spectrom. 2015;26:55–62. doi: 10.1007/s13361-014-0998-5. [DOI] [PMC free article] [PubMed] [Google Scholar]
- 2.Marginean I, Page JS, Tolmachev AV, Tang K, Smith RD. Anal. Chem. 2010;82:9344–9349. doi: 10.1021/ac1019123. [DOI] [PMC free article] [PubMed] [Google Scholar]
- 3.Kebarle P, Tang L. Anal. Chem. 1993;65:972A–986A. [Google Scholar]
- 4.Dodonov A, Kozlovsky V, Loboda A, Raznikov V, Sulimenkov I, Tolmachev A, Kraft A, Wollnik H. Rapid Commun. Mass Spectrom. 1997;11:1649–1656. doi: 10.1002/(SICI)1097-0231(19971015)11:15<1649::AID-RCM67>3.0.CO;2-T. [DOI] [PubMed] [Google Scholar]
- 5.Kelly RT, Tolmachev AV, Page JS, Tang K, Smith RD. Mass Spectrom. Rev. 2010;29:294–312. doi: 10.1002/mas.20232. [DOI] [PMC free article] [PubMed] [Google Scholar]
- 6.Gerlich D. State-Selected and State-To-State Ion-Molecule Reaction Dynamics. In: Ng C-Y, Baer M, editors. Advances in Chemical Physics. Vol. 82. Wiley; New York: 1992. pp. 1–176. [Google Scholar]
- 7.Bruins AP. Mass Spectrom. Rev. 1991;10:53–77. [Google Scholar]
- 8.Shaffer SA, Tang K, Anderson GA, Prior DC, Udseth HR, Smith RD. Rapid Commun. Mass Spectrom. 1997;11:1813–1817. [Google Scholar]
- 9.Ibrahim Y, Tang K, Tolmachev AV, Shvartsburg AA, Smith RD. J. Am. Soc. Mass Spectrom. 2006;17:1299–1305. doi: 10.1016/j.jasms.2006.06.005. [DOI] [PMC free article] [PubMed] [Google Scholar]
- 10.Kim T, Udseth HR, Smith RD. Anal. Chem. 2000;72:5014–5019. doi: 10.1021/ac0003549. [DOI] [PubMed] [Google Scholar]
- 11.Kim T, Tang K, Udseth HR, Smith RD. Anal. Chem. 2001;73:4162–4170. doi: 10.1021/ac010174e. [DOI] [PubMed] [Google Scholar]
- 12.Whitehouse CM, Welkie DG. 2013 U.S. Patent US8507850 B2.
- 13.Tang K, Tolmachev AV, Nikolaev E, Zhang R, Belov ME, Udseth HR, Smith RD. Anal. Chem. 2002;74:5431–5437. doi: 10.1021/ac0202583. [DOI] [PubMed] [Google Scholar]
- 14.Mordehai A, Werlich MH. 2009 U.S. Patent 8324565 B2.
- 15.Senko MW, Kovtoun VV. U.S. Patent 7514673 B2. 2013 [Google Scholar]
- 16.Wouters ER, Splendore M, Mullen C, Schwartz JC, Senko MW, Dunyach JJ. Presented at the 57th Conference of the American Society for Mass Spectrometry; Philadelphia, PA. 2009. [Google Scholar]
- 17.Giles K. 2011 U.S. Patent 12/679,139.
- 18.Giles K, Wildgoose J, Williams J, Cecco MD. Presented at the 61th Conference of the American Society for Mass Spectrometry; Minneapolis, MN. 2013. [Google Scholar]
- 19.Fialkov AB, Steiner U, Jones L, Amirav A. Int. J. Mass Spectrom. 2006;251:47–58. [Google Scholar]
- 20.Belov ME, Prasad S, Prior DC, Danielson WF, Weitz K, Ibrahim YM, Smith RD. Anal. Chem. 2011;83:2162–2171. doi: 10.1021/ac103006b. [DOI] [PMC free article] [PubMed] [Google Scholar]
- 21.Ibrahim Y, Belov ME, Tolmachev AV, Prior DC, Smith RD. Anal. Chem. 2007;79:7845–7852. doi: 10.1021/ac071091m. [DOI] [PMC free article] [PubMed] [Google Scholar]
- 22.Kelly RT, Page JS, Luo Q, Moore RJ, Orton DJ, Tang K, Smith RD. Anal. Chem. 2006;78:7796–7801. doi: 10.1021/ac061133r. [DOI] [PMC free article] [PubMed] [Google Scholar]
- 23.MacLean B, Tomazela DM, Shulman N, Chambers M, Finney GL, Frewen B, Kern R, Tabb DL, Liebler DC, MacCoss MJ. Bioinformatics. 2010;26:966–968. doi: 10.1093/bioinformatics/btq054. [DOI] [PMC free article] [PubMed] [Google Scholar]
Associated Data
This section collects any data citations, data availability statements, or supplementary materials included in this article.


