

Abstract
The aim of this study was to further our understanding of the transformation process by identifying differentially expressed proteins in melanocytes compared with melanoma cell lines. Tandem mass spectrometry incorporating iTRAQ reagents was used as a screen to identify and comparatively quantify the expression of proteins in membrane-enriched samples isolated from primary human melanocytes or three melanoma cells lines. Real-time PCR was used to validate significant hits. Immunohistochemistry was used to validate the expression of proteins of interest in melanocytes in human skin and in melanoma-infiltrated lymph nodes. Publically available databases were examined to assess mRNA expression and correlation to patient outcome in a larger cohort of samples. Finally, preliminary functional studies were carried out using siRNAs to reduce the expression of a protein of interest in primary melanocytes and in a keratinocyte cell line. Two proteins, AHNAK and ANXA2, were significantly downregulated in the melanoma cell lines compared with melanocytes. Downregulation was confirmed in tumor cells in a subset of human melanoma-infiltrated human lymph nodes compared with melanocytes in human skin. Examination of Gene Expression Omnibus database data sets suggests that downregulation of AHNAK mRNA and mutation of the AHNAK gene are common in metastatic melanoma and correlates to a poor outcome. Knockdown of AHNAK in primary melanocytes and in a keratinocyte cell line led to a reduction in detectable cadherin-1. This is the first report that we are aware of which correlates a loss of AHNAK with melanoma and poor patient outcome. We hypothesize that AHNAK is required for the expression of functional cadherin-1.
Keywords: AHNAK, ANXA2, cadherin-1, cell-to-cell adhesion, melanoma
Introduction
Melanoma is a malignant tumor that originates in melanocytes. It is the most serious and aggressive form of skin cancer, and its incidence has increased over the last two decades 1. However, if recognized and treated early, most individuals with thin, localized melanomas can achieve a cure by appropriate surgery. Early detection remains the best treatment for skin cancer and the cure rate continues to increase. However, if not captured early, the cancer can advance and spread to other parts of the body, where it becomes difficult to treat and can be fatal. Although it is not the most common skin cancer, it causes the most deaths 2.
Before 2011, the mainstay for the treatment of unresectable malignant melanoma was the use of cytotoxic drugs, with low response rates of between 10 and 20% 3. However, since then, our understanding of the molecular basis for melanoma has led to major advances in treatment 4, with drugs targeting molecular pathways in tumor cells and developments in immune therapy. Although these advances are having a significant impact on melanoma treatment, it is a heterogeneous disease at the molecular level and a significant proportion of patients do not respond to new treatments. Therefore, there remains a need to understand the molecular biology of melanoma to identify new biomarkers for treatment responses and new targets for therapy.
Although our understanding of melanoma has increased in recent years 1, it is still not completely clear how a melanocyte transforms into melanoma. However, it is understood that proteins expressed in the melanocyte cell membrane play a critical role in cell-to-cell contact and function 5. Identification of novel changes in membrane proteins expressed in melanoma cells compared with normal human melanocytes would further our understanding of the transformation process as well as offer new therapeutic targets for monoclonal antibody therapy or chimeric antigen receptor T cells. As proteomic methods have advanced in recent years, a small number of studies have used various proteome-analyzing techniques to identify prognostic or diagnostic markers in melanoma 6. However, none, to our knowledge, have used membrane protein-enriched samples with tandem mass spectrometry incorporating iTRAQ quantification reagents. Therefore, we used this method as an initial screen to identify differentially expressed proteins present in human primary melanocytes compared with three human melanoma cell lines. Here, we report on two proteins that, using this method, were found to be significantly downregulated in melanomas compared with melanocytes.
Materials and methods
Cell culture
Normal human epidermal melanocytes (NHEM) were obtained from Cascade Biologics and were propagated in phorbol myristate acetate-free melanocyte medium (Cascade Biologics/Invitrogen, Auckland, New Zealand). HaCaT cells and melanoma cell lines SKMEL23, DAGI, and ME275 were propagated in RPMI1640 supplemented with 10% fetal bovine serum, 1× penicillin/streptomycin/glutamine (Invitrogen) at 37°C with 5% CO2.
Plasma membrane protein enrichment, identification, and quantification
All cell samples were grown to full confluence in a T75 flask. Plasma membrane proteins were enriched using a native membrane protein extraction kit (Calbiochem, Gibbstown, New Jersey, USA). Samples were precipitated to remove any contaminating detergents from the enrichment process using a protein precipitation kit (Calbiochem). All samples were labeled with iTRAQ quantification labels (Applied Biosystems, Melbourne, Victoria, Australia) and combined for tandem mass spectrometry analysis. The sample was separated on a cation exchange column into 10 fractions before tandem mass spectrometry analysis by a QSTAR XL Hybrid MS/MS (Applied Biosystems).
Immunohistochemistry and immunocytochemistry
Immunohistochemistry was performed on 5 µm frozen tissue sections and on cells seeded in chamber slides (BD, Auckland, New Zealand) using mouse anti-AHNAK (Abnova, Taipei City, Taiwan), mouse anti-ANXA2 (Abcam, Cambridge, Massachusetts, USA), mouse anti-MART1 (Serotec, Raleigh, North Carolina, USA), or mouse anti-cadherin-1 (Abcam) for 1 h at room temperature, followed by the appropriate secondary antibodies (Molecular Probes, Auckland, New Zealand) and 4′,6-diamidino-2-phenylindole nuclear stain (Molecular Probes) for 1 h at room temperature. Stained samples were analyzed using a fluorescent microscope with the ×10, ×20, or ×40 objective lens. Exposure times were determined for each protein to be at just below the saturation point when examining the slide with the highest protein expression levels. They were maintained to be constant within each experiment.
Quantitative real-time polymerase chain reaction
Total RNA was isolated from all samples using an RNeasy Mini Kit (Qiagen, Doncaster, Victoria, Australia). First-strand cDNA was synthesized for all samples using random hexamer primers and SuperScript III reverse transcriptase (Invitrogen). Quantitative real-time (RT)-PCR was carried out on a 7900HT Real Time PCR System (Applied Biosystems) with Power SYBR Green PCR master mix. PCR cycling parameters were 50°C for 2 min, 95°C for 10 min, followed by 40 cycles of 95°C for 15 s and 60°C for 60 s, with a final SYBR disassociation step to ensure that a single PCR product was being produced. The following primers were used: AHNAK – 5′-GTGACCGAGATTCCCGACGA-3′, 3′-AGCTCCCGGGTTGTCTCCTC-5′; ANXA2 – 5′-CGCAGCAATGCACAGAGACA-3′, 3′-CCTGCAGCTCCTGGTTGGTT-5′; GAPDH – 5′-TGGTCACCAGGGCTGCTT-3′, 3′-TTGACGGTGCCATGGAATT-5′; HPRT1 – 5′-GACCAGTCAACAGGGGACAT-3′, 3′-AACACTTCGTGGGGTCCTTTTC-5′. PCR products produced using these primers were sequence confirmed to ensure specificity. Results for AHNAK and ANXA2 were normalized against the two endogenous reference genes GAPDH and HPRT1. Taqman reagents (ABI) were used to analyze the knockdown of AHNAK and cadherin-1 (CDH1) (Fig. 5c) and were normalized to HPRT1 expression using standard methods as described previously 7.
Fig. 5.
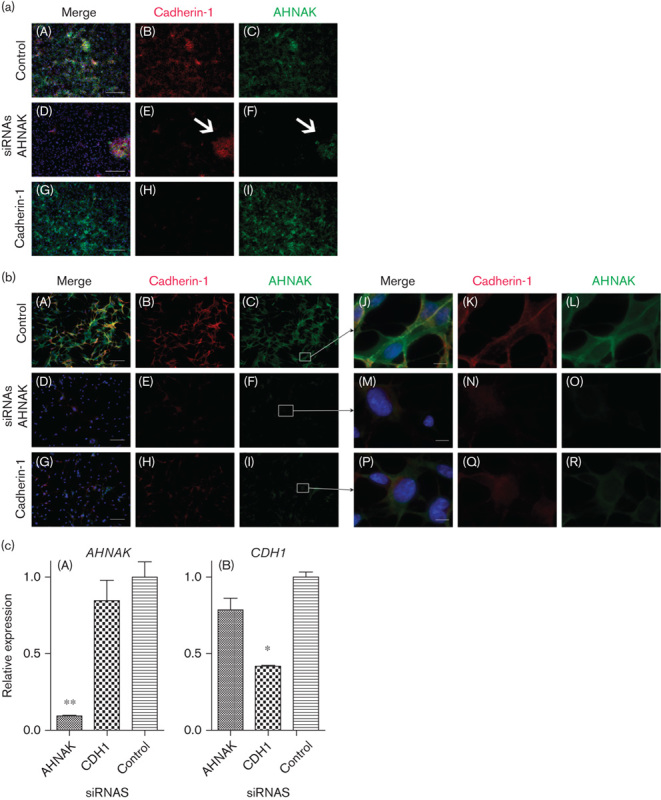
A reduction in AHNAK protein expression affects cadherin-1 protein (a) HaCaT cells and (b) melanocyte cells transfected with a control siRNA (A–C), AHNAK targeted siRNAs (D–F) or CDH1 targeted siRNAs (G–I). In each case, panels A, D, and G represent three color merged images of AHNAK in green (shown alone in panels C, F, and I), cadherin-1 in red (shown alone in panels B, E, and H), and DAPI in blue. Panels J, M, and P represent zoomed merged images from panels C, F, and I, respectively, with AHNAK in green (shown alone in panels L, O, and R), cadherin-1 in red (shown alone in panels K, N, and Q) and DAPI in blue. The scale bar represents 250 µm in (a), 100 µm in (b), and 10 µm in the zoom. (c) mRNA levels of AHNAK (A) or CDH1 (B) in HaCaT cells 72 h after transfection with either AHNAK, CDH1 or control nontargeted siRNAs (n=2). DAPI, 4′,6-diamidino-2-phenylindole.
Transfection experiments
Cells were transfected with 10 nmol/l ON-TARGETplus SMARTpool siRNAs (Dharmacon, Lafayette, Colorado, USA) targeting human AHNAK, CDH1, or a scrambled control. For HaCaT cells, RNAi max (Invitrogen) was used as the transfection reagent according to the manufacturer’s instructions. For melanocytes, HiPerFect (Qiagen) was used as the transfection reagent according to the manufacturer’s instructions. Fluorescently labeled BlockIT siRNA (Invitrogen) was used to assess transfection efficiency. Immunocytochemistry was performed 72 h after transfection or RNA was harvested, and levels of AHNAK and CDH1 mRNA were assessed by RT-PCR as described above.
Analysis of Gene Expression Omnibus database data
For all analyses of published Affymetrix microarray data, CEL files corresponding to each tissue sample were downloaded from the Gene Expression Omnibus (GEO) database. Normalization of array data within each study was performed from the raw data in cel files using the RMA method 8 without background correction. Kaplan–Meier survival analysis with significance tests and significance tests using Cox proportional hazards models was carried out using the R survival package (http://cran.r-project.org/web/packages/survival/).
Results
We used tandem mass spectrometry incorporating iTRAQ quantification reagents as a screening tool to simultaneously identify and comparatively quantify the expression of proteins in multiple complex samples. Membrane protein-enriched extractions were harvested from lightly pigmented NHEM and three melanoma cell lines: SKMEL23, DAGI, and ME275. They were then subjected to iTRAQ tandem mass spectrometry analysis. Duplicate experiments identified a total of 283 proteins, 11 of which were differentially expressed (>2-fold change, P<0.05) when comparing melanocytes with at least one of the melanoma cells (see Supplementary Table 1). Of these proteins, only two, namely, AHNAK and ANXA2, showed more than 5-fold reduced expression in all melanoma cell lines compared with NHEM (Fig. 1a). AHNAK expression was decreased more than 41-, 62-, and 9-fold, respectively, in SKMEL23, DAGI, and ME275 melanoma cell lines (Fig. 1b). ANXA2 expression was decreased more than 12-, 8-, and 10-fold, respectively, in these cell lines (Fig. 1b). Cadherin-1 was not detected by this method.
Fig. 1.
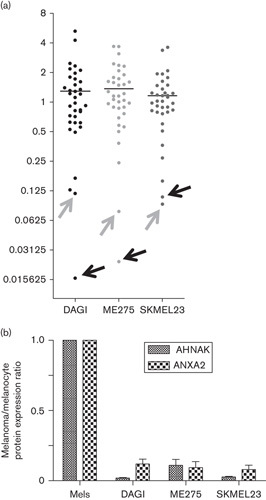
(a) AHNAK and ANXA2 proteins are downregulated in membrane-enriched protein fractions of melanoma cell lines compared with melanocytes. Tandem mass spectrometry incorporating iTRAQ reagents was used to analyze the relative expression of proteins in plasma membrane-enriched protein extracts from three human melanoma cell lines (DAGI, SKMEL23, ME275) and normal human epidermal melanocytes. Each dot represents a specific protein differentially expressed (P<0.05) in at least one cell line compared with melanocytes. Averaged results are shown as a ratio relative to their levels in melanocytes. Arrows are used to indicate the dots representing AHNAK (black arrow) and ANXA2 (gray arrow) (n=2). (b) AHNAK and ANXA2 protein levels in the melanoma cell lines are shown as a ratio relative to their expression melanocytes.
AHNAK and ANXA2 mRNA expression was analyzed by quantitative RT-PCR to examine whether the downregulation observed at the protein level correlated with downregulation at the mRNA level. AHNAK mRNA expression levels were significantly decreased in two out of three melanoma cell lines, and unchanged in one, compared with normal melanocytes (Fig. 2). ANXA2 mRNA expression was significantly decreased in all three melanoma cell lines compared with normal melanocytes (Fig. 2). These results indicate that decreases in AHNAK and ANXA2 protein expression levels, except for AHNAK in the DAGI melanoma cell line, are most likely because of reduced transcription of the mRNA. As the decrease in AHNAK protein expression in the DAGI cell line did not correlate with reduced mRNA expression, we presume that a post-transcriptional mechanism is involved.
Fig. 2.
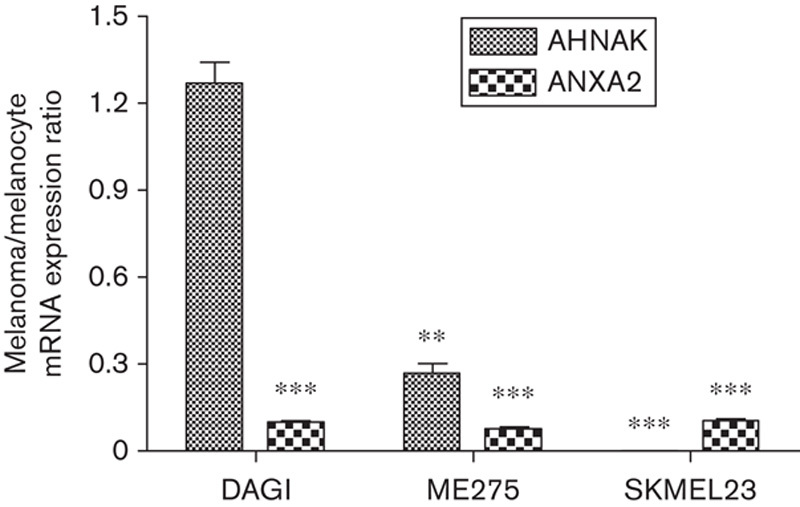
AHNAK and ANXA2 mRNA is downregulated in melanoma cell lines compared with melanocytes. AHNAK and ANXA2 mRNA expression was analyzed by quantitative real-time PCR in DAGI, ME275, SKMEL23 melanoma cell lines, and melanocytes. AHNAK and ANXA2 mRNA expression in the three melanoma cell lines is shown as a ratio relative to expression in melanocytes. Data represent an average of triplicate repeats; error bars represent the SD from the mean. The Student's t-test was used to assess significance, with P values of less than 0.05 being considered significant. **P<0.01, ***P<0.001.
To confirm that AHNAK is expressed in melanocytes in normal human skin, we used immunohistochemistry to visualize AHNAK and MART1 expression, a melanocyte-specific marker, in transverse human skin sections. AHNAK was expressed by almost all cells in the dermis and epidermis (Fig. 3a). Keratinocytes in the epidermis expressed AHNAK in the cytoplasm, but not the nucleus. Expression of the melanocyte-specific marker MART1 identified melanocytes in the epidermis, which were spread along the basement membrane. Coexpression of AHNAK and MART1 indicated that AHNAK is expressed in the melanocytes, with expression predominantly outside of the nucleus (Fig. 3a).
Fig. 3.
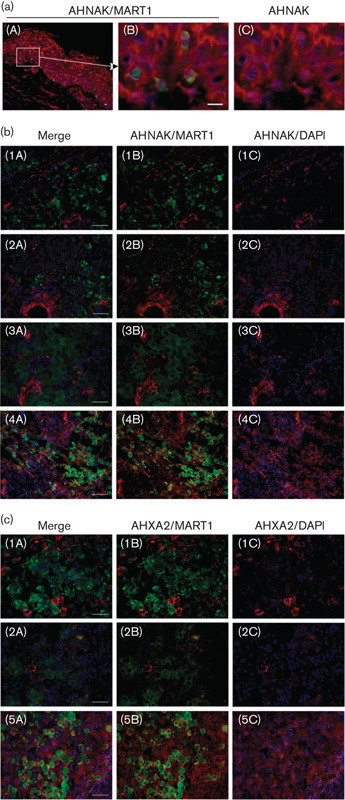
AHNAK expression is often reduced in melanoma cells that have infiltrated patient lymph nodes compared with melanocytes. (a) Immunohistochemistry was performed on a transverse section of human skin costained with AHNAK (red), MART1 (green, to detect melanocytes) and DAPI (blue). A zoomed image showing melanocytes identified along the basement membrane is shown in panel (B) and panel (C) shows the image without MART1 staining. (b) Transverse sections of four representative melanoma-infiltrated lymph nodes (MILNs) costained with AHNAK (red), MART1 (green, to detect melanocytes), and DAPI (blue) and (c) three representative MILNs stained for ANXA2 (red), MART1 (green), and DAPI (blue). Panel (A) represents the merged images, panel (B) just AHNAK or ANXA2 with MART1 staining, and panel (C) just AHNAK or ANXA2 with DAPI staining. The scale bar represents 10 µm in (a), panel (B) and 50 µm in (b) panels (A). DAPI, 4',6-diamidino-2-phenylindole.
Having established that AHNAK is expressed in melanocytes in normal human skin, we next asked whether its expression is altered in melanoma cells in vivo, similar to that observed in melanoma cell lines in vitro. To assess this, we used immunohistochemistry to visualize AHNAK and MART1 coexpression in transverse sections of melanoma-infiltrated lymph nodes (MILNs). AHNAK expression was low or below the limit of detection in five out of seven MILNs assessed. Figure 3b shows representative data, with AHNAK expression being low to undetectable in MILN samples numbered 1–3 and expressed in MILN sample 4. When we assessed ANXA2 expression in the same MILNs, two out of seven (MILNs numbered 1 and 2; Fig. 3c) showed a marked reduction in ANXA2 expression. MILN sample 5 is shown as a representative example where ANXA2 expression is retained. This suggests that AHNAK, and to a lesser extent ANXA2, expression is lost in a proportion of melanomas in vivo.
Our MILN data set was limited because of low numbers of human samples being available to us. Therefore, we performed a review of publically available microarray data sets to determine whether we could find a similar correlation between AHNAK expression and melanoma at the mRNA level. An examination of microarray data deposited in the GEO database by Talantov et al. 9 suggests that there is a striking and statistically significant trend of a downregulation of AHNAK mRNA in metastatic melanoma (M, n=45) compared with normal skin (N, n=7) or benign naevi (B, n=18) (Fig. 4a; P<0.05). In this analysis, AHNAK expression was measured using the Affymetrix probe set 211986_at, which contains probes that exclusively hybridize to the AHNAK mRNA 3′-UTR. This suggests that a downregulation of AHNAK is a common occurrence in melanoma. We next asked whether there was a correlation between AHNAK expression and patient survival using data generated by Bogunovic et al. 10. Cox proportional hazards survival analysis of their data suggested that expression of AHNAK mRNA (measured using the Affymetrix probe set 211986_at) in metastatic melanoma may be associated with patient survival and inversely associated with early relapse (Cox proportional hazards, P=0.01; Fig. 4b). We next assessed malignant melanoma exome sequence data from The Cancer Genome Atlas (TCGA) 11 and our own tumor meta-analysis 12, which identified AHNAK gene mutations in 14% of 278 and 8% of 310 tumors, respectively.
Fig. 4.
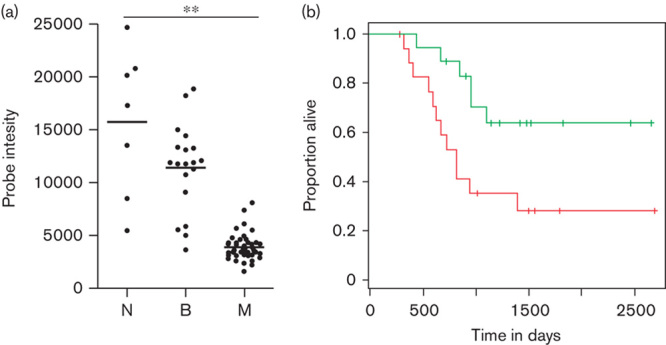
AHNAK mRNA is downregulated in malignant melanoma samples. A publically available microarray data set was analyzed to assess the expression of AHNAK in metastatic versus nonmetastatic samples. (a) Data derived from the GEO data set GDS1375, probe 211986_at 9. N, normal melanocytes (n=7); B, benign naevi (n=18); M, metastatic melanoma (n=45). Expression data for AHNAK were plotted using Prism and statistics were determined using a one-way ANOVA with a Bonferroni multiple comparison test (**P<0.05). Dots represent individual data points and the line represents the average expression across all samples. (b) Kaplan–Meier curves were prepared using data from Bogunovic et al. 10 and their GEO data set GSE19234. These compare the survival of patients whose metastatic melanomas had above (green) or below (red) median AHNAK mRNA expression. Analysis is based on a normalized tumor expression signal for Affymetrix gene chip probe set 211986_at. Cox proportional hazards, P<0.01. Green, >cut-off; red, <cut-off.
AHNAK has been shown to interact with ANXA2 at the plasma membrane in epithelial cells upon cell–cell contact 13,14. It has also been reported that ANXA2 and its binding partner S100A10 are required to form functional adherens junctions with cadherin-1 15. Combining these results suggests that there may be a link between AHNAK and cadherin-1 through ANXA2. As melanoma cells at an early radial growth phase often show a loss of cadherin-1 expression 16, we therefore hypothesized that a loss of AHNAK may affect cadherin-1 expression or function. To test this, we transfected primary melanocytes with validated AHNAK targeting siRNAs and assessed AHNAK and cadherin-1 protein expression using immunocytochemistry. Although melanocytes form cell-to-cell contacts with keratinocytes in vivo 5, they do not show clear cell-to-cell adhesion when cultured in isolation in vitro. Therefore, as we were interested in cell-to-cell contacts, we also conducted the knockdown experiments in the HaCaT keratinocyte cell line, which does show clear cell-to-cell contacts in vitro. Optimum transfection conditions were established using a fluorescently labeled control siRNA duplex and flow cytometry to assess uptake (data not shown). CDH1 targeting and scrambled siRNAs were included as controls. Results are shown in Fig. 5a and b, respectively.
In both HaCaTs and melanocytes, expression of AHNAK and cadherin-1 was clearly detectable in control transfected cells (Fig. 5a and b, panels A–C). In both cell types, targeted siRNAs effectively reduced the expression of either AHNAK (Fig. 5a and b, compare panel F with C) or cadherin-1 (Fig. 5a and b, compare panel H and B). RT-PCR was used to confirm that knockdown of both AHNAK and CDH1 mRNA was specific (Fig. 5c). Interestingly, in both HaCaT cells and melanocytes, a reduction in AHNAK expression corresponded to a marked reduction in detectable cadherin-1 protein (compare panel E with B). Detection of AHNAK and cadherin-1 proteins was reduced in both the cytoplasm and the plasma membrane (e.g. Fig. 5b, compare panels L with O and N with K). The association of cadherin-1 expression with AHNAK expression is highlighted by the observation that a small percentage of HaCaT cells that were not efficiently transfected with the AHNAK targeting siRNAs coexpress both AHNAK (see arrow in Fig. 5a, panel F) and cadherin-1 (see arrow in Fig. 5a, panel E). Cadherin-1 protein knockdown was also efficiently achieved in both cell types (Fig. 5a and b, compare panel H with B). In HaCaT cells, this did not lead to a noticeable reduction in AHNAK protein expression levels (Fig. 5a, compare panel I with C). Cell-to-cell adhesion was not noticeably affected by knockdown of either AHNAK or cadherin-1 as assessed visually under the microscope. In melanocytes reduced cadherin-1 expression correlated with reduced AHNAK expression in both the cytoplasm and at the plasma membrane (Fig. 5b, compare panels I with C, and R with L). These preliminary results indicate that AHNAK expression affects cadherin-1 protein expression, even when CDH1 mRNA levels are presumably unaffected.
To explore this further, we examined the expression of CDH1 mRNA in the GEO data set examined in Fig. 4a. Interestingly, the same data set suggests that neither ANXA2 (data not shown) nor CDH1 are downregulated in these melanomas; indeed, CDH1 mRNA is significantly upregulated in the malignant melanomas compared with normal skin (Fig. 6; P<0.05). Collectively, this suggests that a downregulation of AHNAK mRNA combined with either no change or an increased expression in CDH1 mRNA is a common occurrence in melanoma.
Fig. 6.
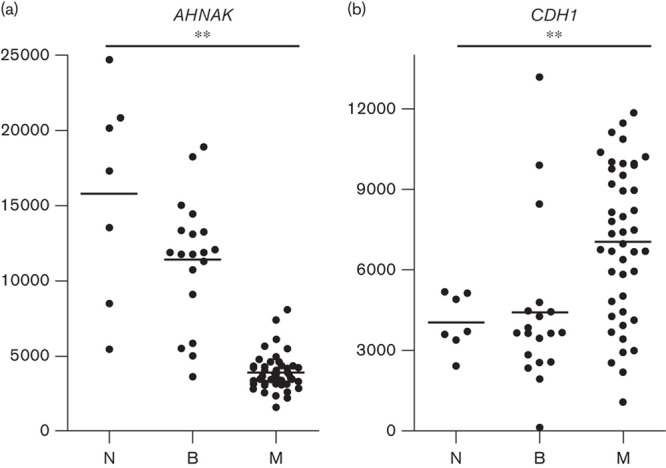
CDH1 mRNA is upregulated in malignant melanoma samples. The GEO microarray data set GDS1375 9 (analyzed in Fig. 4a for AHNAK expression) was further analyzed to assess the expression of CDH1 mRNA. (a) AHNAK expression as shown in Fig. 4 and (b) CDH1 expression. N, normal melanocytes (n=7); B, benign naevi (n=18); M, metastatic melanoma (n=45). Expression data were plotted using Prism and statistics were determined using a one-way ANOVA with a Bonferroni multiple comparison test (**P<0.05). Dots represent individual data points and the line represents the average expression across all samples.
Discussion
Using a proteomic screen, we observed that both AHNAK and ANXA2 are downregulated in three melanoma cell lines compared with primary melanocytes. Consistent with this result, immunohistochemistry was used to show that AHNAK is clearly detectable in melanocytes within human skin, but could not be detected in melanoma cells within a proportion of MILNs. An examination of publicly available microarray data suggests that downregulation of AHNAK mRNA and mutation of the AHNAK gene is a common feature of metastatic melanoma, inversely correlates with patient survival and is associated with early relapse. Finally, we show that AHNAK may be required to maintain cadherin-1 expression levels both in a keratinocyte cell line and in primary melanocytes.
AHNAK, meaning ‘giant’ in Hebrew, was originally identified as a large 700 kDa protein that was differentially expressed in some cancer cell lines 17. In the same year, Hashimoto et al. 18 identified AHNAK as a previously described protein, desmoyokin, a desmosomal plaque protein found in bovine muzzle epithelium. AHNAK expression was subsequently localized to the plasma membrane of keratinocytes in human epidermis 19. Although AHNAK is not an integral membrane protein itself, its expression has been observed at the plasma membrane in a wide variety of cell types because of the formation of complexes with lipid-binding partners. Recently, for example, the three-dimensional crystal structure of an AHNAK, ANXA2, and S100A10 multiprotein complex involved in plasma membrane repair has been solved 20. Notably, AHNAK has also been shown to interact with ANXA2 at the plasma membrane in epithelial Madine Derby Canine Kidney (MDCK) cells upon cell–cell contact and in a calcium-dependent manner 13,14. Here, it is considered to play a role in cortical actin cytoskeletal organization. Upon depletion of AHNAK or ANXA2 MDCK cells failed to remodel their cytoskeleton and failed to adopt the characteristic tall columnar state of a mature epithelial cell 13. Remodeling of the cell membrane cytoskeleton is crucial to the regulation of epithelial cell adhesion. Therefore, the observed loss of AHNAK in melanomas may promote metastasis by affecting cell cytoarchitecture and adhesion.
It has been shown that ANXA2 and its binding partner S100A10 are required to form functional adherens junctions with cadherin-1 15. Through the association of ANXA2 with AHNAK, this suggests a potential link between AHNAK and cadherin-1. Taken together with our results, this raises the possibility that AHNAK, ANXA2 and cadherin-1 are all part of a functional complex involved in regulating cell-to-cell contact. At an early radial growth phase 16,21 and following metastasis 22–25, a significant proportion of melanoma cells show a loss in cadherin-1 expression that correlates with a poor prognosis 24,25. However, an analysis of melanoma cell lines failed to identify mutations in the CDH1 gene 26,27 and mutation rates in this gene in metastatic melanoma tumors are low, ranging from between 2 and 3.3% 12,28. This suggests that epigenetic mechanisms may affect CDH1 expression. We hypothesize that a potential epigenetic mechanism involves a downregulation of AHNAK that results in the destabilization of cadherin-1 protein. This would occur even when CDH1 mRNA levels are normal as is often observed in malignant melanoma (Fig. 6). Although we do not know the cadherin-1 protein status of the tumors represented in Fig. 6, it is likely to be low or absent at the plasma membrane in at least 50% of the tumors on the basis of previous reports 23,25,29.
Other studies in epithelial cells have shown that cadherin-1 is constitutively internalized into early endosomes and recycled back to the plasma membrane 30,31. During an epithelial to mesenchymal transition, which is a hallmark of cancer progression 32, this cycling can be disrupted and cadherin-1 is sorted to the lysosome, where it is subsequently degraded 30. In light of our results, it is possible that AHNAK is functioning as a scaffold protein that is required to maintain cadherin-1 protein expression at the plasma membrane and so prevent its degradation by inhibiting shuttling to the lysosome. Although it is also theoretically possible that AHNAK reduction itself might lead to a loss of cell-to-cell interaction, with secondary reduction of cell surface cadherin-1, in our experiments, AHNAK knockdown did not visibly reduce HaCaT cell interactions. Similarly, CDH1 knockdown did not visibly reduce cell contacts in our experiments. These results mirror the knockdown of CDH1 in MCF10A breast cancer cells 33 and of AHNAK in MDCK cells 13.
Dysregulated expression of both ANXA2 and AHNAK has been associated with tumor formation in other tissues 34–36. Indeed, as stated above, AHNAK was initially identified as a gene downregulated in neuroblastoma cell lines and some tumors 17. Interestingly, Ras mutations that are found in a substantial minority of melanoma patients 37–39 strongly downregulate AHNAK when introduced into rat fibroblasts 40. In addition, AHNAK has recently been shown to function as a tumor suppressor in a transgenic mouse model and its expression was found to be downregulated in 50% of human breast cancer tissues 36. In this case, the mechanism of action was shown to be through modulation of the TGFβ/SMAD signaling pathway. Therefore, it is possible that the downregulation of AHNAK that we observe in melanomas is functioning in more than one way to promote tumor formation.
Although our examination of microarray data did not show significant results in terms of a downregulation in ANXA2 expression (data not shown), other recent studies have observed a downregulation in ANXA2 protein expression levels found in exosomes released by a melanoma cell line compared with normal melanocytes 41, which is in line with our data. In addition, although ANXA2 has been reported to be upregulated in specific cancers 34,42, its downregulation does correlate with some types of cancer including esophageal squamous cell carcinoma 43, osteosarcoma 44, and prostate cancer 45,46. Interestingly, when ANXA2 expression was restored in prostate cancer cells, their migration was inhibited 45. Although the mechanism for this effect is unknown, it is tempting to speculate that it involves the formation of a functional ANXA2/AHNAK/cadherin-1 complex.
Future experiments involving the coculture of keratinocytes with melanocytes will be useful in confirming the involvement of AHNAK in cell-to-cell adhesion in the human epidermis. In addition, confocal microscopy would be useful to fully analyze the effect of AHNAK knockdown on the architecture of the cell cytoskeleton. Analysis of both AHNAK and CDH1 protein and mRNA expression in a large panel of normal and melanoma samples would also be useful to test the theory that AHNAK is required to stabilize cadherin-1 protein. However, our data show that downregulation of AHNAK can occur during the transformation of melanocytes into metastatic melanoma and that it correlates with poor patient prognosis. Our data also suggest a link between AHNAK and cadherin-1 on the cell surface, with AHNAK loss potentially explaining loss of cell surface cadherin-1 in the presence of normal CDH1 mRNA expression.
Acknowledgements
The authors thank Martin Middleditch for expert help with the mass spectrometry experiments and Dan Verdon for helpful discussions throughout the course of this project.
Conflicts of interest
There are no conflicts of interest.
Footnotes
Hilary M. Sheppard and Vaughan Feisst contributed equally to this article.
All supplementary digital content is available directly from the corresponding author.
References
- 1.Bandarchi B, Jabbari CA, Vedadi A, Navab R. Molecular biology of normal melanocytes and melanoma cells. J Clin Pathol 2013; 66:644–648. [DOI] [PubMed] [Google Scholar]
- 2.American Cancer Society. Skin cancer facts. Available at: http://www.cancer.org/cancer/cancercauses/sunanduvexposure/skin-cancer-facts [Accessed 11 December 2015]. [Google Scholar]
- 3.Hill GJ, II, Krementz ET, Hill HZ. Dimethyl triazeno imidazole carboxamide and combination therapy for melanoma. IV. Late results after complete response to chemotherapy (Central Oncology Group protocols 7130, 7131, and 7131A). Cancer 1984; 53:1299–1305. [DOI] [PubMed] [Google Scholar]
- 4.Webster RM, Mentzer SE. The malignant melanoma landscape. Nat Rev Drug Discov 2014; 13:491–492. [DOI] [PubMed] [Google Scholar]
- 5.Haass NK, Smalley KS, Li L, Herlyn M. Adhesion, migration and communication in melanocytes and melanoma. Pigment Cell Res 2005; 18:150–159. [DOI] [PubMed] [Google Scholar]
- 6.Bougnoux AC, Solassol J. The contribution of proteomics to the identification of biomarkers for cutaneous malignant melanoma. Clin Biochem 2013; 46:518–523. [DOI] [PubMed] [Google Scholar]
- 7.Sheppard HM, Verdon D, Brooks AE, Feisst V, Ho YY, Lorenz N, et al. MicroRNA regulation in human CD8+ T cell subsets – cytokine exposure alone drives miR-146a expression. J Transl Med 2014; 12:292. [DOI] [PMC free article] [PubMed] [Google Scholar]
- 8.Irizarry RA, Bolstad BM, Collin F, Cope LM, Hobbs B, Speed TP. Summaries of Affymetrix GeneChip probe level data. Nucleic Acids Res 2003; 31:e15. [DOI] [PMC free article] [PubMed] [Google Scholar]
- 9.Talantov D, Mazumder A, Yu JX, Briggs T, Jiang Y, Backus J, et al. Novel genes associated with malignant melanoma but not benign melanocytic lesions. Clin Cancer Res 2005; 11:7234–7242. [DOI] [PubMed] [Google Scholar]
- 10.Bogunovic D, O’Neill DW, Belitskaya-Levy I, Vacic V, Yu YL, Adams S, et al. Immune profile and mitotic index of metastatic melanoma lesions enhance clinical staging in predicting patient survival. Proc Natl Acad Sci USA 2009; 106:20429–20434. [DOI] [PMC free article] [PubMed] [Google Scholar]
- 11.The Cancer Genome Atlas. 2015. Available at: http://cancergenome.nih.gov/ [Accessed 11 December 2015].
- 12.Trevarton AJ, Mann MB, Knapp C, Araki H, Wren JD, Stones-Havas S, et al. MelanomaDB: a web tool for integrative analysis of melanoma genomic information to identify disease-associated molecular pathways. Front Oncol 2013; 3:184. [DOI] [PMC free article] [PubMed] [Google Scholar]
- 13.Benaud C, Gentil BJ, Assard N, Court M, Garin J, Delphin C, Baudier J. AHNAK interaction with the annexin 2/S100A10 complex regulates cell membrane cytoarchitecture. J Cell Biol 2004; 164:133–144. [DOI] [PMC free article] [PubMed] [Google Scholar]
- 14.De Seranno S, Benaud C, Assard N, Khediri S, Gerke V, Baudier J, Delphin C. Identification of an AHNAK binding motif specific for the Annexin2/S100A10 tetramer. J Biol Chem 2006; 281:35030–35038. [DOI] [PubMed] [Google Scholar]
- 15.Yamada A, Irie K, Hirota T, Ooshio T, Fukuhara A, Takai Y. Involvement of the annexin II-S100A10 complex in the formation of E-cadherin-based adherens junctions in Madin–Darby canine kidney cells. J Biol Chem 2005; 280:6016–6027. [DOI] [PubMed] [Google Scholar]
- 16.Hsu M-Y, Meier FE, Nesbit M, Hsu J-Y, Van Belle P, Elder DE, et al. E-cadherin expression in melanoma cells restores keratinocyte-mediated growth control and down-regulates expression of invasion-related adhesion receptors. Am J Pathol 2000; 156:1515–1525. [DOI] [PMC free article] [PubMed] [Google Scholar]
- 17.Shtivelman E, Cohen FE, Bishop JM. A human gene (AHNAK) encoding an unusually large protein with a 1.2-microns polyionic rod structure. Proc Natl Acad Sci USA 1992; 89:5472–5476. [DOI] [PMC free article] [PubMed] [Google Scholar]
- 18.Hashimoto T, Amagai M, Parry DA, Dixon TW, Tsukita S, Tsukita S, et al. Desmoyokin, a 680 kDa keratinocyte plasma membrane-associated protein, is homologous to the protein encoded by human gene AHNAK. J Cell Sci 1993; 105:275–286. [DOI] [PubMed] [Google Scholar]
- 19.Masunaga T, Shimizu H, Ishiko A, Fujiwara T, Hashimoto T, Nishikawa T. Desmoyokin/AHNAK protein localizes to the non-desmosomal keratinocyte cell surface of human epidermis. J Invest Dermatol 1995; 104:941–945. [DOI] [PubMed] [Google Scholar]
- 20.Dempsey BR, Rezvanpour A, Lee TW, Barber KR, Junop MS, Shaw GS. Structure of an asymmetric ternary protein complex provides insight for membrane interaction. Structure 2012; 20:1737–1745. [DOI] [PubMed] [Google Scholar]
- 21.Cowley GP, Smith ME. Cadherin expression in melanocytic naevi and malignant melanomas. J Pathol 1996; 179:183–187. [DOI] [PubMed] [Google Scholar]
- 22.Kreizenbeck GM, Berger AJ, Subtil A, Rimm DL, Gould Rothberg BE. Prognostic significance of cadherin-based adhesion molecules in cutaneous malignant melanoma. Cancer Epidemiol Biomarkers Prev 2008; 17:949–958. [DOI] [PMC free article] [PubMed] [Google Scholar]
- 23.Danen EH, de Vries TJ, Morandini R, Ghanem GG, Ruiter DJ, van Muijen GN. E-cadherin expression in human melanoma. Melanoma Res 1996; 6:127–131. [DOI] [PubMed] [Google Scholar]
- 24.Lade-Keller J, Riber-Hansen R, Guldberg P, Schmidt H, Hamilton-Dutoit SJ, Steiniche T. E- to N-cadherin switch in melanoma is associated with decreased expression of phosphatase and tensin homolog and cancer progression. Br J Dermatol 2013; 169:618–628. [DOI] [PubMed] [Google Scholar]
- 25.Andersen K, Nesland JM, Holm R, Florenes VA, Fodstad O, Maelandsmo GM. Expression of S100A4 combined with reduced E-cadherin expression predicts patient outcome in malignant melanoma. Mod Pathol 2004; 17:990–997. [DOI] [PubMed] [Google Scholar]
- 26.Poser I, Dominguez D, de Herreros AG, Varnai A, Buettner R, Bosserhoff AK. Loss of E-cadherin expression in melanoma cells involves up-regulation of the transcriptional repressor Snail. J Biol Chem 2001; 276:24661–24666. [DOI] [PubMed] [Google Scholar]
- 27.Huntsman DG, Caldas C. Assignment of the E-cadherin gene (CDH1) to chromosome 16q22.1 by radiation hybrid mapping. Cytogenet Cell Genet 1998; 83:82–83. [DOI] [PubMed] [Google Scholar]
- 28.Hodis E, Watson IR, Kryukov GV, Arold ST, Imielinski M, Theurillat JP, et al. A landscape of driver mutations in melanoma. Cell 2012; 150:251–263. [DOI] [PMC free article] [PubMed] [Google Scholar]
- 29.Shirley SH, Greene VR, Duncan LM, Torres Cabala CA, Grimm EA, Kusewitt DF. Slug expression during melanoma progression. Am J Pathol 2012; 180:2479–2489. [DOI] [PMC free article] [PubMed] [Google Scholar]
- 30.Palacios F, Tushir JS, Fujita Y, D’Souza-Schorey C. Lysosomal targeting of E-cadherin: a unique mechanism for the down-regulation of cell-cell adhesion during epithelial to mesenchymal transitions. Mol Cell Biol 2005; 25:389–402. [DOI] [PMC free article] [PubMed] [Google Scholar]
- 31.Le TL, Yap AS, Stow JL. Recycling of E-cadherin: a potential mechanism for regulating cadherin dynamics. J Cell Biol 1999; 146:219–232. [PMC free article] [PubMed] [Google Scholar]
- 32.Hanahan D, Weinberg RA. Hallmarks of cancer: the next generation. Cell 2011; 144:646–674. [DOI] [PubMed] [Google Scholar]
- 33.Chen A, Beetham H, Black MA, Priya R, Telford BJ, Guest J, et al. E-cadherin loss alters cytoskeletal organization and adhesion in non-malignant breast cells but is insufficient to induce an epithelial-mesenchymal transition. BMC Cancer 2014; 14:552. [DOI] [PMC free article] [PubMed] [Google Scholar]
- 34.Mussunoor S, Murray GI. The role of annexins in tumour development and progression. J Pathol 2008; 216:131–140. [DOI] [PubMed] [Google Scholar]
- 35.Dumitru CA, Bankfalvi A, Gu X, Zeidler R, Brandau S, Lang S. AHNAK and inflammatory markers predict poor survival in laryngeal carcinoma. PloS one 2013; 8:e56420. [DOI] [PMC free article] [PubMed] [Google Scholar]
- 36.Lee IH, Sohn M, Lim HJ, Yoon S, Oh H, Shin S, et al. AHNAK functions as a tumor suppressor via modulation of TGFβ/Smad signaling pathway. Oncogene 2014; 33:4675–4684. [DOI] [PMC free article] [PubMed] [Google Scholar]
- 37.Demunter A, Stas M, Degreef H, De Wolf-Peeters C, van den Oord JJ. Analysis of N- and K-ras mutations in the distinctive tumor progression phases of melanoma. J Invest Dermatol 2001; 117:1483–1489. [DOI] [PubMed] [Google Scholar]
- 38.Albino AP, Nanus DM, Mentle IR, Cordon-Cardo C, McNutt NS, Bressler J, et al. Analysis of ras oncogenes in malignant melanoma and precursor lesions: correlation of point mutations with differentiation phenotype. Oncogene 1989; 4:1363–1374. [PubMed] [Google Scholar]
- 39.Omholt K, Karsberg S, Platz A, Kanter L, Ringborg U, Hansson J. Screening of N-ras codon 61 mutations in paired primary and metastatic cutaneous melanomas: mutations occur early and persist throughout tumor progression. Clin Cancer Res 2002; 8:3468–3474. [PubMed] [Google Scholar]
- 40.Zuber J, Tchernitsa OI, Hinzmann B, Schmitz AC, Grips M, Hellriegel M, et al. A genome-wide survey of RAS transformation targets. Nat Genet 2000; 24:144–152. [DOI] [PubMed] [Google Scholar]
- 41.Xiao D, Ohlendorf J, Chen Y, Taylor DD, Rai SN, Waigel S, et al. Identifying mRNA, microRNA and protein profiles of melanoma exosomes. PLoS One 2012; 7:e46874. [DOI] [PMC free article] [PubMed] [Google Scholar]
- 42.Wang CY, Lin CF. Annexin A2: its molecular regulation and cellular expression in cancer development. Dis Markers 2014; 2014:308976. [DOI] [PMC free article] [PubMed] [Google Scholar]
- 43.Feng JG, Liu Q, Qin X, Geng YH, Zheng ST, Liu T, et al. Clinicopathological pattern and Annexin A2 and Cdc42 status in patients presenting with differentiation and lymphnode metastasis of esophageal squamous cell carcinomas. Mol Biol Rep 2012; 39:1267–1274. [DOI] [PubMed] [Google Scholar]
- 44.Gillette JM, Chan DC, Nielsen-Preiss SM. Annexin 2 expression is reduced in human osteosarcoma metastases. J Cell Biochem 2004; 92:820–832. [DOI] [PubMed] [Google Scholar]
- 45.Liu JW, Shen JJ, Tanzillo-Swarts A, Bhatia B, Maldonado CM, Person MD, et al. Annexin II expression is reduced or lost in prostate cancer cells and its re-expression inhibits prostate cancer cell migration. Oncogene 2003; 22:1475–1485. [DOI] [PubMed] [Google Scholar]
- 46.Yee DS, Narula N, Ramzy I, Boker J, Ahlering TE, Skarecky DW, et al. Reduced annexin II protein expression in high-grade prostatic intraepithelial neoplasia and prostate cancer. Arch Pathol Lab Med 2007; 131:902–908. [DOI] [PubMed] [Google Scholar]