Abstract
Studies have demonstrated that blockade of diacylglycerol acyltransferase 1 (DGAT1) leads to prolonged release of glucagon‐like peptide 1 (GLP‐1) after meal challenge. The current study was undertaken to investigate the mechanism of action underlying the elevated levels of GLP‐1 release following pharmacological inhibition of DGAT1. We utilized a potent, specific DGAT1 inhibitor, compound A, to investigate the changes in intestinal lipid profile in a mouse model after oral administration of the compound and challenge with tracer containing fatty meal. [13C18]‐oleic acid and LC‐MS were employed to trace the fate of dietary fatty acids provided as part of a meal challenge in lean mice. Lipid profiles in plasma, proximal to distal segments of intestine, and feces were evaluated at various times following the meal challenge to study the kinetics of fatty acid absorption, synthesis into complex lipids, and excretion. Pharmacological inhibition of DGAT1 led to reduction of postprandial total and newly synthesized triglyceride (TG) excursion and significant increases in TG and FFA levels in the distal portion of intestine enriched with enteroendocrine L cells. Enhanced levels of FFA and cholesteryl ester were observed via fecal fat profiling. DGAT1 inhibition leads to enhancement of carbon flow to the synthesis of phosphatidylcholine within the intestine. DGAT1 inhibition markedly increases levels of TG and FFA in the distal intestine, which could be the predominant contributor to the prolonged and enhanced postprandial GLP‐1 release. Inactivation of DGAT1 could provide potential benefit in the treatment of dysmetabolic diseases.
Keywords: DGAT1 inhibitor, GLP‐1 release, intestine, lipid partition
Abbreviations
- CE
cholesteryl ester
- CPM
7‐diethylamino‐3‐(4′‐maleimidylphenyl)‐4‐methylcoumarin
- DGAT1
acyl coenzyme A: diacylglycerol acyltransferase 1
- DGAT1i
DGAT1 inhibitor
- DG
diacylglycerol
- FFA
free fatty acid
- GLP‐1
glucagon‐like peptide 1
- GPCR
G protein‐coupled receptors
- HT‐29
human intestinal epithelial cells
- LC‐MS
liquid chromatography–mass spectrometry
- PC
phosphatidylcholine
- TG
triglyceride
- WT
wild type
Introduction
Excess amount of triglyceride (TG) in blood and tissues is a critical mediator in metabolic disease. Abnormal levels of TG in nonadipose tissues such as liver, skeletal muscle, and myocardium present significantly higher risks associated with insulin resistance and cardiovascular disease (Capeau 2008). As a key enzyme involved in the final committed step of TG synthesis, DGAT1 is believed to be the major enzyme responsible for intestinal TG homeostasis.
Postprandial hyperlipidemia occurs following ingestion of a fat‐containing meal. Peak plasma TG levels are observed within 1–2 h of fat consumption and gradually returns to baseline after 4 h in mouse postprandial TG excursion models (Liu et al. 2013). The postprandial dietary fat and its absorption by the small intestine are critical factors in mediating lipid homeostasis physiologically and pathologically. In the small intestine lumen, TG in the diet is hydrolyzed to generate monoacylglycerol and free fatty acids by pancreatic lipase. Free fatty acids and monoacylglycerol are then taken up by enterocytes and subsequently resynthesized into TG. TG is a key component of chylomicrons which are secreted via the lymphatic system into circulation (Mansbach and Gorelick 2007). DGAT1 was initially demonstrated to be a key regulator of dietary fat homeostasis via a genetic approach. DGAT1 null (Dgat1 −/−) mice showed markedly reduced levels of postabsorptive chylomicronemia following an oral lipid challenge, suggesting that DGAT1 deficiency has significant impact on intestinal TG synthesis and excretion in the presence of high dietary fat load (Buhman et al. 2002). Further studies in characterizing the phenotypes of Dgat1 −/− mice also demonstrated the involvement of DGAT1 in mediating dietary fat‐induced elevation and prolonged release of glucagon‐like peptide (GLP‐1) in plasma (Okawa et al. 2009). As the most potent insulinotropic incretin, GLP‐1 is a critical regulator of postprandial glucose‐induced insulin secretion (Visbøll et al. 2003). The mechanism of inhibition of DGAT1 activity on prolonged GLP‐1 release has not been investigated until recently. It has previously been hypothesized that digestion of triglyceride is essential for the release of gut peptide (Matzinger et al. 2000; Ellrichmann et al. 2008). The postprandial levels of newly synthesized TGs and other lipid species in enterocytes are dependent on several key factors including gastric emptying rate, fat digestion and absorption in different segments of the small intestine, metabolic fate of fatty acids, and rate of TG resynthesis, chylomicron assembly/secretion, and the balance of fat intake/fecal excretion. Delay of gastric emptying has been reported in Dgat1 −/− mice (Okawa et al. 2009; Ables et al. 2012). GLP‐1 is released from L cells enriched in the distal portion of intestine. Our hypothesis has been that differences in the partitioning of dietary fat, from proximal to distal portion of the intestine in WT versus Dgat1 −/− mice, may contribute to the observed enhancement of GLP‐1 release. Recently, other researchers presented data that are consistent with this hypothesis (Ables et al. 2012; Maciejewski et al. 2013). However, increased lipid uptake in the distal intestine as a consequence of DGAT1 inactivation was not directly demonstrated. In this report, to better understand the mechanism of action of DGAT1 inhibition on GLP‐1 release, we utilized a stable isotope tracing approach to monitor the processing of dietary fat in different portions of intestine after compound A treatment. Our findings demonstrate that DGAT1 inhibition leads to changes of intestinal lipid homeostasis in a temporal and spatial manner, which could contribute to the increase of GLP‐1 release upon treatment with compound A.
Materials and Methods
Animals
Experiments were performed in male lean C57BL/6 mice. All WT mice were obtained from Taconic Farms (Germantown, NY) and were maintained on standard rodent diet (Teklad 7012; Harlan Teklad) in a 12‐h light/12‐h dark cycles. Animal protocols used in these studies were approved by the Merck Research Laboratories Institutional Animal Care and Use Committee (Rahway, NJ).
Compound A
Compound A was originally from a Japan Tobacco/Tularik collaboration from which it (T863) was further characterized as a tool compound by the Pfizer group (Cao et al. 2011). This compound contains an aminopyrimidine oxazine heterocyclic core appended to a phenylcyclohexane acetic acid pharmacophore. The carboxylic acid moiety has been a standard structure feature on most subsequent DGAT1 inhibitor designs, since it adds solubility and improves pharmacokinetics and potency (DeVita and Pinto, 2013).
DGAT1 enzyme assay
The inhibitory activity of compound A against DGAT1 was measured using DG/oleoyl CoA as substrates at Km concentrations in the presence of CPM (Invitrogen, Carlsbad, CA), which is weakly fluorescent until reacted with free thiols of CoA released from oleoyl CoA after it is incorporated into DG to form TG. IC50s were calculated using either Assay Data Analyzer or GraphPad Prism4 software.
Cellular‐based functional assay
HT‐29 cells (ATCC) were seeded in 96‐well cell culture plates in complete media (McCoy's 5A + 10% FBS) and the media was changed to assay media (McCoy's 5A + 1% FBS) containing 250 μmol/L [13C18]‐oleic acid. Cells were incubated for 2 h in the presence or absence of DGAT1 compound A. The cells were then used for lipid extraction and analysis. Lipids were extracted by adding 60 μL isopropanol containing 1 μmol/L of 13C‐trioleate each well. Plate was sealed and gently shaken for 30 min. dH2O (37.5 μL) was added to a 384‐deep‐well plate (Cat# AB1178) followed by 12.5 μL of cell lysate. Pentanol (60 μL) was then added to each well followed by mixing and LC‐MS analysis as described below.
Mouse postprandial TG (PPTG) excursion test
Male lean C57BL/6 mice (10‐week‐old, n = 8 per group) were grouped based on the body weight and fasted overnight followed by a lipid challenge (10 mL/kg corn oil via oral gavage) 1 h or 18 h post compound A administration. Plasma was collected via tail bleed at various time points following the lipid challenge. Plasma TG levels were measured using colorimetric assay from Thermo Scientific.
Intestinal lipid tracing
Male lean C57BL/6 mice (10–12 weeks old, n = 8 per group) were fasted overnight followed by oral administration of a DGAT1 inhibitor (compound A, 10 mg/kg) 1 h prior to the start of the experiment. At t = 0, a baseline blood sample was collected following which animals were given an oral dose of [13C18]‐oleate (150 mg/kg) mixed with corn oil plus Ensure (1:3; 10 mL/kg) and serial bleeds were collected to measure incorporation into different lipid pools at different time points. [13C18]‐oleate enrichment in different lipid pools was measured in plasma, different segments of intestine, and feces using LC‐MS/MS at the end of the study. GLP‐1 levels were also measured using the terminal plasma samples. The ratio of singly to doubly labeled isotopomers of specific triglycerides was used to infer values for labeling of the oleic acid precursor pool and the concentration of newly synthesized lipid in each compartment (plasma, intestinal tissue, or feces) was determined from the labeling of the product multiplied by its pool size and then corrected for any differences in precursor labeling (McLaren et al. 2013). Feces collected 24 h post tracer were homogenized in entirety in methanol/water at a ratio of 1:4. A 200‐μL aliquot was taken and 180 μL of methanol was added followed by 360 μL of dichloromethane containing isotopically labeled, class‐specific lipid internal standards. Samples were vigorously vortexed and then centrifuged to separate the phases. The lower, organic layer was collected and dried followed by reconstitution in an equivalent volume of 65% acetonitrile, 30% isopropyl alcohol, and 5% water for LC‐MS analysis.
Intestinal tissue samples were prepared for analysis by weighing ~50 mg of tissue into homogenization tubes (Precellys CK‐14, 2 mL). Along with 225 μL of H2O, 0.9 mL of dichloromethane:methanol (2:1) containing internal standards were added to each tube. Samples were homogenized in a Precellys 24 tissue homogenizer at 5000 rpm in 2 × 30 sec bursts with a 15‐sec pause, followed by centrifugation (10,000 rpm (9279 g) for 10 min) to separate the phases. An aliquot of the lower, organic layer was withdrawn and diluted 50‐fold in 65% ACN : 30% IPA : 5% H2O for analysis.
Plasma samples (10 μL) were prepared by precipitation with 90 μL of methanol containing internal standards, followed by dilution with 300 μL of pentanol. Samples were vigorously vortexed for 2 min followed by centrifugation (10,000 rpm for 10 min) to pellet insoluble material and an aliquot of the supernatant was removed for LC‐MS analysis.
Liquid chromatography–mass spectrometry
Liquid chromatography–mass spectrometry analysis was conducted as described previously (McLaren et al. 2011) with minor modifications. In brief, samples were analyzed on an Acquity UPLC‐Xevo TQ triple quadrupole mass spectrometry system (Waters, Milford, MA). Lipids were ionized using ESI; triglycerides and cholesteryl esters were analyzed as the ammoniated adducts [M + NH4]+, phosphatidylcholines as [M + H]+, and free fatty acids as [M − H]− with polarity switching between positive and negative ion modes within a single run. Chromatographic separation was carried out using a 2.1 × 50 mm, 1.9‐μm Hypersil GOLD C18 column (Thermo Scientific, Bridgewater, NJ). A binary solvent system composed of 10 mmol/L ammonium formate in 40% H2O : 60% acetonitrile (v/v, eluent A) and 90% isopropyl alcohol : 10% acetonitrile (v/v, eluent B) was used for the separations. The column was initially conditioned with 90% solvent A. Immediately following injection, the solvent composition was ramped to 95% solvent B over 2.5 min. At 2.6 min the solvent composition was returned to 90% solvent A and held for 0.4 min before the next injection. The flow rate was held constant throughout the run at 400 μL/min and a standard sample injection volume of 5 μL was used in all analyses. Individual molecular lipids were quantified by internal, single‐point calibration using isotopically labeled internal standards as described previously for plasma samples (McLaren et al. 2011). The concentrations of the internal standards in the final sample extract subjected to LC‐MS analysis were kept constant for plasma, feces, and tissue and are as previously reported; the stock concentrations of the internal standards in the organic solvent added during extraction were adjusted as necessary to account for differential dilution factors in the preparation methods used for different samples.
GLP‐1 measurement
Total and active GLP‐1 levels were analyzed using immunoassay kits from Meso Scale Discovery (Gaithersburg, MD) according to the manufacturer's instructions. Plates were read on an MSD Sector instrument for analysis.
Statistical analysis
Statistical analysis of data was conducted by Student's t‐test, one‐way or two‐way ANOVA, using GraphPad Prism4 (Graph‐Pad Software, La Jolia, CA). Data are presented as means ± standard errors of the mean (SEM) and P < 0.05 were considered significant. GraphPad software was also used to determine areas under curve (AUC).
Results
Compound A inhibits TG production in human intestinal epithelial cells
Compound A was synthesized by Merck Research Laboratories (Fig. 1A). The inhibitory activities of compound A against DGAT1 were analyzed with in vitro enzyme assay and exhibited 50% inhibition (IC50) at 16 nmol/L. To determine the functional activities of compound A in cellular systems, human intestinal epithelial cells (HT‐29) were utilized with [13C18]oleic acid as the substrate at 2 Km concentration (200 μmol/L). The incorporation of [13C18]‐oleic acid into fully labeled triolein (i.e., [13C54]‐triolein) was measured by LC‐MS. Under these conditions, compound A inhibited TG synthesis in a concentration‐dependent manner with IC50s at 20 nmol/L (Fig. 1B).
Figure 1.
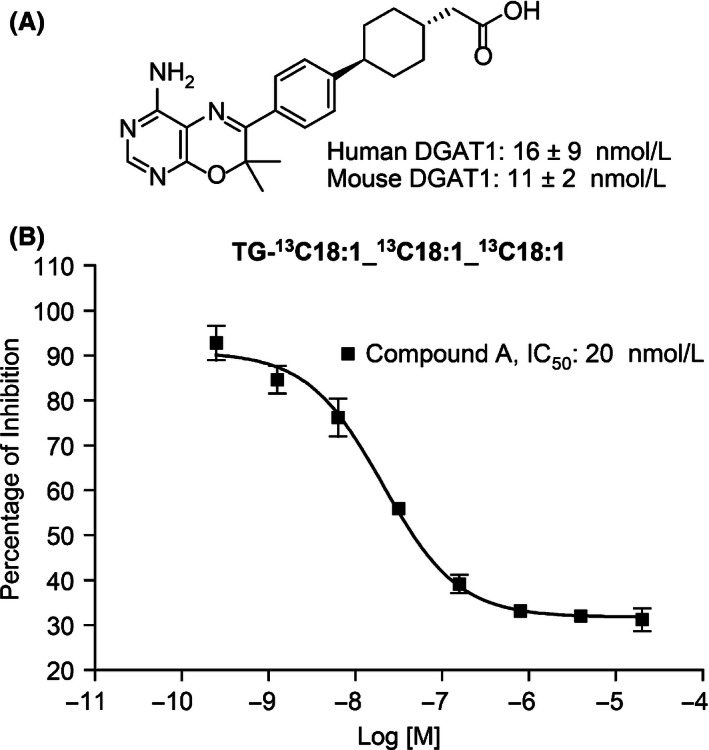
Chemical structures and cellular activities of compound A. (A) Chemical structure of compound A. (B) Compound concentration‐dependent inhibition of TG synthesis in human intestinal epithelial HT‐29. Cells were preincubated with various concentrations of compound A for 30 min followed by [13C18]‐oleic acid incubation. A representative labeled TG species, TG‐[13C18]18:1‐[13C18]18:1‐[13C18]18:1, was used to represent TG levels in the presence of different concentrations of compound A. Results are expressed as mean ± SEM. IC50: 20 ± 0.3 nmol/L.
Compound A reduces postprandial plasma TG levels in lean mice
Pharmacological inhibition of DGAT1 has been shown to decrease postprandial TG excursion into circulation (Liu et al. 2013; Maciejewski et al. 2013). In this study, we first evaluated the effect of compound A, a specific DGAT1 inhibitor as demonstrated by its over 1000‐fold weaker inhibitory activities against other acyltransferases (data not shown), on the excursion of total TG into plasma at both compound peak (1 h post compound dose) and trough levels (18 h post compound administration). Mice were dosed with corn oil and plasma TG was measured at different time points post fat challenge. Plasma TG reached peak levels at 1 h post fat challenge in the vehicle‐treated group. Both 1 and 10 mg/kg doses of compound A significantly reduced plasma TG excursion at 1 h post compound administration, whereas only 10 mg/kg compound A was efficacious at trough level of compound A (Fig. 2A–B), which is consistent with the compound exposure levels as shown in the pharmacological kinetic study of compound A (data not shown).
Figure 2.
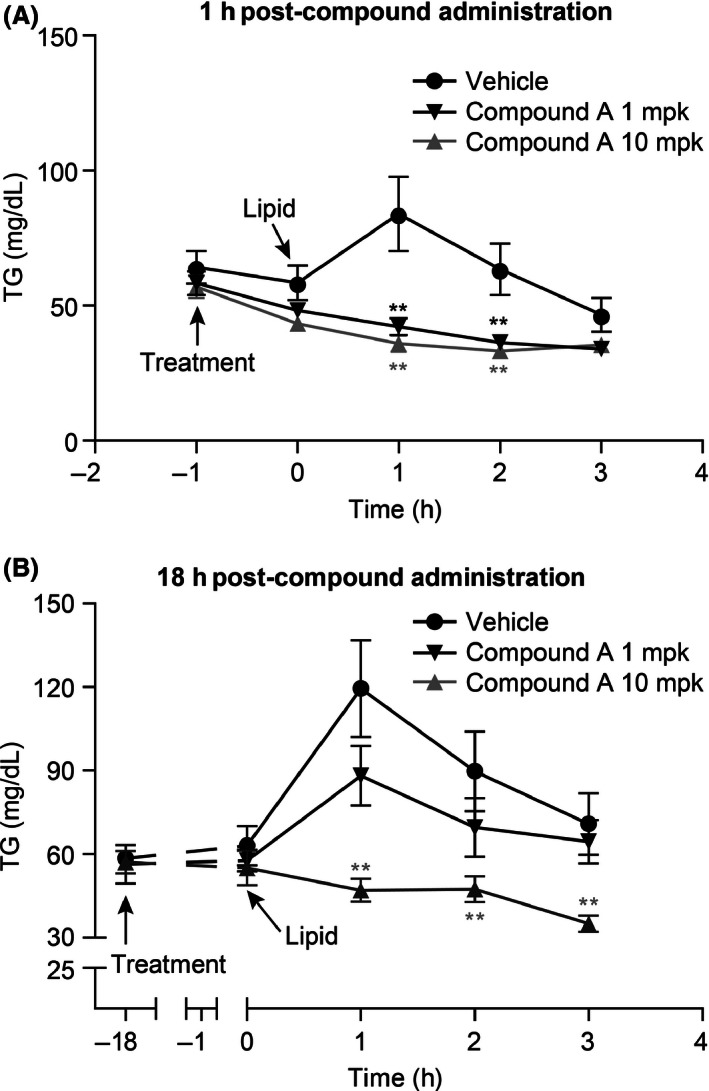
Inhibitory effect on postprandial TG excursion by compound A. (A) Compound A reduced postprandial TG excursion in a dose‐dependent manner 1 h post administration of compound A in lean mice (which coincides with peak levels of plasma compound concentration). (B) Reduction in plasma TG levels 18 h after administration of compound A (coinciding with trough levels of plasma compound concentration). Results are expressed as mean ± SEM (n = 8 per group). **P < 0.005. The statistical analysis was performed using one‐way ANOVA for TG excursion.
Compound A reduced postprandial plasma newly synthesized TG levels
To further determine the effect of DGAT1 inhibition on the release of newly synthesized TG into plasma, mice were dosed with compound A followed by administration of a fatty meal containing [13C18]‐oleate as a tracer to monitor the carbon flow upon inactivation of DGAT1. Data for a specific triglyceride containing one saturated and two unsaturated fatty acids (TG 52:2, containing one 16:0 and two‐18:1 fatty acid side chains) are shown to represent the bulk pool. Other predominant forms of labeled TG were also measured in these studies and similar results were obtained (data not shown). The levels of newly synthesized TG were measured at different time points after tracer administration. The maximum TG excursion in these experiments was observed at 1 h post tracer challenge in the vehicle‐treated group, whereas TG excursion was significantly diminished upon treatment with 10 mg/kg compound A (Fig. 3A–B). These results indicate attenuation of TG containing chylomicron secretion upon inhibition of DGAT1.
Figure 3.
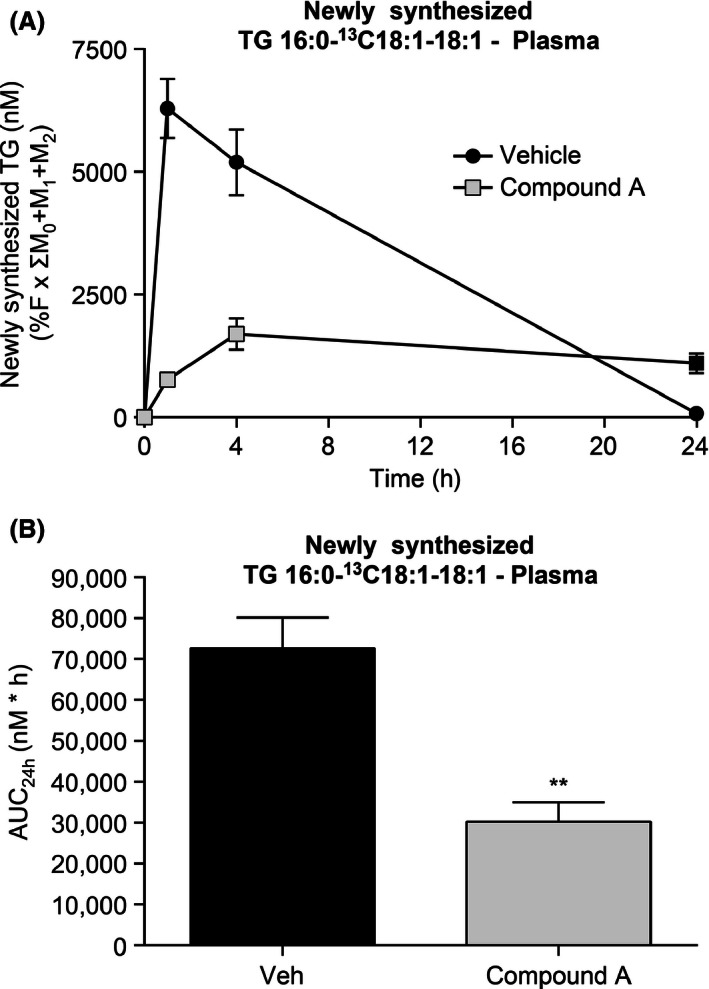
Reduction of newly synthesized TG 52:2 in plasma of lean C57Bl/6 mice by compound A. (A) Administration of compound A decreased the concentration of newly synthesized TG 52:2 in plasma after challenge with meal containing [13C18]oleate. (B) Changes in the area under curve (AUC) of newly synthesized plasma TG 52:2 following treatment with compound A. **P < 0.005. The statistical analysis was performed using one‐way ANOVA.
Inactivation of DGAT1 by compound A led to prolonged release of GLP‐1 and delay of gastric emptying
GLP‐1 is derived from the transcription product of the proglucagon gene. The major physiological source of GLP‐1 is from the intestinal L cells. Both GLP‐1‐(7‐37) and GLP‐1‐(7‐36) NH2 are the biologically active forms of GLP‐1. GLP‐1 secretion by ileal L cells is dependent on the presence of nutrients in the lumen of the small intestine.
Meal loading increases GLP‐1 release from enteroendocrine L cells. Blockade of DGAT1 activity by compound A led to significantly enhanced and prolonged GLP‐1 secretion upon meal challenge. Compound A treatment resulted in increases for both total and active GLP‐1 levels, and this prolonged increase lasted for at least 4 h (Fig. 4A, B). Delayed gastric emptying was also observed at 1 and 4 h post meal challenge, as demonstrated by the increased stomach weight after compound A treatment (Fig. 4C).
Figure 4.
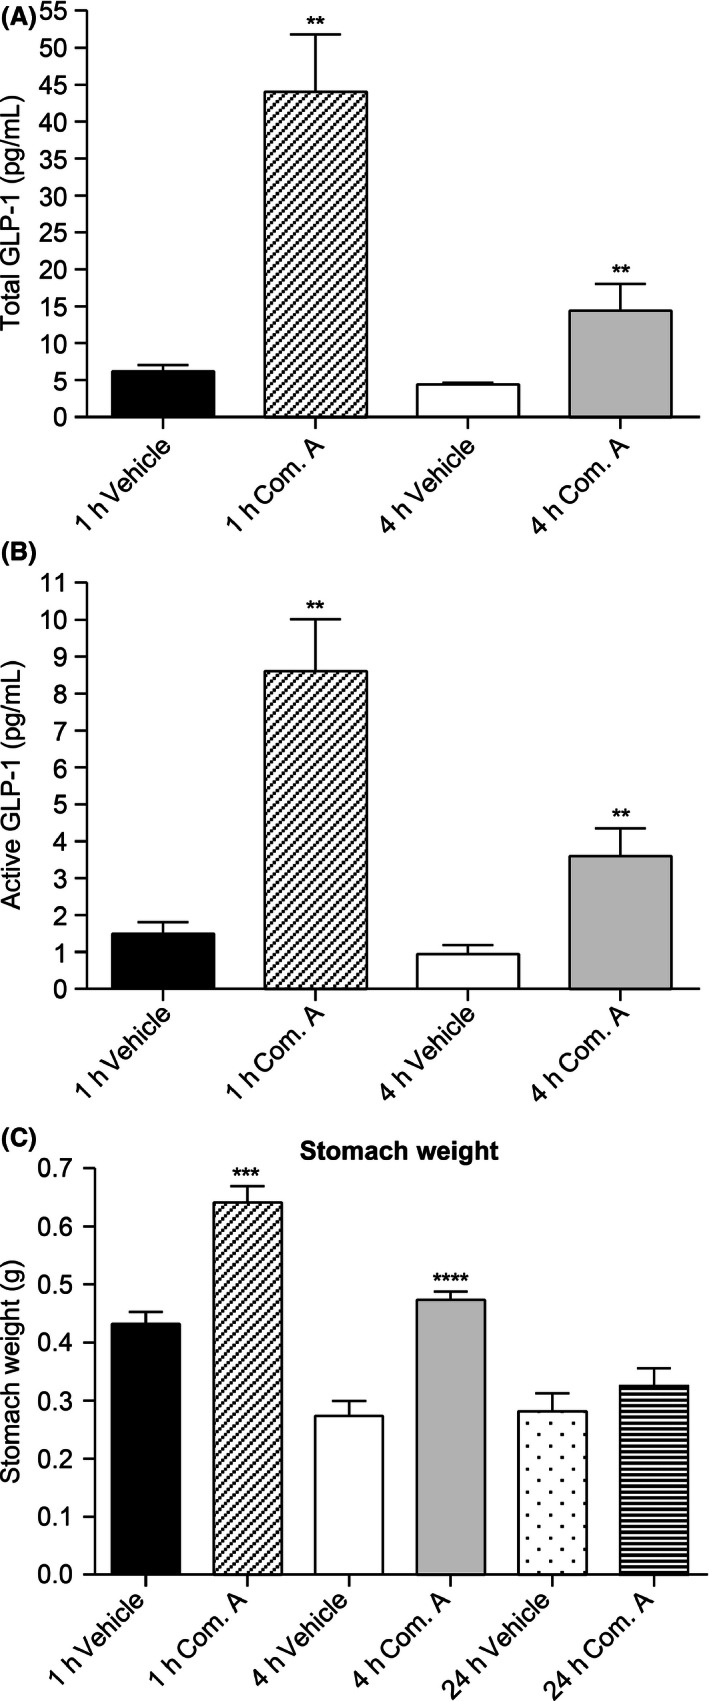
Postprandial GLP‐1 release and gastric emptying after vehicle or compound A treatment. (A) Increased total GLP‐1 levels upon DGAT1 inhibition by compound A treatment. (B) Inactivation of DGAT1 by compound A led to prolonged postprandial release of active GLP‐1. (C) Delayed gastric emptying in compound A‐treated mice compared with vehicle‐treated group. **P < 0.005, ***P < 0.0001, ****P < 0.00005. The statistical analysis was performed using Student's t‐test.
Compound A affected the levels of labeled TG in different portions of intestine
To further evaluate the effect of compound A treatment on the levels of newly formed lipid in the proximal (duodenum and jejunum) and distal (ileum) portions of intestine, intestinal segments were collected at 2, 4, and 24 h post tracer/meal challenge and the levels of newly formed lipid were measured by LC‐MS/MS. Levels of newly formed triglyceride were significantly reduced in duodenal and jejunal portions of intestine after treatment with compound A (Fig. 5A, B). Conversely, the levels of newly formed triglyceride were markedly enhanced in the ileal portion of the intestine in compound A‐treated animals at both 1 and 4 h post tracer administration (Fig. 5C). Interestingly, levels of newly formed phosphatidylcholine were modestly increased in the duodenum and jejunum at 1 h following the lipid challenge, and substantially increased in the ileum at 1 and 4 h in the compound A‐treated animals (Fig. 5D–F), whereas no significant changes were observed for the levels of cholesterol ester in distal portion of the gut (Fig. 5G–I).
Figure 5.
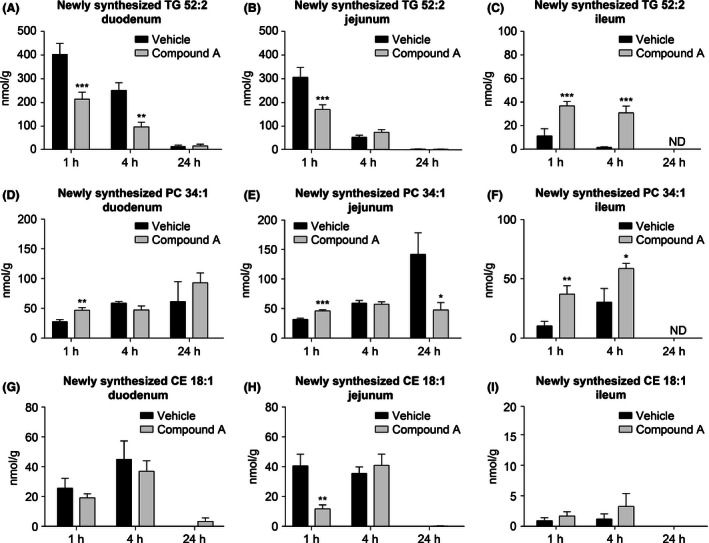
Distribution of newly synthesized lipid from proximal to distal intestine of C57Bl/6 lean mice following treatment with compound A. The concentration of newly synthesized TG 52:2 in the duodenum, jejunum, and ileum are shown in (A), (B), and (C), respectively. Tissue concentrations of newly synthesized phosphatidylcholine 34:1 are shown in (D), (E), and (F). Concentrations of newly synthesized cholesteryl oleate are shown in (G), (H), and (I). *P < 0.02,**P < 0.005, ***P < 0.0009. The statistical analysis was performed using Student's t‐test.
A reduction of TG synthesis in the proximal portions of intestine could result in higher levels of the [13C18]‐oleate tracer reaching the distal portion of the intestine. Indeed, the labeling of the oleic acid precursor pool indicates that the free oleate pool was enriched with the [13C18] tracer in the distal intestine (ileum) in the compound A‐treated animals, whereas no significant difference in enrichment was observed in the duodenum and jejunum (Fig. 6A–C). The increase in [13C18]‐oleate uptake in the distal portion of intestine following treatment with DGAT1 inhibitor could contribute to the stimulation of GLP‐1 release.
Figure 6.
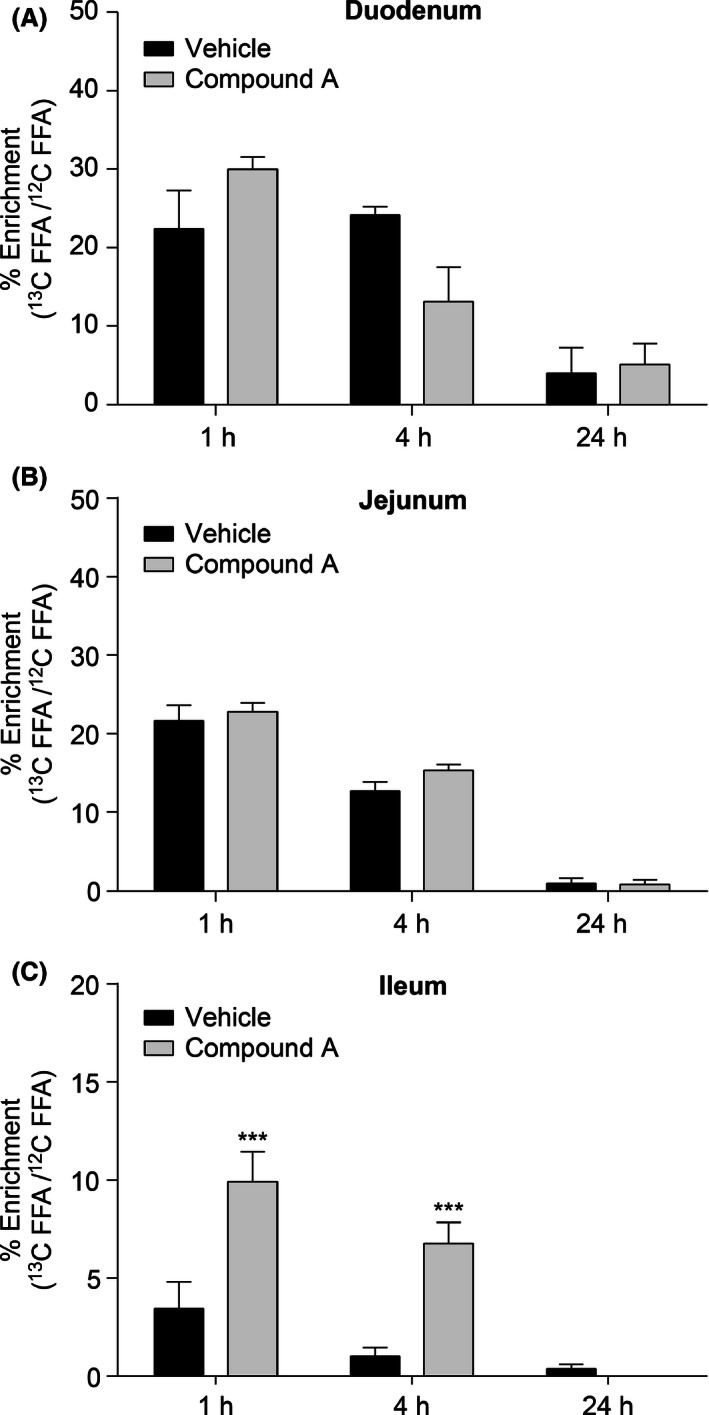
Enrichment of the free oleic acid pool in proximal to distal segments of intestine following uptake of the orally administered [13C18] fatty acid tracer. Duodenal (A) and jejunal (B) uptake of [13C18]‐oleate was comparable between DGAT1 inhibitor‐ and vehicle‐treated animals. Increased uptake of the [13C18] fatty acid was observed in the ileum following DGAT1 inhibition (C). C57/Bl/6 lean mice were used in this study. **P < 0.005. The statistical analysis was performed using two‐way ANOVA.
Lipid analysis in feces
To further evaluate post meal lipid flow after compound A treatment, feces were collected post 24 h following the tracer containing meal challenge. The concentrations (nmol/g feces) of endogenous and [13C18]‐labeled cholesterol ester and free fatty acid were significantly increased in the feces of DGAT1 inhibitor‐treated animals, whereas the levels of triglyceride remained unchanged (Fig. 7A–E).
Figure 7.
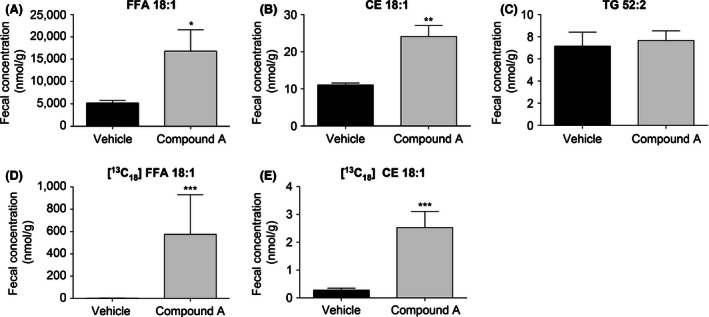
Postprandial fecal lipid profile upon blockade of DGAT1 by compound A. The concentration of endogenous and [13C18]‐labeled free fatty acid in 24‐h fecal collections was increased relative to vehicle controls following treatment with compound A (A and D). Fecal concentration of cholesteryl ester was also increased as a result of DGAT1 inactivation (B and E), whereas the concentration of fecal triglyceride was unchanged (C). **P < 0.005. The statistical analysis was performed using Student's t‐test.
Discussion and Conclusions
Postprandial GLP‐1 release is important in mediating insulin secretion and glucose homeostasis. In the L cells, GLP‐1 is generated by tissue‐specific posttranslational processing of the proglucagon gene (Drucker 2002). The L cell is an open‐type intestinal epithelial endocrine cell that directly contacts luminal nutrients through its basolateral surface. Accordingly, GLP‐1 secretion from intestinal L cells is stimulated by a variety of nutrient, neural, and endocrine factors. Nutrients, including glucose, triglyceride, and fatty acids, are all known to stimulate GLP‐1 secretion. Ingestion of a meal rich in fats and carbohydrates is the primary physiologic stimulus for GLP‐1 secretion (Brubaker 2006). However, the levels of glucose that actually reach the distal intestine are very low (Ferraris et al. 1990), and glucose is likely to exert only modest effects on the L cells for GLP‐1 secretion under normal physiological conditions. Similarly, the majority of protein absorption by the gastrointestinal (GI) tract occurs proximally, suggesting amino acids are not the primary factor to drive GLP‐1 release, although amino acids can directly stimulate L cells (Reimer et al. 2001). In contrast, fatty acids reach the distal intestine at high levels (Lin et al. 1996) and direct placement of fat into the ileum has been shown to stimulate GLP‐1 release (Roberge and Brubaker 1993). Long‐chain fatty acids, particularly of mono‐ and polyunsaturated fatty acids, stimulate GLP‐1 release when applied directly to L cells, through mechanisms that appear to involve GPR120 (Hirasawa et al. 2005), GPR40 (Luo et al., 2012), and/or PKCθ (Rocca and Brubaker 1995; Iakoubov et al. 2007).
Digestion of triglyceride in the gut has been hypothesized to be essential for the release of GLP‐1 (Ellrichmann et al. 2008). Upon digestion by pancreatic lipase into monoacylglycerol and fatty acids in the gut lumen, reassembly of TG occurs in the enterocytes, and DGAT1 is the critical enzyme for the resynthesis and/or secretion of TG‐rich lipoproteins from intestine. It has been shown that Dgat1 −/− mice demonstrate significantly reduced postprandial hypertriglyceridemia, delayed gastric emptying, and elevated GLP‐1 secretion (Buhman et al. 2002; Okawa et al. 2009). Although several reports have linked DGAT1 inactivation to prolonged, postprandial release of GLP‐1, the mechanism underlying this effect has not been widely investigated. Recently, researchers reported on a series of experiments using radioisotopes to explore the effects of DGAT1 inhibition on gastric motility and chylomicron assembly (Ables et al. 2012; Maciejewski et al. 2013). Ables et al. showed that DGAT1 inhibition was associated with increased gastric retention of the [3H] retinol tracer administered and with elevated levels of GLP‐1 in the plasma at 6 h post meal challenge. The same group also administered [14C] triolein and [3H] retinol to WT and DGAT1 −/− mice as part of a meal challenge and analyzed levels of these analytes in intestinal tissue segments and feces. Their results showed that radiolabeled triolein and retinoid were reduced in all sections of the intestine following DGAT1 inhibition, but that fecal levels of these analytes were elevated. The authors hypothesized that decreased fat absorption in the proximal intestine, as a result of DGAT1 inactivation, could result in increased free fatty acid and monoglyceride absorption in the distal intestine with subsequent stimulation of GLP‐1 release. Maciejewski et al. adopted a similar approach and demonstrated translatable pharmacology of DGAT1 inhibitor (PF‐04620110) on postprandial inhibition of TG and vitamin A absorption from rodents to human subjects.
We had formulated a similar hypothesis based on studies in our laboratories and the present studies were undertaken to investigate this possible mechanism. We elected to give a stable isotope‐labeled fatty acid ([13C18]‐oleate) so that we could track de novo synthesis of lipid as well as temporal and spatial absorption of the tracer along the intestinal tract. This approach also allowed us to explore trafficking of the fatty acid substrate into multiple lipid pools and investigate the effects of compound A on the lipid partitioning. Our studies demonstrated decreased triglyceride synthesis in the proximal intestine and increased synthesis of phosphatidylcholine in vivo upon compound A treatment (Fig. 5). Conversely, uptake of the free fatty acid substrate was enhanced in the distal intestine (Fig. 6) and this was also reflected in increased triglyceride synthesis in the ileum. As a result of L‐cell stimulation by the free fatty acid, increased levels of GLP‐1 were observed in the plasma of compound A‐treated animals (Fig. 4). Furthermore, we have conducted the lipid trafficking studies using other DGAT1 inhibitors with distinct chemical structures from compound A and similar results were obtained for various DGAT1 inhibitors in these studies. Consistently, Maciejewski reported a similar observation with another DGAT1 inhibitor (PF‐04620110).
It was demonstrated in our previous studies that DGAT1 expression was not detectable in L cells (Liu et al. 2013) and this observation rules out a potential direct role of compound A on increased GLP‐1 secretion from L cells. The delay in gastric emptying observed here could be theorized to contribute, at least partially, to the reduced intestinal accumulation of TG observed in compound A‐treated or intestine Dgat1−/− mice and to increased plasma levels of GLP‐1. However, attenuation of TG excursion cannot be rescued via bypassing the stomach through duodenal oil injection or inhibiting the receptor for GLP‐1 (Ables et al. 2012), indicating an essential role of DGAT1 in regulating intestinal TG resynthesis, chylomicron assembly, and secretion. Although we cannot rule out a contribution of delayed gastric emptying to increased GLP‐1 excursion, our data support a role for increased lipid accumulation in the distal intestine in mediating this response.
Additional mechanisms may also be involved in mediating the GLP‐1 response observed upon DGAT1 inactivation. For example, decreased expression of fatty acid transporters on the proximal intestinal lumen could also contribute to this observation and we have consistently observed lower expression of CD36 in proximal intestine in compound A‐treated mice (data not shown). The molecular pathways for free fatty acid sensing in the GI tract have been further elucidated by identification and characterization of fatty acid binding G protein‐coupled receptors (GPCRs) expressed on L cells in the distal intestine. Several GPCRs have been shown to have a GLP‐1 secretagogue function, including GPR119, GPR120, GPR40, GPR41, and GPR43 (Hirasawa et al. 2005; Edfalk et al. 2008; Kaemerer et al. 2010). GPR119 was demonstrated to induce GLP‐1 secretion in enteroendocrine cells upon stimulation with its agonists, AR231453, Arena B3, and MBX‐2982. Enhanced GLP‐1 release was also observed in mice treated with a GPR119 agonist (Chu et al. 2008; Lan et al. 2012). GPR120 and GPR40 mediated calcium response and GLP‐1 release upon stimulation with their cognate agonistic FFAs (Hirasawa et al. 2005; Luo et al., 2012). In contrast to GPR40 and GPR120, which are Gαq‐coupled receptors and function through the inositol 1, 4, 5‐triphosphate/calcium pathway, GPR119 is coupled to Gαs and activates adenylyl cyclase/cAMP cascade. GPR120 and GPR40, activated by medium to long‐chain fatty acids, are expressed in human and mouse GI tract and is abundantly expressed in enteroendocrine STC‐1 and GLUTag cells. FFAs, acting as signaling molecules, promote the GLP‐1 secretagogue functions via their corresponding receptors expressed in L cells. Administration of a fatty acid mixture directly into the ileum of rats has also been demonstrated to stimulate incretin secretion by L cells (Rocca et al. 2001). Further studies are needed to investigate possible links between the enhanced levels of TG and FFA in the distal gut upon DGAT1 inhibition which we have demonstrated here and concomitant stimulation of these GPCRs.
Disclosures
We certify that there is no conflict of interest regarding the materials discussed in the manuscript.
Liu J., McLaren D. G., Chen D., Kan Y., Stout S. J., Shen X., Murphy B. A., Forrest G., Karanam B., Sonatore L., He S., Roddy T. P., Pinto S.. Potential mechanism of enhanced postprandial glucagon‐like peptide‐1 release following treatment with a diacylglycerol acyltransferase 1 inhibitor, 2015, Pharma Res Per, 3 (6), 2015, e00193, doi: 10.1002/prp2.193
Correction added on 28 December 2015 after first online publication: The article title has been slightly modified for clarity.
References
- Ables GP, Yang KJ, Vogel S, Hernandez‐Ono A, Yu S, Yuen JJ, et al. (2012). Intestinal DGAT1 deficiency markedly reduces postprandial triglyceride and retinyl ester excursions by inhibiting chylomicron secretion and delaying gastric emptying. J Lipid Res 53: 2364–2379. [DOI] [PMC free article] [PubMed] [Google Scholar]
- Brubaker PL (2006). The glucogan‐like peptides: pleiotropic regulators of nutrient homeostasis. Ann N Y Acad Sci 1070: 10–26. [DOI] [PubMed] [Google Scholar]
- Buhman KK, Sj Smith, Stone SJ, Repa JJ, Wong JS, Knapp FF Jr, et al. (2002). DGAT1 is not essential for intestinal triacylglycerol absorption or chylomicron synthesis. J Biol Chem 277: 25474–25479. [DOI] [PubMed] [Google Scholar]
- Cao J, Zhou Y, Peng H, Huang X, Stahler S, Suri V, et al. (2011). Targeting acyl‐CoA:diacylglycerol acyltransferase 1 (DGAT1) with small molecule inhibitors for the treatment of metabolic diseases. J Biol Chem 286: 41838–41851. [DOI] [PMC free article] [PubMed] [Google Scholar]
- Capeau J (2008). Insulin resistance and steatosis in humans. Diabetes Metab 34: 649–657. [DOI] [PubMed] [Google Scholar]
- Chu ZL, Carroll C, Alfonso J, Gutierrez V, He H, Lucman A, et al. (2008). A role for intestinal endocrine cell‐expressed G protein‐coupled receptor 119 in glycemic control by enhancing glucagon‐like peptide‐1 and glucose‐dependent insulinotropic peptide release. Endocrinology 149: 2038–2047. [DOI] [PubMed] [Google Scholar]
- DeVita RJ, Pinto S (2013). Current status of the research and development of diacylglycerol o‐acyltransferase 1 (DGAT1) inhibitors. J Med Chem 56: 9820–9825. [DOI] [PubMed] [Google Scholar]
- Drucker DJ (2002). Biological actions and therapeutic potential of the glucagon like peptides. Gastroenterology 122: 531–544. [DOI] [PubMed] [Google Scholar]
- Edfalk S, Steneberg P, Edlubd H (2008). GPR40 is expressed in enteroendocrine cells and mediates free fatty acid stimulation of incretin secretion. Diabetes 57: 2280–2287. [DOI] [PMC free article] [PubMed] [Google Scholar]
- Ellrichmann M, Kapelle M, Ritter PR, Holst JJ, Herzig KH, Schmidt WE, et al. (2008). Orlistat inhibition of intestinal lipase acutely increases appetite and attenuates postprandial glucagon‐like‐peptide‐1(7‐36)‐amide‐1, cholecystokinin, and peptide YY concentrations. J Clin Endocrinol Metab 93: 3995–3998. [DOI] [PubMed] [Google Scholar]
- Ferraris RP, Yasharpour S, Lloyd KCK, Mirzayan R, Diamond JM (1990). Luminal glucose concentrations in the gut under normal conditions. Am J Physiol Gastrointest Liver Physiol 259: G822–G837. [DOI] [PubMed] [Google Scholar]
- Hirasawa A, Tsumaya K, Awaji T, Katsuma S, Adachi T, Tamada M, et al. (2005). Free fatty acids regulate gut incretin glucagon‐like peptide‐1 secretion through GPR120. Nat Med 11: 90–94. [DOI] [PubMed] [Google Scholar]
- Iakoubov R, Izzo A, Yeung A, Whiteside CI, Brubaker PL (2007). Protein kinase C zeta Is required for oleic acid‐induced secretion of glucagon‐like peptide‐1 by intestinal endocrine L cells. Endocrinology 148: 1089–1098. [DOI] [PubMed] [Google Scholar]
- Kaemerer E, Plum P, Klaus C, Weiskirchen R, Liedtke C, Adolf M, et al. (2010). Fatty acid binding receptors in intestinal physiology and pathophsiology. World J Gastrointest Pathophysiol 1: 147–153. [DOI] [PMC free article] [PubMed] [Google Scholar]
- Lan H, Lin HV, Wang CF, Wright MJ, Xu S, Kang L, et al. (2012). Agonists at GPR119 mediate secretion of GLP‐1 from mouse enteroendocrine cells through glucose‐independent pathways. Br J Pharmacol 165: 2799–2807. [DOI] [PMC free article] [PubMed] [Google Scholar]
- Lin HC, Zhao XT, Wang L (1996). Fat absorption is not complete by midgut but is dependent on load of fat. Am J Physiol 271: G62–G67. [DOI] [PubMed] [Google Scholar]
- Liu J, Gorski J, Chen D, Chen S, Forrest G, Itoh Y, et al. (2013). Pharmacological inhibition of diacylglycerol acyltransferase 1 reduces body weight and modulates gut peptide release – potential insight into mechanism of action. Obesity 21: 1406–1415. [DOI] [PubMed] [Google Scholar]
- Luo J, Swaminath G, Brown SP, Zhang J, Guo Q, Chen M, et al. (2012). A potent class of GPR40 full agonists engages the enteroinsular axis to promote glucose control in rodents. PLoS ONE 7: e46300. [DOI] [PMC free article] [PubMed] [Google Scholar]
- Maciejewski BS, LaPerle JL, Chen D, Ghosh A, Zavadoski WJ, McDonald TS, et al. (2013). Pharmacological inhibition to examine the role of DGAT1 in dietary lipid absorption in rodents and humans. Am J Physiol Gastrointest Liver Physiol 304: G958–G969. [DOI] [PubMed] [Google Scholar]
- Mansbach CM, Gorelick F (2007). Development and physiological regulation of intestinal lipid absorption. II. Dietory lipid absorption, complex lipid synthesis, and the intracellular packaging and secretion of chylomicrons. Am J Physiol Gastrointest Liver Physiol 293: G645–G650. [DOI] [PubMed] [Google Scholar]
- Matzinger D, Degen L, Drewe J, Meuli J, Duebendorfer R, Ruckstuhl N, et al. (2000). The role of long chain fatty acids in regulating food intake and cholecystokinin release in humans. Gut 46: 688–693. [DOI] [PMC free article] [PubMed] [Google Scholar]
- McLaren DG, He T, Wang S‐P, Mendoza V, Rosa R, Gagen K, et al. (2011). The use of stable‐isotopically labeled oleic acid to interrogate lipid assembly in vivo: assessing pharmacological effects in preclinical species. J Lipid Res 52: 1150–1161. [DOI] [PMC free article] [PubMed] [Google Scholar]
- McLaren DG, Cardasis HL, Stout SJ, Wang SP, Mendoza V, Castro‐Perez JM. (2013). The use of [13C18] oleic acid and mass isotopomer distribution analysis to study synthesis of plasma triglycerides in vivo: analytical and experimental considerations. Anal Chem 85: 6287–6294. [DOI] [PubMed] [Google Scholar]
- Okawa M, Fujii K, Ohbuchi K, Okumoto M, Aragane K, Sato H, et al. (2009). Role of MGAT2 and DGAT1 in the release of gut peptides after triglyceride ingestion. Biochem Biophys Res Commun 390: 377–381. [DOI] [PubMed] [Google Scholar]
- Reimer RA, Darimont C, Gremlich S, Nicolas‐Métral V, Rüegg UT, Macé K (2001). A human cellular model for studying the regulation of glucagon‐like peptide‐1 secretion. Endocrinology 142: 4522–4528. [DOI] [PubMed] [Google Scholar]
- Roberge JN, Brubaker PL (1993). Regulation of intestinal proglucagon‐derived peptide secretion by glucose‐dependent insulinotropic peptide in a novel enteroendocrine loop. Endocrinology 133: 233–240. [DOI] [PubMed] [Google Scholar]
- Rocca AS, Brubaker PL (1995). Stereospecific effects of fatty acids on proglucagon‐derived peptide secretion in fetal rat intestinal cultures. Endocrinology 136: 5593–5599. [DOI] [PubMed] [Google Scholar]
- Rocca AS, LaGreca J, Kalitsky J, Brubaker PL (2001). Monosaturated fatty acid diets improve glycemic tolerance through increased secretion of glucagon‐like peptide‐1. Endocrinology 142: 1148–1155. [DOI] [PubMed] [Google Scholar]
- Visbøll T, Krarup T, Madsbad S, Holst JJ (2003). Both GLP‐1 and GIP are insulinotropic at basal and postprandial glucose levels and contribute nearly equally to the incretin effect of a meal in healthy subjects. Regul Pept 114: 115–121. [DOI] [PubMed] [Google Scholar]


