Abstract
Purpose
The Idiopathic Intracranial Hypertension Treatment Trial (IIHTT) showed that acetazolamide provided a modest, significant improvement in mean deviation (MD). Here, we further analyze visual field changes over the 6-month study period.
Methods
Of 165 subjects with mild visual loss in the IIHTT, 125 had perimetry at baseline and 6 months. We evaluated pointwise linear regression of visual sensitivity versus time to classify test locations in the worst MD (study) eye as improving or not; pointwise changes from baseline to month 6 in decibels; and clinical consensus of change from baseline to 6 months.
Results
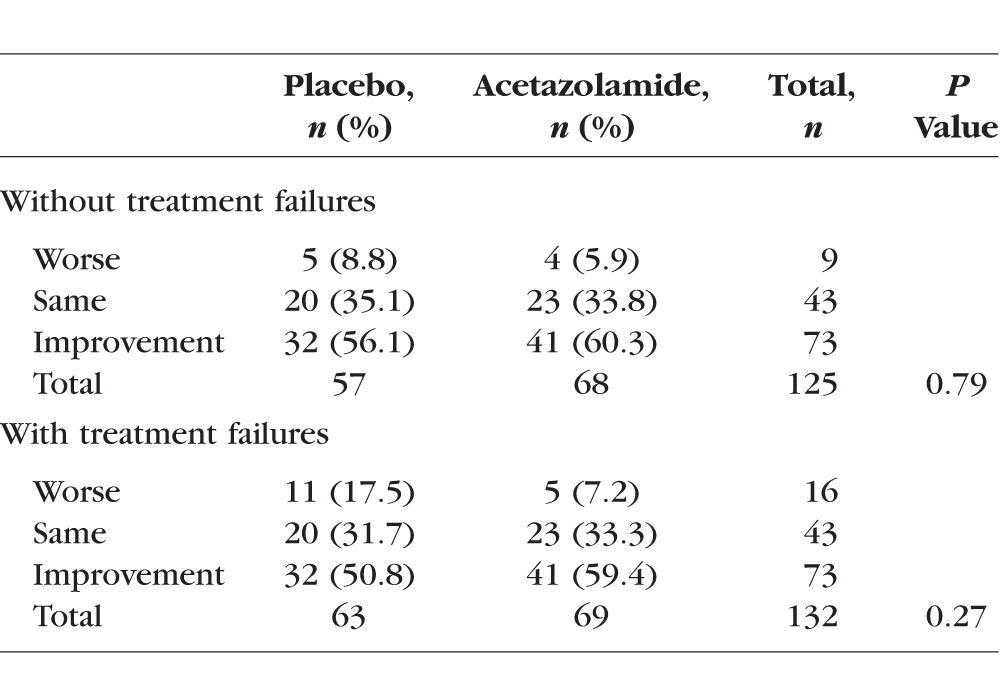
The average study eye had 36 of 52 test locations with improving sensitivity over 6 months using pointwise linear regression, but differences between the acetazolamide and placebo groups were not significant. Pointwise results mostly improved in both treatment groups with the magnitude of the mean change within groups greatest and statistically significant around the blind spot and the nasal area, especially in the acetazolamide group. The consensus classification of visual field change from baseline to 6 months in the study eye yielded percentages (acetazolamide, placebo) of 7.2% and 17.5% worse, 35.1% and 31.7% with no change, and 56.1% and 50.8% improved; group differences were not statistically significant.
Conclusions
In the IIHTT, compared to the placebo group, the acetazolamide group had a significant pointwise improvement in visual field function, particularly in the nasal and pericecal areas; the latter is likely due to reduction in blind spot size related to improvement in papilledema. (ClinicalTrials.gov number, NCT01003639.)
Keywords: idiopathic intracranial hypertension, pseudotumor cerebri, perimetry, visual field, clinical trial
The Idiopathic Intracranial Hypertension Treatment Trial (IIHTT) is a multicenter randomized, double-blind, placebo-controlled study that evaluated the efficacy of a weight reduction and low-sodium diet plus acetazolamide versus the diet plus placebo in reducing or reversing visual field loss in subjects with mild visual loss. We found the acetazolamide group had significantly improved perimetric mean deviation (MD), papilledema grade, quality of life measures, and cerebrospinal fluid (CSF) pressure.1
It is well known that visual field defects in idiopathic intracranial hypertension (IIH) can be improved with treatment2 and can be due to a variety of mechanisms. The main mechanism is thought to be CSF pressure–related disruption of axonal transport3,4 leading to intraneuronal optic nerve ischemia at the level of the optic nerve head. Another common mechanism is enlargement of the blind spot; this type of visual loss, mostly from peripapillary hyperopia, is refractive in origin.5 Less common causes of visual loss are fluid tracking from the optic disc to the fovea (neurosensory detachment) and the refractive visual loss related to choroidal folds.6
A study of patients with highly asymmetric papilledema has suggested a model of visual loss in IIH characterized by a generalized depression of the visual field.7,8 The model predicts visual loss greater in magnitude with increasing visual field eccentricity. This and another study concluded that the amount of visual loss correlates with the severity of optic disc edema— eyes with more optic disc edema generally had more visual loss.7,8 This relationship between degree of papilledema and visual loss suggests that visual loss in IIH occurs due to papilledema and not from a retrolaminar mechanism.
Our main outcome measure for the IIHTT was the change in the average perimetric MD from baseline to 6 months. We chose this measure because of evidence that visual loss in IIH occurs across the visual field and increases with eccentricity. Here we report additional visual field outcomes at 6 months in the IIHTT.
Methods
Subject and Visual Field Examination Eligibility
A total of 165 subjects aged between 18 and 60 years who met the modified Dandy criteria for IIH were randomized if they had bilateral optic disc swelling, elevated intracranial pressure, and reproducible mild visual field loss with an average perimetric MD of −2 to −7 dB in the study (worst) eye; other minor eligibility criteria can be found in other publications.1,9 A data and safety monitoring committee monitored the ethical conduct of the study and the accumulated data for evidence of adverse treatment effects. The research adhered to the tenets of the Declaration of Helsinki.
To meet visual field eligibility criteria, subjects completed two screening visual field examinations at least 30 minutes apart using the SITA Standard 24-2 test pattern on the Humphrey Field Analyzer (HFA) II perimeter (model 750), with at least one set of screening examinations performed after the lumbar puncture. Both eyes were tested and the eye with the most negative MD (greater visual field loss) was designated as the study eye. The two sets of visual fields were averaged to obtain the mean baseline MD for each of the study and nonstudy eyes. The examinations were required to have adequate gaze tracking, meet IIHTT reliability criteria of <15% false positives and <33% fixation losses, and demonstrate reproducible visual loss on both sets of examinations at baseline and 6 months. Follow-up examinations were obtained at 1, 2, 3, 4.5, 6, 9, and 12 months and at yearly visits; only data from the first 6 months (double-blind treatment period) are reported here.
We used the MD on the HFA as a global measure of visual function and as the primary measure of outcome in the IIHTT. We chose MD because of its more stable retest variability compared to individual or groups of test locations and its sensitivity to global, clinically meaningful changes in IIH.1,9
Pointwise Linear Regression (PLR)
Data from the HFA were converted using Peridata (PeriData.Net; PeriData Software GmbH, Hürth, Germany) and uploaded into a spreadsheet program (Excel; Microsoft Corp., Redmond, WA, USA). For each of the 121 subjects completing the 6-month visit and having baseline, and those completing the 6-month visit and having at least two other visual field examinations, a linear regression analysis was performed with the dB measurement as the outcome variable and time as the independent variable. Results of the two baseline and two final visits were averaged for this analysis. This was done for each subject and each of the 52 non-blind spot test locations. For each test location, the results were summarized as the percentage of subjects with a positive slope and the treatment groups were compared with respect to these percentages using chi-square tests. There were 7 subjects in the IIHTT that were deemed treatment failures.1,10 These subjects did not have a sufficient number of visual field examinations for PLR so they are not included in the PLR analysis.
Initial Versus Final Pointwise Outcome in dB
At each location of the visual field, we compared the mean change in dB from baseline to month 6 between the acetazolamide and placebo groups using two-sample t-tests. Values from the seven treatment failure patients are included (the results from the time of treatment failure are carried forward to the 6-month time point). The comparisons were also carried out at various eccentricity zones of the visual field (Supplementary Fig. S1) by taking the MD across the individual points within each zone. The zones were defined by their Euclidian distance from the optic nerve.
Visual Field Abnormality Classification
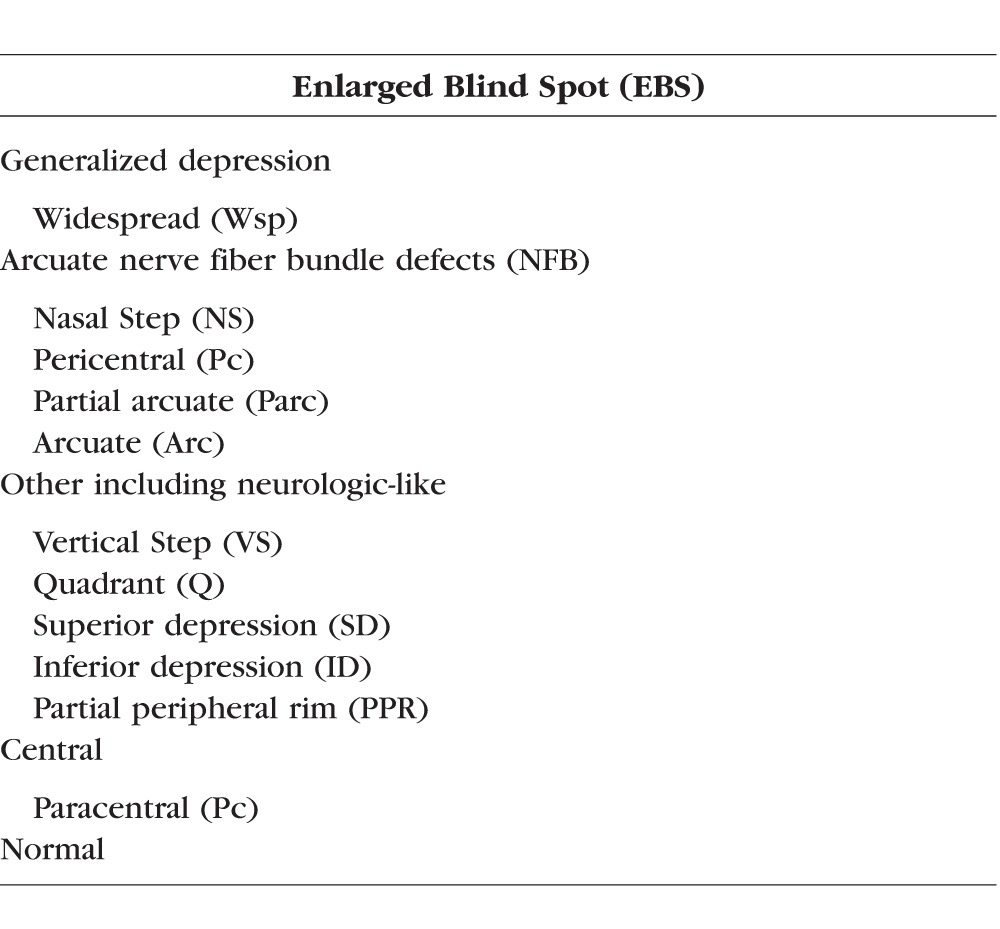
For classification, we have refined the methodology from previous UC Davis Visual Field Reading Center (VFRC) studies.11–14 The classification system of the IIHTT contained six categories (enlarged blind spot, generalized depression, arcuate nerve fiber bundle, neurologic-like/other, central and normal). The categories were subdivided into more specific classes as shown in Table 1. The visual field abnormalities from 125 subjects who completed visual field examinations at both baseline and 6 months were classified into these six categories and specific classes as well as judged by three VFRC readers to be either improved, worse, or the same at the 6-month visit relative to baseline (reasons for failure to complete the 6-month double-blind treatment phase are found in the primary IIHTT article1). The distribution of the consensus rating of visual field change was compared between the acetazolamide and placebo groups using a χ2 test. The analyses were repeated including the seven subjects who met criteria for treatment failure prior to month 6, with the visual field change classified as “worse.”
Table 1.
Classification of Visual Field Abnormalities in the IIHTT
An abnormal perimetry exam in the IIHTT was defined as meeting any of the following criteria (with the exception of an enlarged blind spot): (1) a glaucoma hemifield test (GHT) outside of normal limits; (2) pattern standard deviation value (PSD) P < 5%; (3) a single point worse than the 0.5% pointwise probability level on the total and/or pattern deviation probability plots; (4) two clustered points beyond normal limits (P < 5%) in a clinically suspicious area, and at least one point worse than the 1% level on the total and/or pattern deviation Plot (a cluster is defined as two or more horizontally or vertically—not diagonally—contiguous abnormal points with P < 5%); (5) two or more points beyond normal limits (P < 5%) in and/or around the peripapillary zone; (6) three or more clustered points worse than the 5% level on the total and/or pattern deviation plot and a pattern of loss consistent with ocular pathology. The predominant pattern of loss was used to determine the abnormality classification defined in Table 1. For a hemifield to be classified as normal, it had to not meet any of the above criteria for hemifield abnormality.
Classification Procedures
The procedures for hemifield classification were as follows: The superior and inferior hemifields of visual field examinations for the two examinations at baseline and the two examinations at 6 months were evaluated separately and, in general, the pattern on the deviation plot (“total” or “pattern”) showing the greater number of abnormal points was used to determine the appropriate classification for a hemifield abnormality. However, the other deviation plot, as well as the gray scale, was evaluated to confirm the appropriateness of the classification. Abnormal test locations that were extraneous to the salient pattern were considered less important for the determination of the hemifield classification. Thus, the most predominant pattern was classified. Baseline and month 6 visual field examinations were evaluated in this report, which included 1511 of 1982 hemifields that met the IIHTT criteria for abnormality. Since the readers were masked to the subject's optic disc characteristics and randomized treatment assignment, the classification of the visual field deficit is strictly based on the pattern of abnormality.
Three readers (CAJ, KEC, JLK) reviewed 500 visual field examinations (1000 hemifields) at baseline and 491 (982 hemifields) at 6 months from 125 subjects who performed the two exams at baseline and the two exams at 6 months and classified the superior and inferior hemifields separately as to the presence of an abnormality that met the secondary criteria (Supplementary Table S1). Four subjects did not perform their second set of 6-month visual field examinations and one subject did not perform the right eye examination at month 6, thus a total of 9 examinations (18 hemifields) were not included in the analyses.
Reader Agreement
Agreement among the readers was summarized at both baseline and month 6 according to the percentage of hemifields for which none, two, or all three readers agreed on the 13 specific hemifield classifications. If at least two readers agreed with a hemifield classification, the majority classification was accepted (2 out of 3 readers in agreement). If all three readers disagreed, then the visual fields were adjudicated by group consensus to reach a final classification of the hemifield.
A logistic regression model was used to examine factors associated with the presence of a normal hemifield using the first examination at each time point. The model included terms for time (baseline, month 6), hemifield (superior, inferior), and eye (study eye, nonstudy eye); model parameters and standard errors were estimated using generalized estimating equations to account for the dependence among the eight observations for each person (2 time points × 2 hemifields × 2 eyes). These analyses used the results of the first of the two perimetry examinations at each time point.
Results
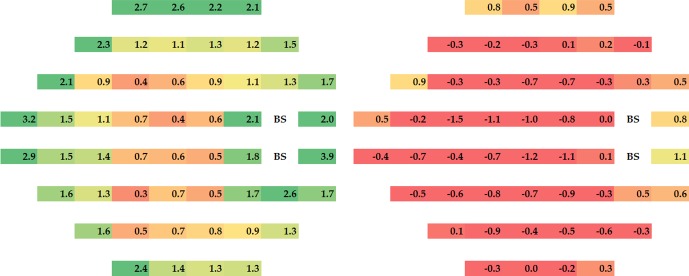
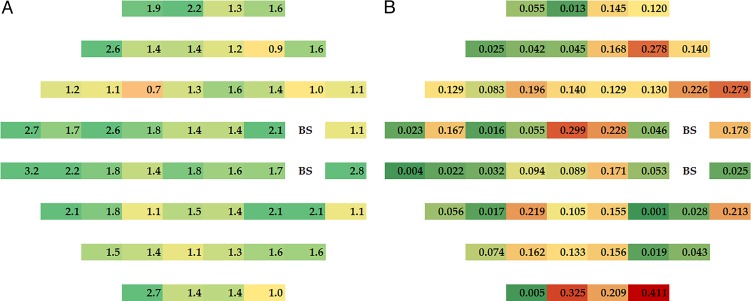
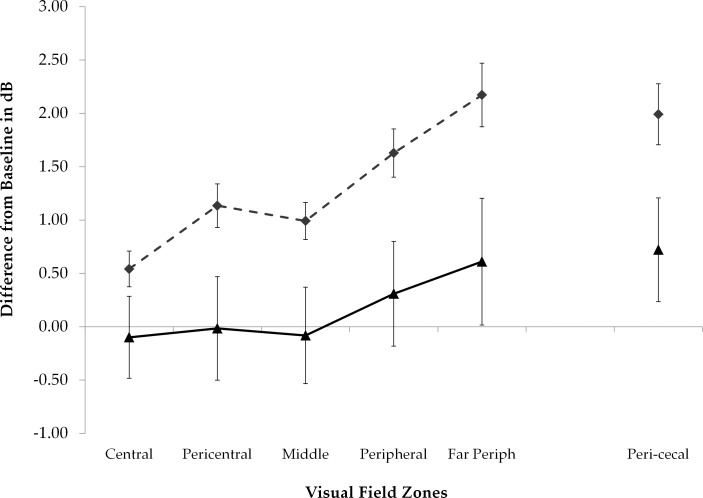
Visual sensitivity improved across the visual field in the acetazolamide group over the 6-month intervention period with the magnitude of the change in dB greatest around the blind spot and the nasal area; with the treatment failure subjects included some test locations in the placebo worsened (Fig. 1, right). Figure 1 shows the mean changes from baseline to month 6 in dB for each treatment group; the group differences in mean change (acetazolamide values minus placebo values) are depicted in Figure 2A with corresponding pointwise P values in Figure 2B. There was an increase in treatment effect with eccentricity zone but this change did not reach statistical significance (Fig. 3).
Figure 1.
Mean threshold change in dB from baseline to 6 months at each test location within each treatment group, with positive values indicating improvement with the treatment failure subjects included. Note that the greatest changes occurred in the periphery and around the blind spot but improvement occurred across the visual field. Green: 2 dB or more improvement. Yellow: 1–2 dB improvement. Red: less than 1 dB improvement.
Figure 2.
(A) Magnitude of treatment effect (acetazolamide–placebo) at each test location. (B) Value for statistical significance of the treatment effect at each test location; P < 0.05 shown in darker green.
Figure 3.
Mean threshold changes (dB) from baseline to 6 months within each treatment group by zone; the zones are described in Supplementary Figure S1. The acetazolamide treatment group is represented by the dashed line and the placebo group is represented by the solid line. Error bars denote one standard error. Zones of increasing eccentricity are shown on the left and the pericecal zone adjacent to the blind spot is shown on the far right.
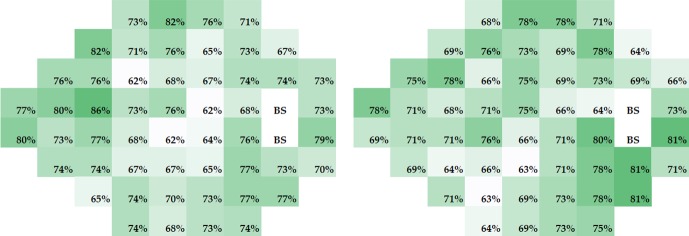
The pointwise linear regression analyses showed that, on average, 36 of 52 visual field test locations had improving thresholds (positive slopes) in the study eye. While the PLR slopes improved in the majority of subjects at all locations in both treatment groups (Fig. 4), there were no significant differences between the treatment groups in the percentage of subjects with a positive slope.
Figure 4.
Percentages of subjects with a positive slope (estimated using PLR) at each test location by treatment group. Results for acetazolamide are shown on the left and those for placebo on the right. Note that the group differences are minor. Treatment failure subjects did not have enough visual field examinations to be included in these analyses.
The consensus rating results of visual field change from baseline to 6 months in the study eye are found in Table 2. When including subjects who met criteria for treatment failure, the percentages (acetazolamide and placebo) were 7.2% and 17.5% worse, 35.1% and 31.7% with no change, and 56.1% and 50.8% improved. The group differences were not statistically significant.
Table 2.
Consensus Ratings of Visual Field Change From Baseline to 6 Months in the Study Eye, With and Without Subjects Meeting Criteria for Treatment Failure
The hemifield abnormality classification frequencies are presented by hemifield and treatment assignment for the study and nonstudy eyes at baseline and 6 months in Supplementary Tables S2 through S4. Note the common occurrence of nerve fiber bundle defects. Also, normal hemifields were more common at month 6 (35.8%) than at baseline (11.8%; odds ratio [OR] 4.46, 95% confidence interval [CI] 2.99–6.64, P < 0.0001), more common in the superior hemifield (29.6%) than in the inferior hemifield (18%; OR 2.10, 95% CI 1.57–2.82, P < 0.0001), and less common in the study eye (16.8%) than in the fellow eye (30.8%; OR 0.43, 95% CI 0.32–0.57, P < 0.0001).
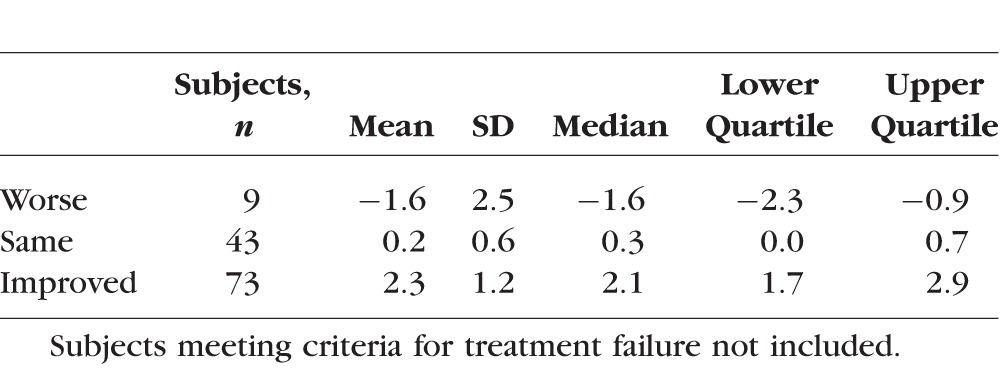
Shown in Table 3 are the distributions of the change in MD corresponding to the consensus rating of visual field change in the study eye (treatment failure subjects not included). On average there was an approximately 2-dB MD change in the subjects classified as changing in either direction. Readers showed high levels of agreement with respect to hemifield abnormality classification, with the percentages of hemifields on which 2/3 or 3/3 readers agreed on the classification ranging from 84% to 95% (Supplementary Table S5).
Table 3.
Descriptive Statistics for Change in MD by Consensus Rating of Visual Field Change in the Study Eye
Discussion
In this more detailed analysis of the visual field data from IIHTT participants, we found pointwise improvement across the visual field in both treatment groups except for the areas of loss in the placebo group (in dB) when the treatment failure subjects were included. In terms of changes in visual sensitivity in dB, improvement was greater with eccentricity, especially nasally in the visual field and adjacent to the blind spot. Analysis of PLR, which did not include the treatment failure subjects (due to an insufficient number of data time points), showed improvement in both treatment groups on average over the 6-month time period in over two-thirds of test locations. The consensus ratings of the three readers also showed that most subjects improved or stayed the same.
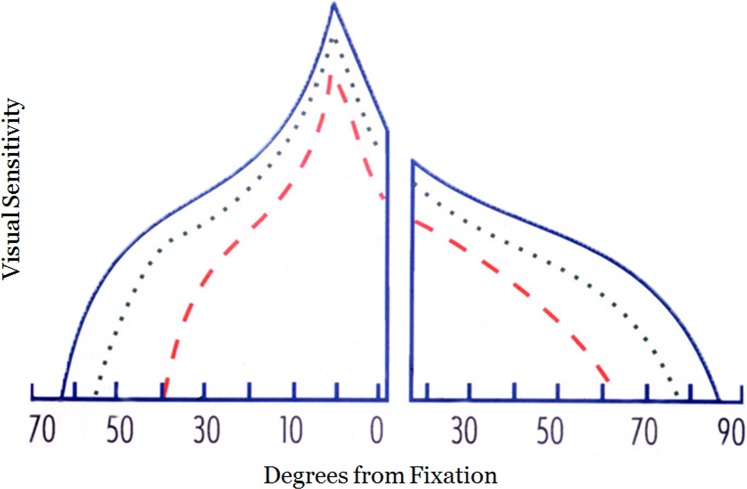
In a previous study, it was shown that IIH patients with highly asymmetric papilledema generally have more loss in the eye having the higher papilledema grade.7 The visual field function of the eye with the lower grade is also abnormal across the visual field when compared to controls.7 The visual damage in this prior study in both the higher and lower grade eyes included fixation and the magnitude of the loss increased with eccentricity.7 We have proposed a model of visual loss in IIH based on these findings characterized by a generalized depression of the visual field with increasing loss with eccentricity (Fig. 5). While nerve fiber bundle-like defects are frequently observed (especially inferior nasal nerve fiber bundle defects),2,15,16 the overall pattern when multiple subjects are averaged is a generalized depression. The results of the IIHTT support this model of visual loss in IIH. Studies have also shown that the amount of visual loss is associated with the severity of papilledema.6,7 This relationship suggests that visual loss in IIH occurs due to papilledema and not to a retrolaminar mechanism.
Figure 5.
Schematic of the visual island of a right eye in IIH modelling damage due to high- and low-grade papilledema. Blue lines represent the profile of the normal visual island through the horizontal meridian. Green dotted line: represents visual loss in the eye with low-grade papilledema. Red dashed line: the visual loss in the eye with high grade papilledema. The x-axis numbers are degrees of visual field eccentricity for a right eye.
In addition, we found there was significant improvement in dB in test locations adjacent to the physiologic blind spot. With papilledema, there is forward protrusion of the optic nerve head and peripapillary retina into the vitreous.17 This leads to hyperopic peripapillary retina and a reduction in visual sensitivity (enlargement of the blind spot). Unlike most of the visual loss in IIH that is related to dysfunction or damage to nerve fiber bundles, the hyperopic retina functions well for the most part and the blind spot enlargement found on perimetry can be mostly refracted away using plus lenses.5 Optical coherence tomography of the IIHTT subjects showed considerable distortion in the peripapillary retina.17 Since both the acetazolamide and placebo groups experienced reduction in CSF pressure and papilledema over the 6-month period, there was reduction of the blind spot enlargement and improvement in the peripapillary visual sensitivity.
The magnitudes of the pointwise changes we found were modest. This likely related to our entry criteria that required a MD between −2 and −7 dB to be enrolled.1 Most of the MDs were closer to the −2 dB end of the distribution as the mean MD in each treatment group at study onset was −3.5 dB. Therefore, there was likely a floor effect and little room for many subjects to improve. Although pointwise dB analysis showed there was significantly more visual field improvement in the acetazolamide group than in the placebo group, no significant differences were found with PLR or consensus of clinical readers. Again, this lack of difference likely relates to both groups improving, the lack of a substantial amount of visual loss at baseline and the categorical nature of some of the measures.
In conclusion, both the acetazolamide and placebo groups in the IIHTT demonstrated improvement across the visual field increasing with eccentricity, especially nasally; there was also substantial improvement in the visual field around the blind spot. This supports use of the MD as a useful measure to follow IIH patients over time.
Supplementary Material
Acknowledgments
Supported by NEI Grant NORDIC 1U10EY017281-01A1. The authors alone are responsible for the content and writing of the paper.
Disclosure: M. Wall, None; C.A. Johnson, None; K.E. Cello, None; K.D. Zamba, None; M.P. McDermott, None; J.L. Keltner, None
Appendix
Nordic Idiopathic Intracranial Hypertension Study Group
Coinvestigators
Coinvestigators/Sites: New York Eye and Ear Infirmary: Rudrani Banik, MD (principal investigator), Sanjay Kedhar, MD (sub-investigator), Flora Levin, MD (investigator), Jonathan Feistmann, MD, (investigator), Katy Tai, MA (coordinator), Alex Yang, BA (co-coordinator), Karen Tobias, BA (coordinator), Melissa Rivas, BA (co-coordinator), Lorena Dominguez, BA (coordinator), Violete Perez, BA (coordinator); University of Iowa and Department of Veterans Affairs: Reid Longmuir, MD (principal investigator), Matthew Thurtell, MBBS, MSc (sub-investigator), Trina Eden (coordinator), Randy Kardon, MD, PhD (sub-investigator); The Eye Care Group: Robert Lesser, MD (principal investigator), Yanina O'Neil, MD (sub-investigator), Sue Heaton, BS, CCRC (coordinator), Nathalie Gintowt (co-coordinator) Danielle Rudich (co-coordinator); University of Utah: Kathleen Digre, MD (principal investigator), Judith Warner, MD (sub-investigator), Barbara Hart, BS (coordinator), Kimberley Wegner, BS (co-coordinator), Bonnie Carlstrom, COA (coordinator), Susan Allman (coordinator), Bradley Katz, MD, PhD (sub-investigator), Anne Haroldsen (regulatory); Bascom Palmer Eye Institute, University of Miami: Byron L. Lam, MD (principal investigator), Joshua Pasol, MD (sub-investigator), Potyra R. Rosa, MD (coordinator), Alexis Morante, MS (co-coordinator), Jennifer Verriotto, MS (coordinator); Bethesda Neurology, LLC: David Katz, MD (principal investigator), Tracy Asbury (coordinator), Robert Gerwin, MD (sub-investigator), Mary Barnett (data entry); Swedish Medical Center: Steven Hamilton, MD (principal investigator), Caryl Tongco (coordinator), Beena Gangadharan (co-coordinator), Eugene May, MD (sub-investigator); Dean A. McGee Eye Institute: Anil Patel, MD (principal investigator), Bradley Farris, MD (sub-investigator), R. Michael Siatkowsk, MD (sub-investigator), Heather Miller, LPN (coordinator), Vanessa Bergman (co-coordinator), Kammerin White (coordinator), Steven O'Dell (lumbar puncture), Joseph Andrezik (lumbar puncture), Timothy Tytle (lumbar puncture); University of Pennsylvania: Kenneth Shindler, MD, PhD (principal investigator), Joan Dupont (coordinator), Rebecca Salvo (coordinator), Sheri Drossner (co-coordinator), Susan Ward (coordinator), Jonathan Lo (coordinator), Stephanie Engelhard (coordinator), Elizabeth Windsor (coordinator), Sami Khella (lumbar puncture), Madhura Tamhankar, MD (sub-investigator); Washington University in St. Louis School of Medicine: Gregory Van Stavern, MD (principal investigator), Jamie Kambarian (coordinator), Renee Van Stavern, MD (sub-investigator), Karen Civitelli (Regulatory), J. Banks Shepherd, MD (sub-investigator); Emory University: Beau B. Bruce, MD (principal investigator), MS; Valérie Biousse (sub-investigator), MD; Nancy J. Newman, MD (investigator); Judy Brower, MMSc, COMT (coordinator); Linda Curtis, BSM (co-coordinator); University of Alabama Birmingham: Michael Vaphiades, DO (principal investigator), Karen Searcey (coordinator), Lanning Kline, MD (sub-investigator), Roy McDonald (coordinator); Raleigh Neurology Associates, PA: Syndee J. Givre, MD, PhD (principal investigator), Tippi Hales (coordinator), Penni Bye (coordinator), Keisha Fuller (coordinator), Kenneth M. Carnes, MD, (sub-investigator), Kimberly James (Regulatory), Marisol Ragland (data entry); Saint Louis University: Sophia M. Chung, MD (principal investigator), Dawn M. Govreau, COT (coordinator), John T. Lind, MD, MS (sub-investigator); David & Ilene Flaum Eye Institute, University of Rochester School of Medicine & Dentistry: Zoe Williams, MD (principal investigator), George O'Gara (coordinator), Kari Steinmetz (coordinator), Mare Perevich (coordinator), Karen Skrine (coordinator), Elisabeth Carter (coordinator), Rajeev Ramchandran, MD (sub-investigator); Ohio State University: Steven Katz, MD (principal investigator), Marc Criden, MD (investigator), Gina Coman, RMA, CPC, OCS (co-coordinator), John McGregor, FACS, MD, (sub-investigator), Andrea Inman (regulatory); Johns Hopkins University: Prem S. Subramanian, MD, PhD (principal investigator), Paul N. Hoffman, MD, PhD (investigator), Marianne Medura (coordinator), M. Michaele Hartnett (coordinator), Madiha Siddiqui (coordinator), Diane Brown (coordinator), Ellen Arnold (co-coordinator), Jeff Boring, MD (sub-investigator), Neil R. Miller, MD (sub-investigator); University of Southern California: Peter Quiros, MD (principal investigator), Sylvia Ramos (coordinator), Margaret Padilla (coordinator), Lupe Cisneros (coordinator), Anne Kao, MD (sub-investigator), Carlos Filipe Chicani, MD (sub-investigator), Kevin Na (Regulatory); University of Houston: Rosa Tang, MD, MPH, MBA (principal investigator), Laura Frishman, PhD (coordinator), Priscilla Cajavilca, MD (coordinator), Sheree Newland, LVN (coordinator), Liat Gantz, OD, PhD (coordinator), Maria Guillermo Prieto, MD (coordinator), Anastas Pass, OD, JD (coordinator), Nicky R. Holdeman, OD, MD (sub-investigator); University of Minnesota: Michael S. Lee, MD (principal investigator), Helen Roemhild (coordinator), Wendy Elasky (coordinator), Anne Holleschau (coordinator), Jody Fissgus (coordinator), Jamie Walski (coordinator), Andrew Harrison, MD (sub-investigator); Oregon Health & Science University: Julie Falardeau, MD (principal investigator), William Hills, MD (sub-investigator), Cristi Bryant (coordinator), Donna Kim, MD (investigator), Rebecca Armour, MD (investigator), Lori Higginbotham (coordinator); University of Virginia: Steven A. Newman, MD (principal investigator), Kristina Holbrook (coordinator), Laura D. Cook, MD (sub-investigator), Holly Bacon (data entry), Janis Beall, COT (technician), Thomas Goddard, COA (technician), William Hall (technician), Debbie Hamilton (photographer), Alan Lyon (photographer); University of Calgary: William Fletcher, MD, FRCPC (principal investigator), Suresh Subramaniam, MSc, MD, FRCPC (investigator), Jeannie Reimer (coordinator), Jeri Nickerson (coordinator), Fiona Costello, MD, FRCPC (sub-investigator); The Greater Baltimore Medical Center: Vivian Rismondo-Stankovich, MD (principal investigator), Maureen Flanagan, CO, COA (coordinator), Allison Jensen, MD (sub-investigator); Stony Brook University: Patrick Sibony, MD (principal investigator), Ann Marie Lavorna, RN (coordinator), Mary Mladek, COT (coordinator), Ruth Tenzler, RN (coordinator), Robert Honkanen, MD (sub-investigator), Jill Miller-Horn, MD, MS (lumbar puncture), Lauren Krupp, MD (lumbar puncture); Massachusetts Eye and Ear Infirmary: Joseph Rizzo, MD (principal investigator), Dean Cestari, MD (sub-investigator), Neal Snebold, MD (investigator), Brian Vatcher (coordinator), Christine Matera (coordinator), Edward Miretsky, BA (coordinator), Judith Oakley, BA (coordinator), Josyane Dumser (coordinator), Tim Alperen, BA (coordinator), Sandra Baptista-Pires (coordinator), Ursula Bator, OD (coordinator), Barbara Barrett, RN (coordinator), Charlene Callahan (coordinator), Sarah Brett (coordinator), Kamella Zimmerman (coordinator), Marcia Grillo (coordinator), Karen Capaccioli (coordinator); Duke Eye Center and Duke University Medical Center: M. Tariq Bhatti, MD (principal investigator), LaToya Greene COA, CRC (coordinator), Maria Cecilia Santiago-Turla (coordinator), Noreen McClain (coordinator), Mays El-Dairi, MD (sub-investigator); University of Texas Health Science Center at San Antonio: Martha Schatz, MD (principal investigator), John E. Carter, MD (sub-investigator), Patrick O'Connor, MD (sub-investigator), Daniel Mojica (coordinator), Joan Smith (coordinator), Yolanda Trigo (coordinator), Sherry Slayman Kellogg (coordinator), Alexandra Martinez (coordinator), Paul Comeau (photographer), Andres Sanchez (photographer), Nathan McCarthy (photographer), Erika Perez (COT), Carlos Bazan (lumbar puncture); Florida State University College of Medicine: Charles Maitland, MD (principal investigator), H. Logan Brooks Jr, MD (investigator), Ronda Gorsica (coordinator), Brian Sherman, MD (sub-investigator), Joel Kramer, MD (sub-investigator); Rutgers-New Jersey Medical School: Larry Frohman, MD (principal investigator) Amanda Ribeiro (coordinator), Kathryn Boschert (coordinator), Yu fei Tu (coordinator), Susan Rivera (coordinator), Roger Turbin, MD (sub-investigator); Queen's University-Hotel Dieu Hospital: Martin ten Hove, MD, MEng (principal investigator), Adriana Breen, RN, BScN (coordinator), Craig Simms (coordinator), Mary Kemp (regulatory), Jim Farmer, MD (sub-investigator); William Beaumont Hospital: Robert Granadier, MD (principal investigator), Tammy Osentoski, RN (coordinator), Kristi Cumming, RN (coordinator), Bobbie Lewis, RN (coordinator), Lori Stec, MD (sub-investigator); University of Illinois: Jorge C. Kattah, MD (principal investigator), John Pula, MD (sub-investigator), Mary Rose Buttice, LPN, CCRC (coordinator), Kimberly DuPage, RN, BSN, CCRC (coordinator), Kimberly Cooley, RN, BSN, CCRC (coordinator), Judith Beck, RN (coordinator), CCRP, Lynn Bannon (technician), Cynthia Guede, RN, BSN (coordinator); SUNY Upstate Medical University: Luis Mejico, MD (principal investigator), Melissa Ko, MD (sub-investigator), Burk Jubelt, MD (investigator), Megan Grosso, PAC (coordinator), Mark Chilton (coordinator), Mary Lou Watson (data entry), Jennifer Moore (coordinator); Wake Forest University: Tim Martin, MD (principal investigator), Cara Everhart, COA (coordinator), Joan Fish, RN (coordinator), Lori Cooke, RN (coordinator), J. Paul Dickinson, MD (sub-investigator); LSU Health Sciences Center: Marie D. Acierno, MD (principal investigator), Rachelle Watts, RN (coordinator), Amy Thomassie, RN (coordinator), Aravinda Rao, MD (sub-investigator), Trisha Mary Chiasson (Regulatory); Mount Sinai Medical Center: Janet C. Rucker, MD (principal investigator), Christine Hannigan (coordinator), Ilana Katz-Sand, MD (sub-investigator), De-epali Rajguru, MD (sub-investigator); University of Kentucky College of Medicine: Sachin Kedar, MD (principal investigator), Nubia Vega, CCRP (coordinator), Stephanie Morris, CCRP (coordinator), Andrew Pearson, MD (sub-investigator), Mike Hanson (photographer)
Dietary Weight Loss Program: Betty Kovacs, Richard Weil, Med, CDE; Xavier Pi-Sunyer (New York Obesity Nutrition Research Center)
Fundus Reading Center: Steven Feldon, MD, MBA; William Fisher; Dorothea Castillo; Valerie Davis; Lourdes Fagan, Rachel Hollar; Tammy Keenan; Peter MacDowell (David & Ilene Flaum Eye Institute at the University of Rochester Medical Center)
Visual Field Reading Center: John Keltner, MD; Kim Plumb; Laura Leming; John S. Werner, PhD (UC Davis Department of Ophthalmology & Vision Science); Danielle Harvey, PhD (UC Davis Department of Public Health Sciences, Division of Biostatistics); Chris Johnson, PhD (University of Iowa)
Optical Coherence Tomography Reading Center: John Keltner, MD; John S. Werner; Kim Plumb; Laura Leming (UC Davis Department of Ophthalmology & Vision Science)
Data Coordination & Biostatistics Center: Jan Bausch, BS; Shan Gao, MS; Xin Tu, PhD; Hua He, PhD; Arthur Watts, BS (Biostatistics); Debbie Baker; Radu Constantinescu, MD; Karen Helles; Nichole McMullen; Bev Olsen; Larry Preston; Victoria Snively; Ann Stoutenburg, CHET/CTCC (David & Ilene Flaum Eye Institute, University of Rochester School of Medicine & Dentistry); Deborah Friedman, MD (UT Southwestern Medical Center)
Nordic Headquarters: O. Iyore Ayanru, Elizabeth-Ann Moss, Pravin Patel (Roosevelt Hospital)
Consultant: Richard Mills, MD (Glaucoma Consultants Northwest)
Data Safety Monitoring Board Members: Maureen Maguire, PhD (Chair; University of Pennsylvania); William Hart Jr, MD, PhD; Joanne Katz, ScD, MS (Johns Hopkins); David Kaufman, DO (Michigan State University); Cynthia McCarthy, DHCE MA; John Selhorst, MD (Saint Louis University School of Medicine)
Adjudication Committee: Kathleen Digre, MD (University of Utah); James Corbett, MD, FAAN (University of Mississippi Medical Center); Neil R. Miller, MD (Johns Hopkins University); Richard Mills, MD (Glaucoma Consultants Northwest)
Footnotes
See the appendix for the members of the NORDIC Idiopathic Intracranial Hypertension Study Group.
References
- 1. Wall M,, McDermott MP,, Kieburtz KD,, et al. Effect of acetazolamide on visual function in patients with idiopathic intracranial hypertension and mild visual loss: the idiopathic intracranial hypertension treatment trial. JAMA. 2014; 311: 1641–1651. [DOI] [PMC free article] [PubMed] [Google Scholar]
- 2. Wall M,, George D. Idiopathic intracranial hypertension. A prospective study of 50 patients. Brain. 1991; 114 (pt 1A): 155–180. [PubMed] [Google Scholar]
- 3. Hayreh SS. Optic disc edema in raised intracranial pressure. V. Pathogenesis. Arch Ophthalmol. 1977; 95: 1553–1565. [DOI] [PubMed] [Google Scholar]
- 4. Tso MOM,, Hayreh SS. Optic disc edema in raised intracranial pressure. III. A pathologic study of experimental papilledema. Arch Ophthalmol. 1977; 95: 1448–1457. [DOI] [PubMed] [Google Scholar]
- 5. Corbett JJ,, Jacobson DM,, Mauer RC,, Thompson HS. Enlargement of the blind spot caused by papilledema. Am J Ophthalmol. 1988; 105: 261–265. [DOI] [PubMed] [Google Scholar]
- 6. Frisén L,, Holm M. Visual field defects associated with choroidal folds. : Glaser JS, Symposium of the University of Miami. Vol IX St. Louis: Mosby; 1977: 248–257. [Google Scholar]
- 7. Wall M,, White WN. Asymmetric papilledema in idiopathic intracranial hypertension: prospective interocular comparison of sensory visual function. Invest Ophthalmol Vis Sci. 1998; 39: 134–142. [PubMed] [Google Scholar]
- 8. Wall M. The morphology of visual field damage in idiopathic intracranial hypertension: an anatomic region analysis. In: Mills RP,, Heijl A, eds Perimetry Update 1990/1991. Amsterdam: Kugler Publications; 1991: 20–27.
- 9. Friedman DI,, McDermott MP,, Kieburtz K,, et al. The Idiopathic Intracranial Hypertension Treatment Trial: design considerations and methods. J Neuroophthalmol. 2014; 34: 107–117. [DOI] [PubMed] [Google Scholar]
- 10. Wall M,, Falardeau J,, Fletcher WA,, et al. Risk factors for poor visual outcome in patients with idiopathic intracranial hypertension. Neurology. 2015; 85: 799–805. [DOI] [PMC free article] [PubMed] [Google Scholar]
- 11. Keltner JL,, Johnson CA,, Cello KE,, Dontchev M,, Gal RL,, Beck RW. Visual field profile of optic neuritis: a final follow-up report from the optic neuritis treatment trial from baseline through 15 years. Arch Ophthalmol. 2010; 128: 330–337. [DOI] [PMC free article] [PubMed] [Google Scholar]
- 12. Keltner JL,, Johnson CA,, Spurr JO,, Beck RW. Baseline visual field profile of optic neuritis. The experience of the optic neuritis treatment trial. Optic Neuritis Study Group. Arch Ophthalmol. 1993; 111: 231–234. [DOI] [PubMed] [Google Scholar]
- 13. Keltner JL,, Johnson CA,, Cello KE,, et al. Classification of visual field abnormalities in the ocular hypertension treatment study. Arch Ophthalmol. 2003; 121: 643–650. [DOI] [PubMed] [Google Scholar]
- 14. Kass MA,, Heuer DK,, Higginbotham EJ,, et al. The Ocular Hypertension Treatment study: a randomized trial determines that topical ocular hypotensive medication delays or prevents the onset of primary open-angle glaucoma. Arch Ophthalmol. 2002; 120: 643–650. [DOI] [PubMed] [Google Scholar]
- 15. Keltner JL,, Johnson CA,, Cello KE,, Wall M. Baseline visual field findings in the Idiopathic Intracranial Hypertension Treatment Trial (IIHTT). Invest Ophthalmol Vis Sci. 2014; 55: 3200–3207. [DOI] [PMC free article] [PubMed] [Google Scholar]
- 16. Wall M,, Hart WM,, Jr,, Burde RM. Visual field defects in idiopathic intracranial hypertension (pseudotumor cerebri). Am J Ophthalmol. 1983; 96: 654–669. [DOI] [PubMed] [Google Scholar]
- 17. Sibony P,, Kupersmith MJ,, Rohlf FJ. Shape analysis of the peripapillary RPE layer in papilledema and ischemic optic neuropathy. Invest Ophthalmol Vis Sci. 2011; 52: 7987–7995. [DOI] [PMC free article] [PubMed] [Google Scholar]
Associated Data
This section collects any data citations, data availability statements, or supplementary materials included in this article.


