Abstract
Genetic oscillators, such as circadian clocks, are constantly perturbed by molecular noise arising from the small number of molecules involved in gene regulation. One of the strongest sources of stochasticity is the binary noise that arises from the binding of a regulatory protein to a promoter in the chromosomal DNA. In this study, we focus on two minimal oscillators based on activator titration and repressor titration to understand the key parameters that are important for oscillations and for overcoming binary noise. We show that the rate of unbinding from the DNA, despite traditionally being considered a fast parameter, needs to be slow to broaden the space of oscillatory solutions. The addition of multiple, independent DNA binding sites further expands the oscillatory parameter space for the repressor-titration oscillator and lengthens the period of both oscillators. This effect is a combination of increased effective delay of the unbinding kinetics due to multiple binding sites and increased promoter ultrasensitivity that is specific for repression. We then use stochastic simulation to show that multiple binding sites increase the coherence of oscillations by mitigating the binary noise. Slow values of DNA unbinding rate are also effective in alleviating molecular noise due to the increased distance from the bifurcation point. Our work demonstrates how the number of DNA binding sites and slow unbinding kinetics, which are often omitted in biophysical models of gene circuits, can have a significant impact on the temporal and stochastic dynamics of genetic oscillators.
I. Introduction
Genetic oscillatory networks are ubiquitous in nature and perform important functions. For example, the cell-cycle oscillator regulates cell growth and division, whereas the circadian clock regulates the behavior of organisms with respect to daily changes in light. These genetic oscillators are used by living systems to reliably coordinate various periodic internal processes with each other as well as with their rhythmic environment. However, this presents a challenge at the cellular level because oscillators have to maintain proper timing (temporal coherence of oscillation) in the presence of stochastic noise that arises from the small number of regulatory molecules in cells [1].
A simple mechanism to mitigate the effect of molecular noise would be to increase the number of molecules of each species [2–4]. While the number of RNAs and proteins made per gene can be large, most cells are fundamentally constrained to one to two gene copies and are subject to binary noise in the first step of gene regulation (i.e., transcription factor binding to DNA) [5,6]. This binary gene regulation noise manifests itself as a stochastic temporal pattern of all-or-none gene activity depending on whether the promoter is bound by the regulatory protein. Recent work shows that slow DNA binding-unbinding kinetics (also called the nonadiabatic limit) can exacerbate the binary noise and have profound consequences on gene expression [7], epigenetic switching [8], and oscillation [3,4,9,10]. Faster kinetic rates and complex gene promoter architectures have been proposed as a way to suppress the effect of this binary noise. For example, increasing the DNA binding and unbinding rate can increase temporal coherence of oscillations via more precise sampling of the concentration of transcription factors [3,9–11] or by increasing the distance from a bifurcation point [4,12]. However, transcription factors often have slow DNA unbinding rates [13–17], which suggests that these mechanisms are not generally applicable. The cooperative binding of a transcription factor to multiple binding sites has also been shown to increase temporal coherence of oscillations [18]. However, multiple binding sites do not always lead to cooperativity and transcription factor binding to a single DNA site may often be enough to effectively activate or repress transcription.
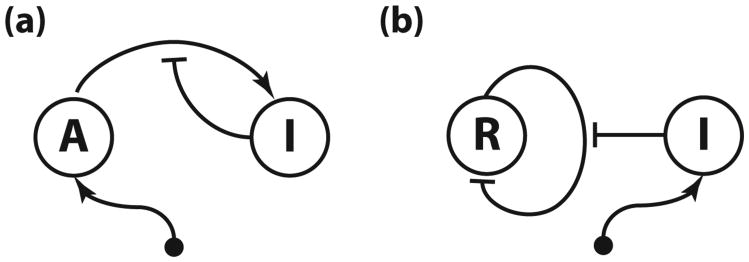
To better understand the potential mechanisms that suppress the binary gene regulation noise, in particular the influence of slow DNA unbinding rates and multiple binding sites, we study an activator-titration circuit (ATC) that has been theoretically shown to oscillate [19]. The ATC consists of a constitutively expressed activator that promotes the expression of the inhibitor, which then titrates the activator into an inactive heterodimer complex (Fig. 1). Studying the ATC has two advantages. First, it lies at the core of animal circadian clocks [20] and oscillatory NF-κB signaling [21,22] and has served as a model of natural genetic oscillators [10,19,23–26]. Second, the ATC generates the necessary nonlinearities through protein titration [27] and does not require cooperative binding of activator to the inhibitor promoter. Thus, by studying a titration-based oscillator, we can better explore the kinetic effects of multiple binding sites on coherence independently of the effects that might arise from cooperativity. To obtain general insights that are not specific to activation, we also study a repressor-titration circuit (RTC), which consists of a self-repressor and a constitutively-expressed inhibitor (Fig. 1). This novel titration-based oscillator is analogous to the ATC but uses repression instead of activation for the transcriptional regulation.
Fig. 1.
(a) In the activator-titration circuit (ATC), the activator is constitutively produced at a constant rate and activates the expression of the inhibitor, which, in turn, titrates the activator into inactive complex. (b) In the repressor-titration circuit (RTC) the constitutively expressed inhibitor titrates the self-repressing repressor.
We first characterize these oscillators and how they depend on several key parameters in Sec. II. We deliberately constrain ourselves to physiological parameters found in a simple eukaryote, Saccharomyces cerevisiae, commonly known as budding yeast. We show that, in addition to slow mRNA degradation, slow DNA unbinding rates of transcription factors are important for providing the necessary delay in the negative feedback loop for oscillatory solutions. Thus, both the DNA unbinding rate and mRNA degradation rate can set the period of oscillation. We then demonstrate that the addition of multiple, independent binding sites has nontrivial effects on the ATC and the RTC. While multiple binding sites lengthen the period of both oscillators due to an effective increase in the delay of negative feedback, they dramatically increase the oscillatory solution space of the RTC only. This is because multiple, independent binding sites generate ultrasensitivity (i.e., strong nonlinear response to changes in regulatory protein concentration) in repression-based promoters only, and thus only RTC can benefit from this effect. In Sec. III, we use stochastic Gillespie simulations to understand the extent to which DNA unbinding rates and numbers of binding sites suppress the molecular noise in ATC and RTC oscillators. We show that multiple binding sites increase the temporal coherence of oscillations by alleviating the binary noise resulting from discrete gene states. We also show that slower values of DNA unbinding rates are best for coherent oscillations in simple titration-based oscillations. Last, we compare and contrast our results on temporal coherence with those of previous models of genetic oscillators in Sec. IV.
II. Biophysical Model of ATC and RTC
Oscillators require negative feedback with nonlinearity and time delays [28]. Mechanistically, negative feedback on gene expression can occur transcriptionally via repressors [29–31] or post-transcriptionally via phosphorylation [32–34], degradation [32,34,35], or titration of activators into inactive complexes by inhibitors [10,19,23–26]. The ATC is a minimal two-gene circuit that can oscillate through the use of protein titration both as a source of nonlinearity and indirect negative feedback. In the first phase of oscillation, high levels of free activator homodimerize, bind the promoter, and overproduce inhibitor until all free activator has been titrated into inactive heterodimer. In the second phase of oscillation, the remaining activator will unbind from the inhibitor promoter and be sequestered by inhibitor, thus causing the promoter to return to low levels of expression of inhibitor. The levels of inhibitor will eventually decline to a point where free activator can reaccumulate and restart the cycle.
In the RTC, protein titration is used exclusively as a source of nonlinearity and the negative feedback is directly achieved through autorepression. In the first phase of oscillation, high levels of free repressor will homodimerize, bind directly to its own promoter, and repress its transcription. The free repressor will be titrated away by the constitutively expressed inhibitor. In the second phase of oscillation when free repressor levels are low, the remaining repressor will unbind from the promoter, returning to high levels of transcription and the rapid overproduction of free repressor. As we will show below, the indirect versus direct nature of negative feedback in ATC and RTC is responsible for many of the differences between these two titration-based oscillators.
A. ATC and RTC oscillators with a single DNA binding site
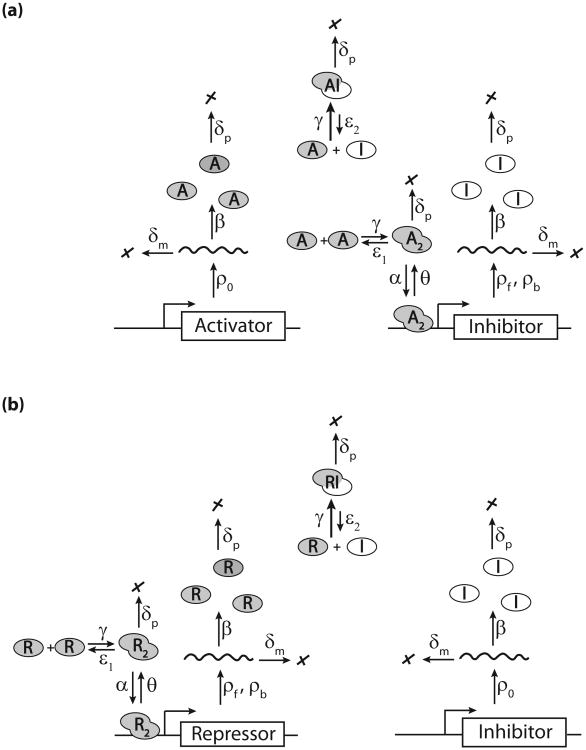
Even simple genetic circuits such as the ATC and RTC include many reactions and parameters (Fig. 2). An exhaustive search over all the parameter space was not feasible, and we decided to constrain our parameter space by studying synthetic gene circuits that could be built in budding yeast. Synthetic genetic oscillators have been useful tools to understand the properties of natural oscillators. For example, a synthetic oscillator built in bacteria [36] was useful in understanding entrainment capabilities of genetic oscillators, as well as elucidating sources of stochasticity that affected entrainment. Surprisingly, all synthetic genetic oscillators built to date have neglected protein titration, a common mechanism in natural oscillators. To this end, we built a mathematical model of ATC and RTC oscillators using a basic leucine zipper (bZIP) transcription factor that dimerizes and binds DNA and a rationally designed inhibitor that titrates free bZIP into an inactive heterodimer. These synthetic components have been successfully used in yeast [37] and, importantly, many of the protein-protein and protein-DNA binding affinities of this bZIP and inhibitor pair are known [38,39]; see Table I. We fixed these parameters and scanned through a range of other biophysical parameters to understand which ones affect oscillation. Our results should help guide future experimental implementation of synthetic ATC and RTC oscillators in yeast.
Fig. 2.
A biophysical model for ATC (a) and RTC (b) with explicit transcription, translation, protein-protein, and protein-DNA interactions. Each arrow corresponds to a reaction rate in Eqs. (1)–(3). Neither of these titration-based oscillators have been built or studied by synthetic biologists.
Table I.
Parameter values.
| Parameter | Min | Max | Reference | |
|---|---|---|---|---|
| θ (min−1) | 0.0188 | 34.5 | [13–16] | |
| ATC ρf (min −1) | 0.0509 | 0.1781 | [50] | |
| RTC ρf (min −1) | 0.1781 | 0.8928 | [50] | |
| δm (min −1) | 0.0159 | 0.1516 | [50] | |
| f | 1 | 30 | ||
| ATC ρb (min −1) | fρf | |||
| RTC ρb (min−1) | ρf/f | |||
| α (nM −1 min−1) | θ/3.344 nM | [39] | ||
| ρ0 (min −1) |
|
|||
| β (min −1) | 14.1 | [50–52] | ||
| δp (min−1) | 0.0077 | |||
| γ (nMmin −1) | 0.6 | [37] | ||
| ε1 (min −1) | 6 | [37] | ||
| ε2 (min−1) | 0.024 | [37] | ||
| V (fL) | 40 | [27] | ||
The biophysical model of our ATC and RTC circuits is based on chemical mass-action kinetics where the dynamic variables are the mean concentrations of all molecular species. The ordinary differential equations (ODEs) that correspond to the reactions in Fig. 2 are the following:
| (1a) |
| (1b) |
| (1c) |
| (1d) |
| (1e) |
| (1f) |
With [rX] and [rI] described by:
| (2a) |
| (2b) |
for the ATC, where X = A (activator), and
| (3a) |
| (3b) |
for the RTC, where X = R (repressor). The first two equations represent the dynamics of promoter DNA where [G0] and [G1] are the mean concentrations of free and bound promoter, respectively. The molar concentration of total DNA [GT] = [G0] + [G1] = 1/(NA V) = 1/24 nM where NA is the Avogadro constant and V is the yeast cell volume; see Table I. Here we consider only a single DNA binding site, but we will later expand our analysis to include multiple binding sites. At any instant, the promoter is either free or bound. The probability of free or bound promoters is equal to the ratio of concentrations [G0]/[GT] or [G1]/[GT], respectively. The other equations describe the mean concentration dynamics of the respective molecular species such as mRNA (rI, rX), monomeric protein (I or X), and dimeric proteins (X2, XI), where X stands for the activator A or repressor R, respectively. The regulatory homodimer X2 associates with G0 at a rate α to form G1, which dissociates at the rate θ. The rI and rX are the inhibitor and activator (repressor) mRNAs. For the ATC, the activator mRNA [rX] is transcribed constitutively at the rate ρ0, where as the inhibitor mRNA is transcribed at rates ρf and ρb from free and bound DNA, respectively [Eqs. (2a) and (2b)]. In contrast, for the RTC, the repressor mRNA is transcribed at rates ρf and ρb [Eqs. (3a) and (3b)] while inhibitor mRNA rI is constitutively transcribed at the rate ρ0. We assume that all mRNA species are degraded at the same rate δm and translated into proteins with the same rate β. The activator (repressor) X protein dimerizes into active homodimer X2 and forms inactive heterodimer XI with the inhibitor protein I at the same rate γ. The homodimer and heterodimer dissociation rates are ε1 and ε2, respectively. We assume that all protein species are stable and diluted by cell growth at rate δp.
B. DNA Unbinding Kinetics Influence Oscillation
Our parameters were restricted to physiological values from yeast (see Table I). Most parameters were kept fixed, but we varied four key parameters. The first parameter was the mRNA production rate (ρf) of free, unbound promoter because a desired expression level can easily be selected from existing promoter libraries [40]. Second, we varied the activation-repression strength (f), which is the ratio of the larger ρ divided by the smaller ρ. Thus, f = ρb/ρf for the ATC and f = ρf/ρb for the RTC. The ratio f can be tuned by appropriate choice of activation or repression domains fused to our bZIP transcription factor [41–43]. The third parameter was the mRNA degradation rate (δm), which is known to set the time scale of the ATC oscillator [19]. Last, we varied the DNA unbinding rate (θ) because it is our point of focus and this parameter can vary between different transcription factors. The DNA dissociation constant (Kd) fixes the DNA binding rate α = θ/Kd; see the Appendix for details.
We divided the physiological range of each variable parameter into 30 values (on a logarithmic scale) and evaluated the long-term dynamics of a total of (30)4 parameter sets per circuit. We solved the ODEs over time for each set of (ρf, f, δm, θ). A solution was classified as oscillatory if the trough of activator or repressor homodimer concentration was below the Kd of DNA binding and if the peak was above 2Kd; see the Appendix for justification. We noticed that ρf had the smallest effect on the number of oscillatory solutions and, thus, we plot the marginal frequency distribution of oscillatory solutions over f, δm, and θ in Fig. 3. We see that strong activators (large f for the ATC), stable mRNAs (small δm), and slow DNA unbinding rates (small θ) generally favor oscillation. The last two parameters dictate the time scale of the delay in the negative feedback loop. Increased delay supports oscillation and, thus, the largest number of oscillatory solutions occur at the smallest θ and δm for both RTC [Fig. 3(a)] and ATC [Fig. 3(b)]. The parameter space of stable oscillations is larger in ATC relative to RTC for a single binding site because of the additional step and delay in the negative feedback loop: Negative feedback through the activator in the ATC is indirect (i.e., activator regulates the expression of inhibitor, which then inhibits its activity), whereas the self-repressor in the RTC is direct (i.e., repressor regulates its own expression).
Fig. 3.
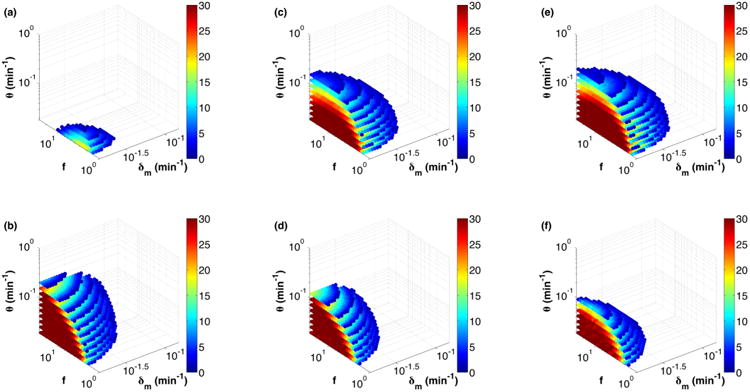
(Color online) Parameter space of oscillatory solutions on a logarithmic scale for RTC (top) and ATC (bottom) with increasing DNA binding sites. The color map shows the number of ρf values that exhibited oscillations for each combination of f, δm, andθ. [(a) and (b)] Single DNA binding site for RTC and ATC, [(c) and (d)] three independent binding sites for RTC and ATC, and [(e) and (f)] three synergistic binding sites for RTC and ATC, where repression (activation) strength is f2 when more than one repressor (activator) is bound.
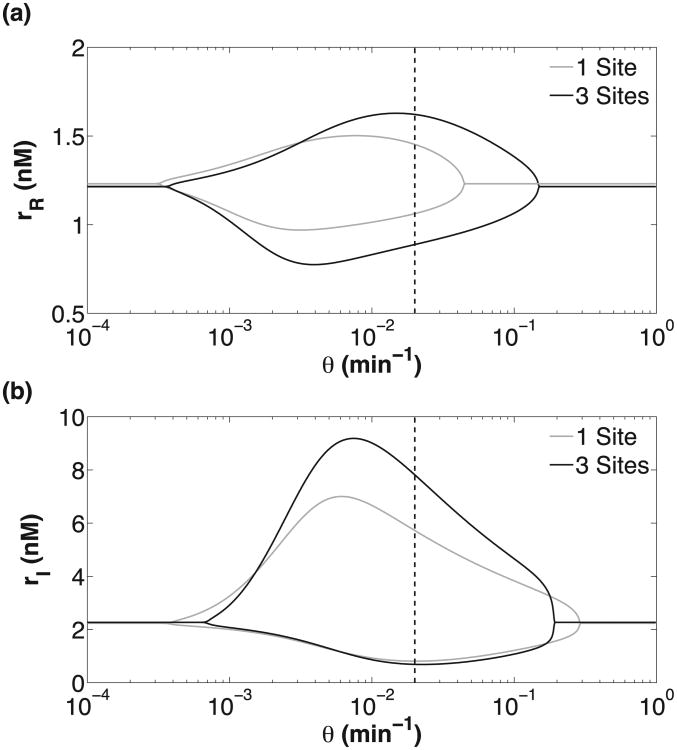
The period of oscillation τ should be set by the time scale of the slowest parameters in the delay. The negative feedback in our circuits is dominated by DNA unbinding rate θ and mRNA degradation rate δm [19]. This relationship can be seen in Fig. 4 where the DNA unbinding rate sets the oscillation period at low θ. An increase in θ leads to the mRNA degradation rate (δm) becoming the slower time scale at which point τ becomes flatter and less dependent on θ. Eventually, a bifurcation occurs at a critical, maximum value of θmax which leads to loss of the stable limit cycle. A similar relationship exists for the mRNA degradation rate δm; see Fig. S2.
Fig. 4.
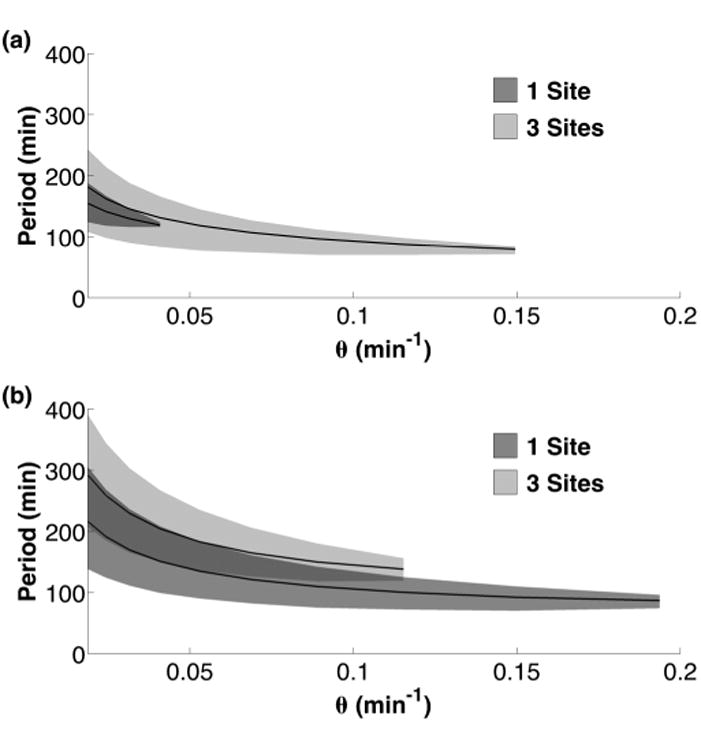
The DNA unbinding rate θ sets the period of the oscillations for RTC (a) and ATC (b) at slow unbinding rates. The mean period of oscillatory solutions for a given θ is shown (solid black line) with the shaded area representing the range of periods.
C. Multiple DNA binding sites affect ATC and RTC oscillators differently
This role of DNA unbinding rate in generating delays led us to hypothesize that multiple DNA binding sites should increase the parameter space of oscillations and lengthen the period of the oscillators. We reasoned that if the occupancy of any binding site by a transcription factor activates or represses transcription, then the effective unbinding rate (θn) from a state of saturated DNA binding to the unbound DNA state (G0, where the transcription rate changes) should decrease with the increasing number of binding sites (n). We can show that θn = θ/Hn, where Hn is the nth harmonic number (see the Supplemental Material [44]).
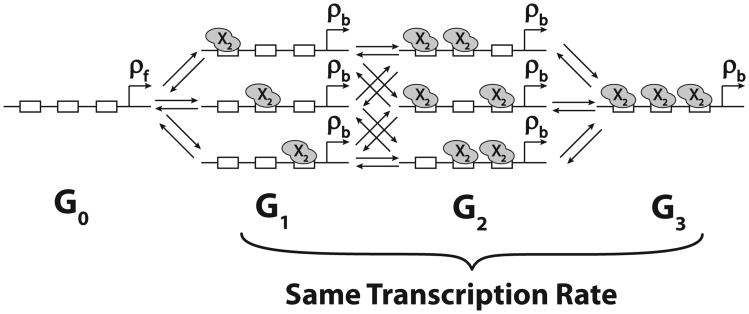
The addition of multiple DNA binding sites to our model will modify Eqs. (1a), (1b), and (1f) by increasing the number of promoter states that can be bound by X2; see Fig. 5 and the Supplemental Material [44]. For three binding sites (n = 3), our new Eqs. (1a) and (1b) are
Fig. 5.
Transitions between promoter states for multiple DNA binding sites (n = 3). Gi denotes the set of promoter states with i out of total n binding sites occupied by activator (X = A) or repressor (X = R) dimers. Our model conservatively assumes that the binding of X2 does not affect the binding or unbinding of the next transcription factor to an adjacent site (no cooperativity). We also assume that the transcription rate is equal to ρb for G1,G2, … Gn promoter states.
| (4) |
where the total concentration of DNA [GT] = [G0] + [G1] + … + [Gn] is fixed to 1/(NA V) = 1/24 nM. For three binding sites (n = 3), the term −α[G0][X2] + θ[G1] in Eq. (1f) is replaced with:
| (5) |
where Gi denotes the promoter states with i of total n binding sites occupied by activator (X = A) or repressor (X = R) dimers. The factors in front of each term represents the amount of degeneracy of each state, i.e., each Gi has i bound states, thus i ways of switching to Gi−1. Therefore, we have the term iθ[Gi]. At the same time, each Gi has n − i vacant sites, so it has n − i ways of switching to the state Gi+1. Thus, we have the term (n − i)α[Gi][X2].
The addition of two more independent DNA binding sites dramatically increased the oscillatory space of the RTC [Fig. 3(c)], while slightly decreasing the oscillatory space of the ATC [Fig. 3(d)]. These opposite results arise from a compound effect. First, two extra binding sites decreased the effective unbinding rate for the promoter to be fully vacated by half (θ/H3 ≈ θ/2). This decrease in effective θ increased the delay and resulted in some improvement in oscillations for both RTC and ATC. This effect is best observed in the increased period of both oscillators (Fig. 4). The second, more dominant effect is the fundamental difference in how the promoter sensitivity changes with multiple, independent binding sites. It is well established that nonlinear promoter responses facilitate oscillation [28]. We use the logarithmic sensitivity (S) to quantify the nonlinearity in the promoter response, where S = dlogP/dlog[X2] [45]. P is the synthesis rate of the promoter and [X2] is the activator or repressor homodimer concentration that regulates the promoter. As shown previously [45,46], an increase in the number of independent repressive binding sites will increase the magnitude of S and create an ultrasensitive promoter response, (i.e., |S| > 1, see the Supplement Material [44]). However, increasing the number of independent activating binding sites cannot generate an ultrasensitive promoter response (|S| ≤ 1); see the discussion in Ref. [45]. In fact, the logarithmic sensitivity for activation actually decreased with the number of binding sites at our physiological concentrations (see the Supplemental Material [44]). This difference is the reason why the RTC and ATC oscillators exhibited fundamental differences to increased number of binding sites. Our work shows that synthetic repression-based oscillators are preferable designs because the RTC gets an effective boost in promoter ultrasensitivity simply by adding multiple, independent binding sites.
We also tested whether synergistic repression or activation might change our results. Synergistic activation or repression occurs when the states that have more than one binding site occupied (i.e., G2 and G3) are activated or repressed f2-fold instead of f-fold because they can interact with RNA polymerase at several interfaces [45]. Although this synergy increased the activation or repression strength, it did not significantly change the oscillatory parameter space [Figs. 3(e) and 3(f)].
III. Stochastic Simulations
Deterministic simulations were useful for understanding how DNA unbinding rate and the number of binding sites affect the phase space and period of oscillation. However, they cannot provide insights into the loss of temporal coherence that arises from stochastic gene expression. To this end, we used the Gillespie algorithm [47] to simulate stochastic chemical reaction kinetics and investigate how DNA binding-unbinding dynamics and the addition of binding sites affect the temporal coherence of ATC and RTC oscillators.
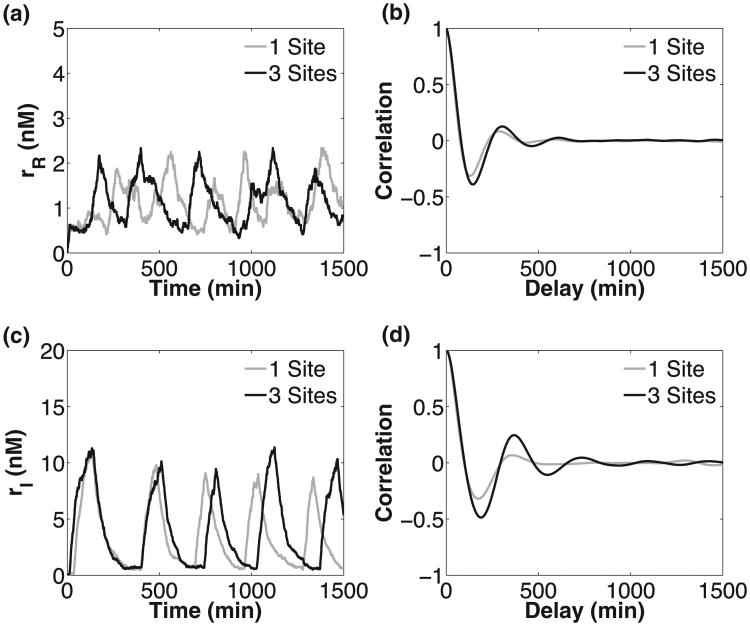
For each ATC and RTC, we quantified temporal coherence by calculating the autocorrelation function of mRNA transcripts levels (repressor mRNA for the RTC and inhibitor mRNA for the ATC); see Fig. 6. In the absence of noise, an undamped oscillatory signal will have an undamped, periodic autocorrelation function. The presence of noise will stochastically perturb period and phase, such that the autocorrelation now exhibits dampening or loss of temporal coherence. We quantified the loss of coherence by measuring the rate of exponential decay (e−t/τ0) of the envelope of a periodic [cos(2πt/τ)] autocorrelation function (see the Appendix for details). Similarly to other studies [4,18], our metric for temporal coherence is the normalized autocorrelation function decay rate, which is the ratio of time scales τ0/τ. A larger ratio indicates better temporal coherence. We varied the DNA unbinding rate (θ) and number of binding sites (n) to understand the role of each feature in resisting molecular noise.
Fig. 6.
Sample stochastic trajectories for one and three binding sites for RTC (a) and ATC (c), and their autocorrelation functions [(b) and (d)]. The variable parameter values (θ, δm, ρf, f) were fixed to (0.02 min−1, 0.0159 min−1, 0.8928 min−1, 3.63) for the RTC and (0.02 min−1, 0.0186 min−1, 0.1781 min−1, 30) for the ATC. We chose parameters that produced oscillation over the largest range of DNA unbinding rates. The rest of the parameters are given in Table I.
A. DNA unbinding rate
Our results show that ATC and RTC oscillators with smaller DNA unbinding rates exhibit better temporal coherence (Fig. 7). Lower θ increases the temporal coherence of the oscillations because of the increased distance of the dynamical system from the bifurcation point (θmax); see Fig. 8. Eventually there is another bifurcation at small θmin, but these unbinding rates are unphysiological and do not affect our conclusions regarding biophysical ATC and RTC oscillators. Strikingly, some θ > θmax, which do not show deterministic oscillation, exhibit oscillation in the presence of noise. This phenomenon is consistent with coherence resonance [48] which has been observed in other excitable, genetic circuits near oscillatory bifurcation points [12,24].
Fig. 7.
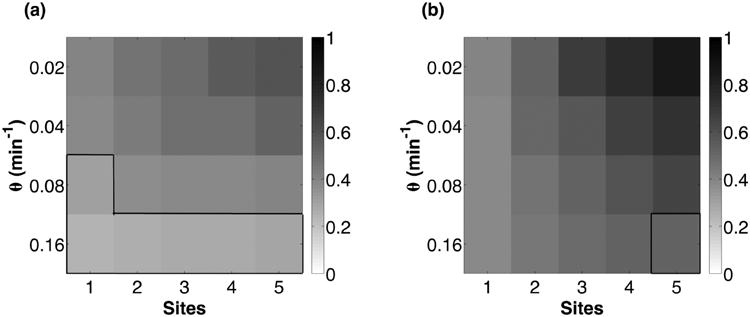
The normalized autocorrelation function decay rate for the RTC (a) and ATC (b) for varying θ and number of binding sites. All parameters, except θ, are the same as in Fig. 6. Boxed, outlined regions are parameters past the bifurcation point (θmax) where deterministic oscillations are unsustainable and damped, yet exhibit stochastic excitable oscillations.
Fig. 8.
Bifurcation diagram of the RTC (a) and ATC (b) oscillators as a function of DNA unbinding rate (θ). All parameters, except θ, are the same as in Fig. 6. There are two bifurcation points (θmax,θmin) and the amplitude of mRNA oscillation is shown by the upper and lower branches. Physiological values of θ are to the right of the dashed vertical line.
B. Multiple DNA binding sites
Increasing the number of binding sites (n) also increased the temporal coherence of ATC and RTC oscillators over all DNA unbinding rates (Fig. 7). To better understand this result, we must consider the effect of stochastic binding and unbinding of regulators on the variance of gene expression. In the phase of changing activator or repressor concentrations, the binding sites start being occupied or vacated. Each additional binding site introduces an additional DNA binding state. Because we treat the expression level of all bound DNA states as equivalent (ρb), the spontaneous binding and unbinding events that occur between states that have at least one binding site occupied have no effect on transcription; see Fig. 5. These “protected” states act as a buffering mechanism to mitigate the effects of binary noise on temporal coherence.
IV. Discussion
We analyzed the properties of two titration based genetic oscillators, the ATC and the RTC. The focus of our study was to understand how the number of DNA binding sites and slow unbinding kinetics in promoters mitigate or exacerbate the binary gene regulation noise. First, we showed that multiple DNA binding sites and slow unbinding kinetics were important for providing the necessary delay in the negative feedback loop for oscillatory solutions. The role of slow DNA binding-unbinding in providing delay for oscillations is consistent with prior work on a small negative feedback oscillator [9]. Second, we used stochastic simulation to show that slower DNA unbinding rates exhibited better temporal coherence, a result which appears at odds with previous work on circadian clocks and NF-κB oscillators [3,10,12] and which is more in line with the results obtained for a small negative feedback oscillator model [9]. Previous work showed that slower DNA unbinding kinetics negatively affected the temporal coherence for two reasons. First, slow DNA unbinding increased the stochasticity of gene expression due to imprecise concentration sampling, which decreased the temporal coherence of oscillations [3,10]. Second, slower DNA unbinding (θ) pushed the dynamical system towards θmin bifurcation point, which made it less robust to noise [12]. These results differ from ours because the delays in the circadian clock and NF-κB models rely on slow intermediate steps (e.g., phosphorylation and/or nuclear transport) in the negative feedback loop. Unlike our titration-based oscillators in Fig. 8, these models do not have θmax and still oscillate at infinitely fast unbinding rates where the promoters are in dynamic equilibrium.
We observed the opposite effect for our titration-based oscillators because physiological θ overlaps the θmax bifurcation point for ATC-RTC. Thus, lowering θ always increases the robustness in ATC-RTC because the dynamical system is moving away from θmax and deeper into oscillatory parameter space. This phenomenon likely explains the similar results presented in Ref. [9]. The influence of DNA unbinding rate on temporal coherence depends on the structure of the underlying bifurcation diagram of each oscillator as a function of θ. Changes in topology, mechanism, and parameters can change the bifurcation diagram and, thus, the influence of DNA unbinding rate on temporal coherence of oscillation may also change.
Last, we demonstrate that multiple independent binding sites consistently increased the temporal coherence of oscillations by alleviating the binary noise resulting from binary gene states. Our results agree with previous work, which showed that multiple, cooperative DNA binding sites increased the coherence of circadian clocks [18]. However, in contrast to our results, the temporal coherence of circadian clocks peaked at three binding sites and then decreased with additional sites. The difference likely arises from our slower DNA binding-unbinding rates, where the ATC and RTC oscillators spend significant time in protected states that are buffered against molecular noise. In contrast, the circadian clock model spends very little time in the intermediate protected states between fully free or fully bound promoters and, therefore, the increased coherence is only due to cooperativity [18]. The idea of buffering to reduce noise in gene circuits has been discussed in the context of decoy binding sites [49]. However, this requires fast DNA binding-unbinding, where as buffering through promoter states requires slow DNA binding-unbinding. We note that increased temporal coherence due to protected states is a stochastic effect because the addition of binding sites consistently increased the coherence of ATC oscillators, despite occasionally pushing it past the bifurcation point at θmax ]Fig. 6(b)].
Acknowledgments
We thank Joshua Socolar for helpful comments. This work was funded by an NIH Director's New Innovator Award (DP2 OD008654-01) and Burroughs Wellcome Fund CASI Award (BWF 1005769.01). An SBML version of the ATC and RTC oscillators can be downloaded from the BioModels Database (MODEL1512100000 and MODEL1512100001, respectively).
Appendix A: Parameter Values
To constrain the physiological parameters of our models, we used data from large-scale studies of the yeast transcriptome and proteome; see Table I. These data provide typical ranges and values for our parameters. First, we converted numbers of molecules into nanomolar (nM) concentrations using the cell volume V = 40 fL for haploid yeast. For the ATC, we assumed that the basal mRNA transcription would be low. Thus, ρf for the ATC was constrained to values from the bottom 5th percentile to the median of all mRNA synthesis rates [50]. Similarly, ρf for the RTC was constrained to values from the median to top 95th percentile. In the case of the ATC, the constraint ρf < ρ0 < ρb ensured that the inhibitor can completely titrate the constitutively expressed activator when the inhibitor is maximally produced at ρb but not when it is expressed at the basal rate ρf. Similarly, for the RTC, the constraint ρb < ρ0 < ρf ensures that constitutively expressed inhibitor can completely titrate the repressor when the repressor is produced at the repressed rate ρb but not ρf. We set to satisfy both conditions. mRNA degradation rate ranged from the bottom 5th percentile to top 95th percentile values for all genes [50]. To obtain a rough approximation for the translation rates, we assumed a constitutive gene expression model for all genes:
| (A1) |
| (A2) |
At steady state, . Protein concentrations and degradation rates were taken from Refs. [51,52]. We calculated β for all genes and used the median value in our model. We also assumed that our activators, repressors, and inhibitors are not actively degraded and are diluted by growth. Thus, δp = ln(2)/T, where T = 90 min is the duration of the yeast cell cycle. The proteins in our models were based on a mammalian transcription factor basic leucine zipper (bZIP) protein C/EBPα and its dominant-negative inhibitor (3HF) [37]. We used previously measured rates for protein-protein interaction kinetics [37]. Since we did not know the DNA unbinding rate for C/EBPα, we considered the range for the known DNA unbinding rates for other bZIP proteins [13–16]. The thermodynamic dissociation constant (Kd) of C/EBPα to its specific DNA binding site is known [39]. We set the DNA association rate to α = θ/Kd. Finally, we varied the activation-repression strength f from 1 to 30 to consider both strong and weak activation-repression.
Appendix B: Methods
We scanned the parameter space for oscillations by running simulations on matlab (Mathworks) using ode15s for 2000 min and recording the minima and maxima of the activator or repressor homodimer during the last 1000 min. We imposed the following restrictions: (1) the last minimum should be below Kd so DNA binding is not saturated, and (2) the last maximum should be greater than 2Kd so the change in transcription is noticeably altered. While this restriction slightly underestimates the number oscillatory solutions, it ensures that a synthetic version of these circuits would produce detectable oscillations. We verified that our definition gave similar results to a less stringent criterion for oscillation.
We used the direct Gillespie method to perform the stochastic simulations [53]. We ran the simulations for 106 min and recorded the concentration of the regulated mRNA (inhibitor for the ATC and the repressor for the RTC). We then normalized the concentration such that the average would be zero and evaluated the autocorrelation function. We then fit the function C(t) = e−t/τ0cos(2πt/τ) to the first 1500 min of the autocorrelation function to measure the decay constant τ0 and period τ. The ratio τ0/τ describes how rapidly the envelope of autocorrelation function decays per oscillation period.
References
- 1.Schrödinger E. What Is Life? The Physical Aspect of the Living Cell. Cambridge University Press; Cambridge: 1944. [Google Scholar]
- 2.Gonze D, Halloy J, Goldbeter A. J Biol Phys. 2002;28:637. doi: 10.1023/A:1021286607354. [DOI] [PMC free article] [PubMed] [Google Scholar]
- 3.Forger DB, Peskin CS. Proc Natl Acad Sci USA. 2005;102:321. doi: 10.1073/pnas.0408465102. [DOI] [PMC free article] [PubMed] [Google Scholar]
- 4.Gonze D, Goldbeter A. Chaos. 2006;16:026110. doi: 10.1063/1.2211767. [DOI] [PubMed] [Google Scholar]
- 5.Golding I, Paulsson J, Zawilski SM, Cox EC. Cell. 2005;123:1025. doi: 10.1016/j.cell.2005.09.031. [DOI] [PubMed] [Google Scholar]
- 6.Cai L, Friedman N, Xie XS. Nature. 2006;440:358. doi: 10.1038/nature04599. [DOI] [PubMed] [Google Scholar]
- 7.Hornos JEM, Schultz D, Innocentini GCP, Wang J, Walczak AM, Onuchic JN, Wolynes PG. Phys Rev E. 2005;72:051907. doi: 10.1103/PhysRevE.72.051907. [DOI] [PubMed] [Google Scholar]
- 8.Walczak AM, Onuchic JN, Wolynes PG. Proc Natl Acad Sci USA. 2005;102:18926. doi: 10.1073/pnas.0509547102. [DOI] [PMC free article] [PubMed] [Google Scholar]
- 9.Feng H, Han B, Wang J. Biophys J. 2012;102:1001. doi: 10.1016/j.bpj.2012.02.002. [DOI] [PMC free article] [PubMed] [Google Scholar]
- 10.Potoyan DA, Wolynes PG. Proc Natl Acad Sci USA. 2014;111:2391. doi: 10.1073/pnas.1323433111. [DOI] [PMC free article] [PubMed] [Google Scholar]
- 11.Labavić D, Nagel H, Janke W, Meyer-Ortmanns H. Phys Rev E. 2013;87:062706. doi: 10.1103/PhysRevE.87.062706. [DOI] [PubMed] [Google Scholar]
- 12.Gonze D, Halloy J, Goldbeter A. Physica A. 2004;342:221. [Google Scholar]
- 13.Kwon H, Park S, Lee S, Lee DK, Yang CH. Eur J Biochem. 2001;268:565. doi: 10.1046/j.1432-1327.2001.01897.x. [DOI] [PubMed] [Google Scholar]
- 14.Kyo M, Yamamoto T, Motohashi H, Kamiya T, Kuroita T, Tanaka T, Engel JD, Kawakami B, Yamamoto M. Genes Cells. 2004;9:153. doi: 10.1111/j.1356-9597.2004.00711.x. [DOI] [PubMed] [Google Scholar]
- 15.Okahata Y, Niikura K, Sugiura Y, Sawada M, Morii T. Biochemistry. 1998;37:5666. doi: 10.1021/bi980037k. [DOI] [PubMed] [Google Scholar]
- 16.Geertz M, Shore D, Maerkl SJ. Proc Natl Acad Sci USA. 2012;109:16540. doi: 10.1073/pnas.1206011109. [DOI] [PMC free article] [PubMed] [Google Scholar]
- 17.Hammar P, Walldén M, Fange D, Persson F, Baltekin Ö, Ullman G, Leroy P, Elf J. Nat Genet. 2014;46:405. doi: 10.1038/ng.2905. [DOI] [PMC free article] [PubMed] [Google Scholar]
- 18.Gonze D, Halloy J, Goldbeter A. Proc Natl Acad Sci USA. 2002;99:673. doi: 10.1073/pnas.022628299. [DOI] [PMC free article] [PubMed] [Google Scholar]
- 19.François P, Hakim V. Phys Rev E. 2005;72:031908. doi: 10.1103/PhysRevE.72.031908. [DOI] [PubMed] [Google Scholar]
- 20.Menet J, Abruzzi K, Desrochers J, Rodriguez J, Rosbash M. Genes Dev. 2010;24:358. doi: 10.1101/gad.1883910. [DOI] [PMC free article] [PubMed] [Google Scholar]
- 21.Hoffmann A, Levchenko A, Scott ML, Baltimore D. Science. 2002;298:1241. doi: 10.1126/science.1071914. [DOI] [PubMed] [Google Scholar]
- 22.Nelson DE, Ihekwaba AEC, Elliott M, Johnson JR, Gibney CA, Foreman BE, Nelson G, See V, Horton CA, Spiller DG, Edwards SW, McDowell HP, Unitt JF, Sullivan E, Grimley R, Benson N, Broomhead D, Kell DB, White MRH. Science. 2004;306:704. doi: 10.1126/science.1099962. [DOI] [PubMed] [Google Scholar]
- 23.Barkai N, Leibler S. Nature. 2000;403:267. doi: 10.1038/35002258. [DOI] [PubMed] [Google Scholar]
- 24.Vilar JMG, Kueh HY, Barkai N, Leibler S. Proc Natl Acad Sci USA. 2002;99:5988. doi: 10.1073/pnas.092133899. [DOI] [PMC free article] [PubMed] [Google Scholar]
- 25.Krishna S, Jensen MH, Sneppen K. Proc Natl Acad Sci USA. 2006;103:10840. doi: 10.1073/pnas.0604085103. [DOI] [PMC free article] [PubMed] [Google Scholar]
- 26.Kim JK, Forger DB. Mol Syst Biol. 2012;8:630. doi: 10.1038/msb.2012.62. [DOI] [PMC free article] [PubMed] [Google Scholar]
- 27.Buchler NE, Louis M. J Mol Biol. 2008;384:1106. doi: 10.1016/j.jmb.2008.09.079. [DOI] [PubMed] [Google Scholar]
- 28.Novak B, Tyson JJ. Nat Rev Mol Cell Biol. 2008;9:981. doi: 10.1038/nrm2530. [DOI] [PMC free article] [PubMed] [Google Scholar]
- 29.Elowitz MB, Leibler S. Nature. 2000;403:335. doi: 10.1038/35002125. [DOI] [PubMed] [Google Scholar]
- 30.Atkinson MR, Savageau MA, Myers JT, Ninfa AJ. Cell. 2003;113:597. doi: 10.1016/s0092-8674(03)00346-5. [DOI] [PubMed] [Google Scholar]
- 31.Stricker J, Cookson S, Bennett MR, Mather WH, Tsimring LS, Hasty J. Nature. 2008;456:516. doi: 10.1038/nature07389. [DOI] [PMC free article] [PubMed] [Google Scholar]
- 32.Novak B, Tyson JJ. J Theor Biol. 1993;165:101. [Google Scholar]
- 33.Nakajima M, Ito H, Kondo T. FEBS Lett. 2010;584:898. doi: 10.1016/j.febslet.2010.01.016. [DOI] [PubMed] [Google Scholar]
- 34.Yang Q, Ferrell JE. Nature Cell Biol. 2013;15:519. doi: 10.1038/ncb2737. [DOI] [PMC free article] [PubMed] [Google Scholar]
- 35.Wong WW, Tsai TY, Liao JC. Mol Syst Biol. 2007;3:130. doi: 10.1038/msb4100172. [DOI] [PMC free article] [PubMed] [Google Scholar]
- 36.Mondragón-Palomino O, Danino T, Selimkhanov J, Tsimring L, Hasty J. Science. 2011;333:1315. doi: 10.1126/science.1205369. [DOI] [PMC free article] [PubMed] [Google Scholar]
- 37.Buchler NE, Cross FR. Mol Syst Biol. 2009;5:272. doi: 10.1038/msb.2009.30. [DOI] [PMC free article] [PubMed] [Google Scholar]
- 38.Krylov D, Olive M, Vinson C. EMBO J. 1995;14(21):5329. doi: 10.1002/j.1460-2075.1995.tb00217.x. [DOI] [PMC free article] [PubMed] [Google Scholar]
- 39.Cao Z, Umek RM, McKnight SL. Genes Dev. 1991;5:1538. doi: 10.1101/gad.5.9.1538. [DOI] [PubMed] [Google Scholar]
- 40.Keren L, Zackay O, Lotan-Pompan M, Barenholz U, Dekel E, Sasson V, Aidelberg G, Bren A, Zeevi D, Weinberger A, Alon U, Milo R, Segal E. Mol Syst Biol. 2013;9:701. doi: 10.1038/msb.2013.59. [DOI] [PMC free article] [PubMed] [Google Scholar]
- 41.Baron U, Gossen M, Bujard H. Nucl Acids Res. 1997;25:2723. doi: 10.1093/nar/25.14.2723. [DOI] [PMC free article] [PubMed] [Google Scholar]
- 42.Bellí G, Garí E, Piedrafita L, Aldea M, Herrero E. Nucl Acids Res. 1998;26:942. doi: 10.1093/nar/26.4.942. [DOI] [PMC free article] [PubMed] [Google Scholar]
- 43.Perez-Pinera P, Ousterout DG, Brunger JM, Farin AM, Glass KA, Guilak F, Crawford GE, Hartemink AJ, Gersbach CA. Nat Methods. 2013;10:239. doi: 10.1038/nmeth.2361. [DOI] [PMC free article] [PubMed] [Google Scholar]
- 44.See Supplemental Material at http://link.aps.org/supplemental/10.1103/PhysRevE.92.062712 for the derivation of promoter sensitivity, unbinding from multiple sites, and additional figures.
- 45.Bintu L, Buchler NE, Garcia HG, Gerland U, Hwa T, Kondev J, Kuhlman T, Phillips R. Curr Opin Genet Dev. 2005;15:125. doi: 10.1016/j.gde.2005.02.006. [DOI] [PMC free article] [PubMed] [Google Scholar]
- 46.Lengyel IM, Soroldoni D, Oates AC, Morelli LG. Papers Phys. 2014;6:060012. doi: 10.4279/PIP.060012. [DOI] [PMC free article] [PubMed] [Google Scholar]
- 47.Gillespie D. J Phys Chem. 1977;81:2340. [Google Scholar]
- 48.Pikovsky AS, Kurths J. Phys Rev Lett. 1997;78:775. [Google Scholar]
- 49.Burger A, Walczak AM, Wolynes PG. Phys Rev E. 2012;86:041920. doi: 10.1103/PhysRevE.86.041920. [DOI] [PubMed] [Google Scholar]
- 50.Miller C, Schwalb B, Maier K, Schulz D, Dümcke S, Zacher B, Mayer A, Sydow J, Marcinowski L, Dölken L, Martin DE, Tresch A, Cramer P. Mol Syst Biol. 2011;7:458. doi: 10.1038/msb.2010.112. [DOI] [PMC free article] [PubMed] [Google Scholar]
- 51.Ghaemmaghami S, Huh WK, Bower K, Howson RW, Belle A, Dephoure N, O'Shea EK, Weissman JS. Nature. 2003;425:737. doi: 10.1038/nature02046. [DOI] [PubMed] [Google Scholar]
- 52.Belle A, Tanay A, Bitincka L, Shamir R, O'Shea EK. Proc Natl Acad Sci USA. 2006;103:13004. doi: 10.1073/pnas.0605420103. [DOI] [PMC free article] [PubMed] [Google Scholar]
- 53.Hoops S, Sahle S, Gauges R, Lee C, Pahle J, Simus N, Singhal M, Xu L, Mendes P, Kummer U. Bioinformatics. 2006;22:3067. doi: 10.1093/bioinformatics/btl485. [DOI] [PubMed] [Google Scholar]


