SUMMARY
The discovery of long non-coding RNA (lncRNA) has dramatically altered our understanding of cancer. Here, we describe a comprehensive analysis of lncRNA alterations at transcriptional, genomic, and epigenetic levels in 5,037 human tumor specimens across 13 cancer types from the Cancer Genome Atlas (TCGA). Our results suggest that the expression and dysregulation of lncRNAs are highly cancer-type specific compared to protein-coding genes. Using the integrative data generated by this analysis, we present a clinically guided small interfering RNA screening strategy and a co-expression analysis approach to identify cancer driver lncRNAs and predict their functions. This provides a resource for investigating lncRNAs in cancer and lays the groundwork for the development of new diagnostics and treatments.
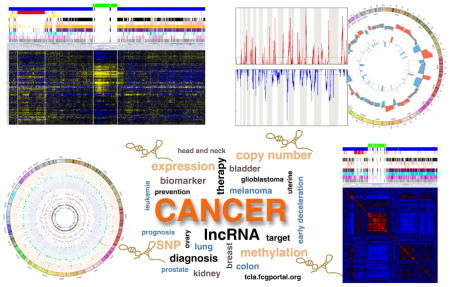
Graphical Abstract
INTRODUCTION
Cancer is a genetic disease involving multi-step changes in the genome. The human genome contains ~20,000 protein-coding genes (PCGs), representing less than 2% of the total genome (Ezkurdia et al., 2014), whereas up to 70% of the human genome is transcribed into RNA, yielding many thousands of non-coding RNAs (Derrien et al., 2012; Mattick and Rinn, 2015). Long non-coding RNAs (lncRNAs) are operationally defined as transcripts that are larger than 200 nt that do not appear to have protein-coding potential (Kapranov et al., 2007; Mattick and Rinn, 2015). Similar to protein-coding transcripts, transcriptional control of lncRNAs is subject to typical histone modification-mediated regulation, and lncRNA transcripts are processed by the canonical spliceosome machinery (Cabili et al., 2011; Derrien et al., 2012; Guttman et al., 2009; Ravasi et al., 2006). Compared to their protein-coding counterparts, lncRNA genes are composed of fewer exons, are under weaker selective constraints during evolution, and are present in relatively lower abundance. Notably, the expression of lncRNAs is strikingly cell type- and tissue-specific (Cabili et al., 2011; Mercer et al., 2008; Ravasi et al., 2006), and in many cases, even primate-specific (Derrien et al., 2012). LncRNAs can serve as scaffolds or guides to regulate protein-protein or protein-DNA interactions; as decoys to bind proteins or miRNAs; and as enhancers to influence gene transcription, when transcribed from enhancer regions or their neighboring loci (Batista and Chang, 2013; Guttman and Rinn, 2012; Karreth and Pandolfi, 2013; Lee, 2012; Mattick and Rinn, 2015; Mercer et al., 2009; Morris and Mattick, 2014; Orom and Shiekhattar, 2013; Prensner and Chinnaiyan, 2011; Ulitsky and Bartel, 2013). Importantly, rapidly accumulating evidence indicates that lncRNAs are associated with chromatin-modifying complexes and guide epigenetic regulations in both physiological and pathological conditions (Mercer and Mattick, 2013).
Recent studies suggested that lncRNA is involved in the initiation and progression of cancer. In addition to the fact that they are highly deregulated in tumors (Akrami et al., 2013; Calin et al., 2007; Du et al., 2013; Iyer et al., 2015; Kim et al., 2014; Li et al., 2015; Ling et al., 2013; Prensner et al., 2011; Trimarchi et al., 2014; Xing et al., 2014), lncRNAs have been found to act as tumor suppressors or oncogenes. Therefore, a comprehensive genomic characterization of lncRNA alterations across major cancers is not only urgently needed but may lead to new diagnostic and therapeutic strategies for cancer. The TCGA project is a coordinated effort to accelerate our understanding of the molecular basis of cancer through the application of genomic analysis technologies. Here, we performed a multiplatform integrative analysis of lncRNA alterations in 5,037 of cancers from 13 tumor types in TCGA project.
RESULTS
The expression of lncRNAs is dysregulated in cancer
We analyzed RNA sequencing profiles (RNA-seq) from 5,037 tumors across 13 cancer types as well as 424 normal specimens from nine matching tissue types in TCGA (Table S1). An evidence-based lncRNA transcript annotation that contains 13,562 manually annotated lncRNA genes from the GENCODE consortium (V18) was used to define lncRNAs. To evaluate the analysis reliability of the workflow for RNA-seq data in the present study, we compared 520 breast specimens whose RNA expression had been analyzed by both RNA-seq and microarray in TCGA. The transcriptomic correlations of RNA expression determined by RNA-seq (RPKM) and by microarray were calculated in a total of 13,318 PCGs and lncRNAs. In more than 96.7% of genes analyzed, significant and positive correlations were observed between the RPKM- and microarray-derived RNA expression levels (Figure S1A and B). To ensure detection reliability and reduce background noise, we applied two filters in each cancer type: the first eliminates any gene whose 50th percentile RPKM value is equal to 0; the second filter selects only genes whose 90th percentile RPKM value is greater than 0.1. On average, 4,409 lncRNAs (32.51% of lncRNAs annotated by GENCODE) were detected in each cancer type. Of these, 2,316 (17.08%) lncRNAs were commonly detected in all 13 cancer types and 8,179 (60.31%) lncRNAs were detected in at least one cancer type (Table S2 and Figure S1C). The lncRNAs detected in each cancer type are listed in Table S2.
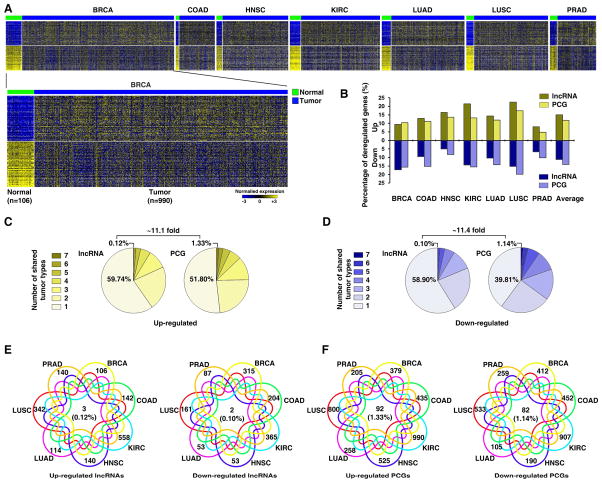
To characterize tumor-associated dysregulation of lncRNA expression, we analyzed lncRNA expression in seven cancer types for which the number of corresponding normal tissue samples analyzed by RNA-seq was greater than 20 (Figure 1A). Compared to their normal counterparts, the seven cancer types had on average 15.00% and 11.18% of lncRNAs significantly up- and down-regulated, respectively (Figure 1B). The lncRNAs whose RNA expression was significantly altered in each cancer type are listed in Table S2. Using the same pipeline, we also calculated the percentages of dysregulated PCGs and found that lncRNAs and PCGs have similar percentages of tumor-associated dysregulation of expression (Figure 1B). By comparing the dysregulated lncRNAs in different cancer types, we found that ~60% of these altered lncRNAs were cancer-type specific, and the rest were shared by at least two cancer types (Figure 1C and D; Figure S1D). We identified only five lncRNAs whose RNA expression was significantly altered in all seven cancer types (Figure 1E). The expression of many previously identified tumor-associated lncRNAs was found to be significantly dysregulated in multiple cancer types. For example, the oncogenic lncRNAs PCAT7, PVT1, and HOTAIR were significantly upregulated in six, five, and four cancer types, respectively. The lncRNAs whose dysregulated expression was shared or unique among different cancer types are listed in Table S2. Importantly, the percentage of cancer type-unique dysregulated lncRNAs was remarkably higher than that of PCGs (Figure 1C to F), although lncRNAs and PCGs have similar percentages of global dysregulation. Together, this demonstrates that the dysregulation of expression of lncRNA is common in cancer. While most lncRNAs showing dysregulated expression are cancer type-unique, a small number of alterations are shared among different cancer types.
Figure 1. The expression of lncRNAs is dysregulated in cancer.
A. Heatmap of lncRNAs whose expression is significantly dysregulated. The top 100 most significantly dysregulated lncRNAs from each individual tumor-type are presented. B. The percentages of the dysregulated lncRNAs and PCGs. C. and D. The percentages of the up- (C) and down- (D) regulated lncRNAs (left) and PCGs (right) that were shared among the seven cancer types. E. and F. Venn diagrams of the up- (left) and down- (right) regulated lncRNAs (E) and PCGs (F) shared among the seven cancer types. See also Figure S1 and Tables S1 and S2.
Somatic copy numbers of lncRNA genes are altered in cancer with different frequencies
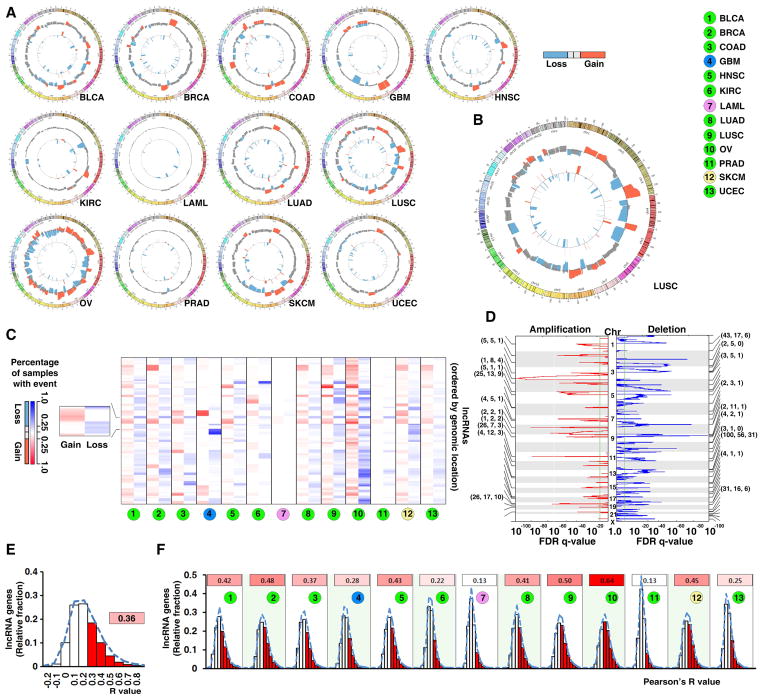
We analyzed the somatic copy number alterations (SCNAs) of lncRNAs in cancer via SNP microarray analysis of 5,860 tumors in 13 cancer types from TCGA. For each cancer type, the SCNA frequencies of the lncRNA-containing loci were calculated (Figure 2A and B). When “high-frequency alteration” is defined as an alteration that occurs in more than 25% of the specimens in a given cancer type, few lncRNA gene loci had concurrent high-frequency gain and loss in the same type of cancer (Figure S2A). Across all 13 cancer types, there were on average 13.16% and 13.53% of lncRNA genes with high-frequency gain or loss, respectively (Figure 2A to C, Table S3). While OV and LUSC had the most lncRNAs with high-frequency SCNAs, very few lncRNAs in PRAD and LAML had high-frequency alterations (Figure 2A and C).
Figure 2. Somatic copy numbers of lncRNA genes are altered in cancer with different frequencies.
A. A genome-wide view of SCNAs in cancers. The outer track shows the frequencies of SCNAs from the lncRNA-containing loci and the inner track shows the focal alteration regions. B. An enlarged view of SCNAs in LUSC. C. Heatmap of somatic copy number gain and loss for lncRNA genes. The rows, each of which represents an lncRNA gene locus, are arranged according to the genomic locations of the lncRNA genes. Left: frequency of gain (red); right: frequency of loss (blue). D. The lncRNA and PCGs in the top 20 focal gain (left) or loss (right) peaks in LUSC. The numbers of PCGs (left), annotated lncRNAs (middle), and detectable lncRNAs (right) in each peak are indicated in parentheses. E. and F. Histogram of percentage of lncRNAs whose RNA-SCNA correlation coefficients are in specific ranges across 13 cancer types (E) and in each cancer type (F). The number and red color intensity in the inserts indicate the percentage of the detectable lncRNAs whose Pearson’s R value was ≥0.2 in a given cancer type. See also Figure S2 and Tables S3.
To characterize the focal SCNAs that harbor lncRNA genes, we retrieved the location information of focal genomic alteration peaks from the Firehose project and mapped the lncRNA-containing loci to these focal alteration regions in each cancer type (Figure S2B and Table S3). In squamous cell lung carcinoma, for example, a total of 435 and 1,811 lncRNA genes were mapped to regions with focal gains and losses, respectively (Figure 2D). The lncRNA genes located in the focal alteration regions in other cancer types are shown in Figure S2B. Many previously identified tumor-associated lncRNAs were found to be associated with focal SCNAs in multiple cancer types. For example, the oncogenic lncRNAs FAL1(FALEC) and PVT1 were focally amplified in seven and six cancer types, respectively.
To estimate the contribution of SCNAs to lncRNA dysregulation in cancer, we analyzed the correlation between lncRNA copy number and RNA expression level for all detectable lncRNAs in each cancer type. In summary, for 36.27% of the lncRNAs there was a positive correlation (R≥0.2) between their RNA expression level and their gene copy number (Figure 2E). Importantly, cancer types that had higher levels of SCNAs (such as OV and LUSC), demonstrated stronger RNA-SCNA correlations than the cancer types with fewer SCNAs (such as LAML and PRAD) (Figure 2F). This suggests that SCNAs are an important mechanism that leads to the dysregulation of lncRNAs in cancer, especially for those cancer types whose genomes contain abundant SCNAs.
DNA methylation patterns in the promoter regions of lncRNA genes are altered in cancer
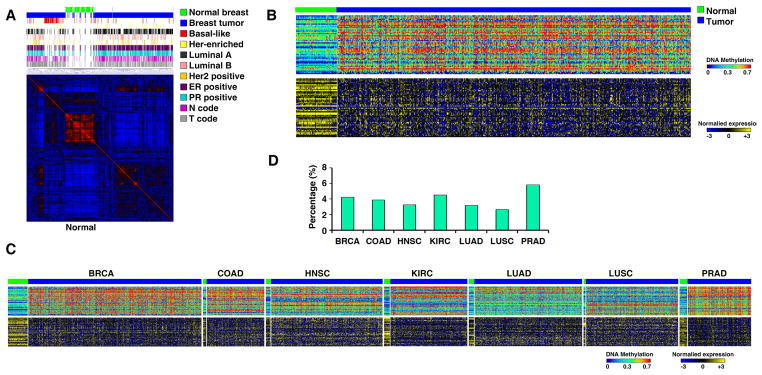
We analyzed DNA methylation alterations in the promoter regions of lncRNAs in cancers. DNA methylation microarray profiles on 2,791 tumor and 467 normal specimens across seven cancer types were obtained from TCGA. A total of 35,696 probes corresponding to the promoter regions of the 2,435 lncRNA genes whose expression was analyzed by RNA-seq were identified (Table S4). On average, the promoter region of each lncRNA gene was covered by 15 probes. We first used consensus non-negative matrix factorization (NMF) clustering analysis to cluster samples according to their methylation profiles in each cancer type. This revealed that, for all seven cancer types studied, the DNA methylation profiles of lncRNA genes from normal samples were very similar within the cancer type, while the DNA methylation patterns of lncRNA genes from tumor samples were quite diverse (Figure 3A and Figure S3). It suggests that the promoter regions of lncRNAs are subjected to DNA methylation-mediated epigenetic alterations during tumorigenesis. Next, we applied four separate filtering criteria to screen for cancer-associated epigenetically silenced lncRNA genes (CAESLG) (Figure 3B and C). On average, 3.92% of lncRNA genes had both hypermethylated promoters and reduced RNA expression in tumors compared to their normal counterparts (Figure 3D). The CAESLG candidates of each cancer type are listed in Table S4. These findings suggest that epigenetic silencing of lncRNA genes may be a mechanism that contributes to the dysregulation of expression of lncRNAs in cancer. Due to the probes for many lncRNA genes were not available in the DNA methylation microarray platform, some lncRNAs that are epigentically regulated may not be identified in our analysis.
Figure 3. DNA methylation patterns in the promoter regions of lncRNA genes are altered in cancer.
A. NMF clustering of DNA methylation probes that are located in lncRNA promoters and whose methylation β-values had the largest variations across all breast specimens. B. Heatmaps of the methylation status (β-value, upper) in the promoter regions and the RNA expression level (lower) of the corresponding lncRNAs in breast specimens. C. Heatmaps of the methylation status of the lncRNA promoter regions and the RNA expression levels. D. A summary of the percentage of the CAESLG. See also Figure S3 and Tables S4 and S5.
Many cancer-associated SNPs are located in lncRNA loci
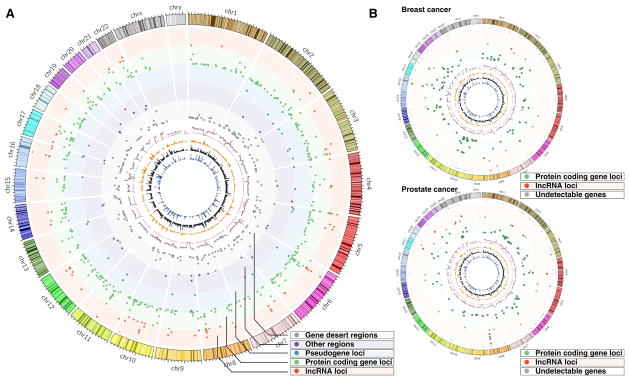
Using 5Kb as the cut-off distance between an annotated transcript and a cancer-associated SNP, we re-mapped all cancer-associated SNPs reported by the NHGRI Catalog of Published GWAS studies (Table S5) to genes annotated by ENCODE. We found that 11.75% of the index-SNPs were near loci harboring lncRNA genes (Table S5). The percentages of index-SNPs close to PCGs, pseudogenes, and other genes were 54.75%, 3.75%, and 3.38%, respectively (Figure 4A). We further reasoned that only genes expressed in tumor tissues have the potential to be functionally involved in cancer development. By analyzing RNA-seq profiles from TCGA in the nine cancer types for which both GWAS SNP and TCGA RNA-seq information were available and combining the expression analysis with the above findings regarding SNP-associated lncRNA, we identified lncRNAs that are both close to index SNPs and that express detectable transcripts in tumors (Table S5). In PRAD, for example, 24 lncRNAs were found to reside near 28 index-SNPs. Among these 24 lncRNAs, six were detected in prostate tumors (Figure 4B).
Figure 4. Many cancer-associated SNPs are located in lncRNA loci.
A. A genome-wide view of the most significant cancer-associated index SNPs. The peaks in each track are proportional to the p-values between the chromosomal locations of the index-SNPs. B. Genome-wide view of the breast (upper) and prostate (lower) index-SNPs in lncRNA (red) and PCG loci (green).
The expression of lncRNAs is a specific biomarker in cancer
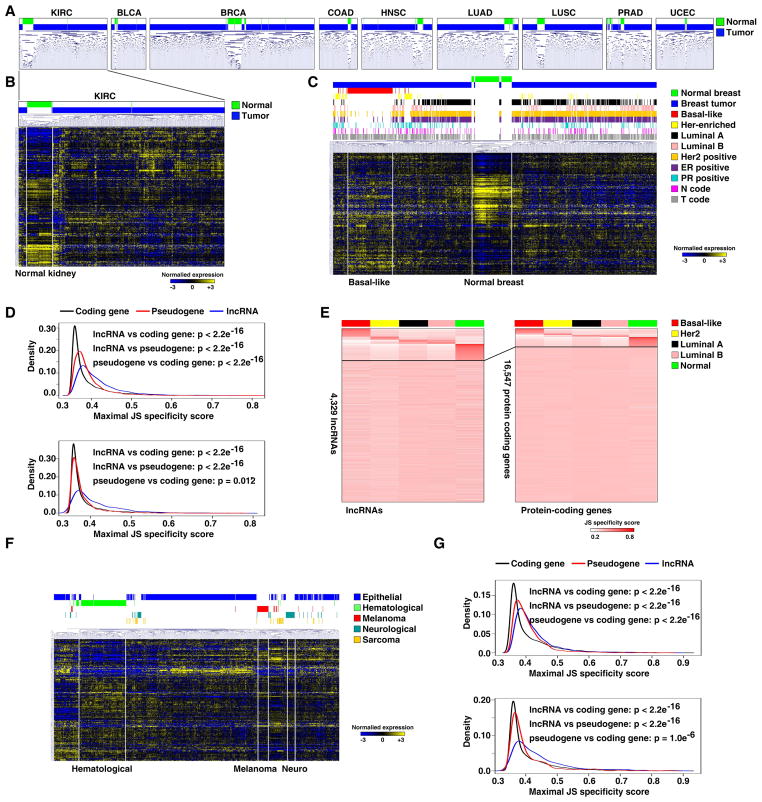
To evaluate the potential value of lncRNAs as biomarkers in cancer, we first asked whether the expression signature of lncRNAs can differentiate between tumors and their corresponding normal tissues. In all nine tumor types where both tumor and normal tissues were available, we were able to use unsupervised cluster analysis to differentiate normal tissues from tumors. While the expression of lncRNAs in tumor demonstrated diverse patterns, the expression in normal tissue was relatively homogenous and could be clearly separated from the expression patterns in tumor tissues (Figures 5A and B and Figure S4A). To further examine the value of lncRNAs as biomarkers, we chose to study breast cancer, since it is a heterogeneous cancer type with well-characterized pathological and molecular subtypes. We selected 817 breast tumors for which the molecular subtype had been defined by the UCSC Cancer Genome Browser. A cluster analysis showed that the unsupervised lncRNA expression subtypes demonstrated a high correlation with the defined PAM50 subtypes, and also had a high correlation with clinical subtypes (Figure 5C). In particular, almost all of the basal-like/triple negative breast tumors were clustered together and clearly separated from other tumor and normal tissue samples. Importantly, it has been reported that lncRNA expression is strikingly tissue- and cell-type specific compared with PCGs in normal tissues (Cabili et al., 2011; Mercer et al., 2008; Ravasi et al., 2006). We decided to compare the tissue specificity among lncRNAs, PCGs, and pseudogenes in cancer. We used an entropy-based metric that relies on Jensen-Shannon (JS) divergence to calculate specificity scores (Cabili et al., 2011) for each gene in breast specimens, and found that the expression of lncRNA demonstrated the highest subtype specificity, followed by pseudogenes, while PCGs demonstrated the least subtype specificity (Figure 5D). About 18.27% of lncRNAs showed subtype specificity, while only 10.55% of PCGs were subtype-specific (Figure 5E). To rule out the possibility that the higher specificity of lncRNAs is a result of their lower abundance, we calculated the specificity scores of highly expressed transcripts from these three different types of genes. Again, lncRNA showed a higher tissue specificity than PCG and pseudogenes (Figure 5D).
Figure 5. The expression of lncRNAs is a specific biomarker in cancer.
A. Unsupervised hierarchical cluster analyses on the expression of the top 10% lncRNAs whose expression levels varied the most across all samples within each cancer type. B. Heatmap generated by unsupervised cluster analysis of lncRNAs with the largest expression variation in kidney cancer. C. Heatmap of unsupervised hierarchical cluster analysis using lncRNA signatures from breast cancer. D. Distribution of maximal subtype specificity scores calculated for each gene across the breast cancer specimens for all expressing transcripts (upper) or high expressers (lower) for lncRNA (blue), pseudogenes (red), and PCGs (black). E. Heatmap of lncRNA (left) and PCG (right) expression (JC scores) sorted on the basis of tissue-specific expression. Top: tissue-specific; bottom: ubiquitously expressed. F. Heatmap of unsupervised hierarchical cluster analysis using lncRNA signatures from the CCLE RNA-seq dataset. G. Distributions of maximal cancer-type specificity scores calculated for each gene across the CCLE major cancer types and across all expressing genes (upper) or high expressers (lower) for lncRNAs (blue), pseudogenes (red) and PCGs (black). See also Figure S4 and Tables S6.
We also sought to determine if the expression signatures of lncRNAs are also cancer-type specific using RNA-seq profiles from the Cancer Cell Line Encyclopedia (CCLE) in 935 human tumor cell lines (Table S6). As shown in Figure 5F, tumors of epithelia, melanoma, hematological, and neurological origins formed distinctive clusters based on lncRNA expression. Sarcoma tumors displayed a diffuse lncRNA expression pattern, which may be explained by the fact that this type of tumor arises from various tissues. Using the JS divergence calculation, we compared the tissue-specificity of lncRNAs, PCGs, and pseudogenes. Similar to our findings regarding subtype specificity in TCGA, the JS divergence measurements across cell lines of different origins revealed that lncRNA are more tissue-specific than PCGs and pseudogenes (Figure 5G). Finally, we compared cancer-type specificity across cell lines from 22 cancer types, and consistent results were observed (Figure S4B). These studies suggest that lncRNAs have the potential to serve as specific biomarkers with potential applications in cancer prediction, early-detection, and diagnosis. Notable, unknown primary origin tumors account for 3–5% of all new cancer cases and are aggressive diseases with poor prognosis. Our data indicate that lncRNAs may serve as informative biomarkers to determine the origin of these tumors.
lncRNome profiles provide a resource to functionally identify cancer driver lncRNAs
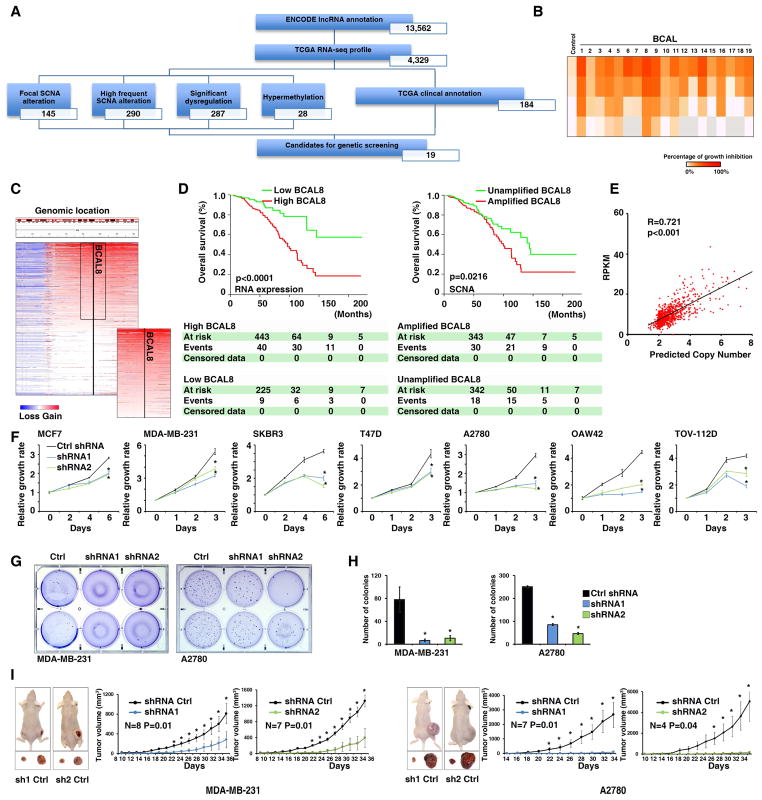
We hypothesized that, using the TCGA lncRNome information as a clinical filter, we were able to generate a concentrated and clinically relevant lncRNA list that could be used for a candidate-oriented functional screening. To test the concept, we chose breast cancer as an example, and evaluated a four-step procedure to identify for potential driver lncRNAs (Figure 6A). In summary, we identified 19 lncRNAs that have cancer-associated genomic alterations and are also correlated with patient survival (Table S7). In a proof-concept screening, we found that all four siRNAs specifically targeted ENSG00000253738 (Breast Cancer Associated lncRNA8, BCAL8) significantly reduced the proliferation of MDA-MB-231 cells (Figure 6B). BCAL8 is the neighbor transcript of OTUD6B (Xu et al., 2011), and they share overlapping promoter regions. Further analysis of SNP arrays revealed that the BCAL8 gene was amplified in 49.7% of breast cancer (Figure 6C). Importantly, both higher expression of BCAL8 RNA and genomic gain of the BCAL8 gene were significantly associated with decreased survival in breast cancer (Figure 6D). There was also a strong positive correlation between BCAL8 RNA expression and its genomic copy number in the breast tumors (Figure 6E). With the vast amount of data available in TCGA lncRNome, we had the resources to expand our characterization of BCAL8 from breast cancer to other cancer types. Interestingly, we found that higher expression of BCAL8 RNA was also significantly correlated with poor clinical outcome in OV, UCEC and LAML (Figure S5A). While the BCAL8 was significantly amplified in OV and UCEC, this was not the case for LAML (Figure S5B). To further validate the function of BCAL8, we suppressed BCAL8 expression by shRNA in breast and ovarian cancer cell lines. We consistently found that the expression of BCAL8-shRNAs significantly reduced growth rates in all cell lines tested (Figure 6F). Moreover, down-regulating BCAL8 expression also significantly reduced anchorage-independent growth in cells (Figure 6G and H). Finally, we injected cells expressing control and BCAL8-specific hairpins into nude mice and found that the expression of the BCAL8-shRNAs significantly suppressed tumor growth in vivo (Figure 6I). Together, this describes a strategy to integrate multidimensional molecular profiles with clinical annotations to generate clinical parameter-specific candidates for genetic screening.
Figure 6. An effective strategy to integrate multidisciplinary information from TCGA to identify cancer driver lncRNAs.
A. Flowchart describing the process of candidate gene selection in breast cancer. B. The summary of the proof-of-concept siRNA screening in MDA-MB-231 cells. C. Copy number profiles of BCAL8 locus from breast tumor specimens. D. Survival curves of breast cancer patients with high and low BCAL8 RNA expression (left) and differing genomic SCNA status (right). The numbers of patients who were alive (at risk), deceased (event), or censored during the course of surveillance are indicated in the table under the corresponding time points. E. The correlation between BCAL8 gene copy number and RNA expression in breast cancer. F. The growth curves of cells expressing control or BCAL8 shRNAs. G. Soft-agar assays (in 6-well plates) on cells expressing control or BCAL8 shRNAs. H. Quantification of the number of colonies from the softer agar assays. I. Xenograft tumor growth of cells expressing control or BCAL8 shRNAs. Error bars: SD. *: p<0.05. See also Figure S5 and Tables S7.
lncRNome profiles provide a resource to infer lncRNA functions
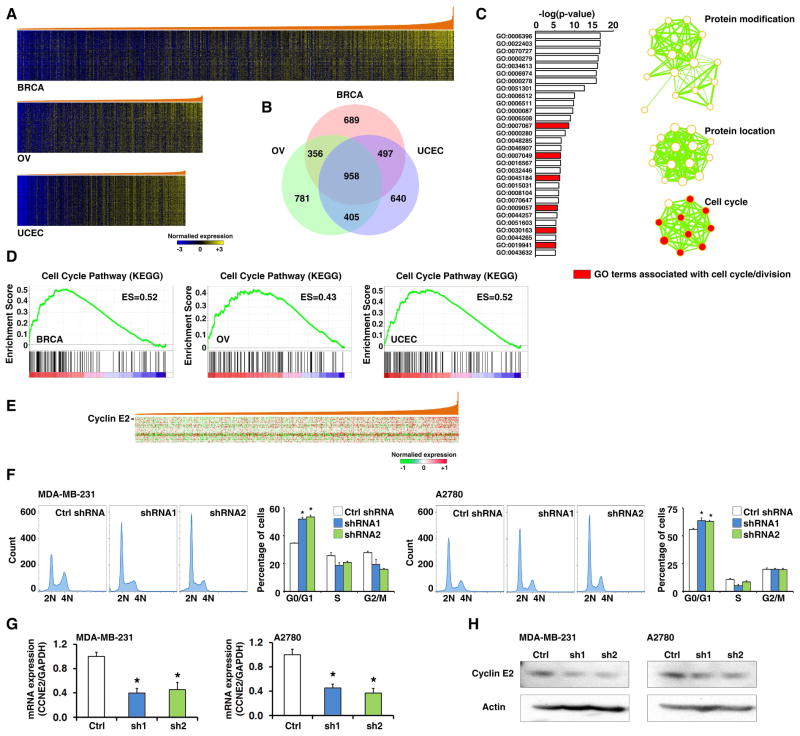
Predicting the biological functions of lncRNAs is challenging. Guilt-by-Association (GBA) analysis has been proposed that the function of a poorly characterized lncRNA gene can be inferred on the basis of known functions of PCGs with which it is co-expressed (Huarte et al., 2010). Since the TCGA provides multi-omic profiles in large-scale, it may serve as an excellent resource for GBA-based lncRNA function prediction. To test this concept, we conducted GBA analysis for BCAL8. The RNA-seq profiles were analyzed to identify PCGs whose expression was significantly correlated with BCAL8 expression in three cancer types (Figure 7A). We found that 38.2% (958/2,500) of BCAL8-associated PCGs were shared by all three cancer types (Figure 7B). Next, we performed gene ontology (GO) analysis on the BCAL8-associated PCGs that were common across the three cancer types, and found that the most over-represented pathway in BCAL8-associated genes was the cell cycle pathway (Figure 7C and D). We also performed a GBA analysis for BCAL8 using a protein expression profile (RPPA array) of breast cancer from TCGA, and identified 37 proteins (antibodies) whose expression levels were significantly and positively correlated with BCAL8 expression (Figure 7E and Table S8). Consistent with the above RNA-based GBA analyses, many BCAL8-associated proteins were key regulators in cell cycle pathways. For example, we found that BCAL8 expression was significantly and positively correlated with Cyclin E2 at both the mRNA and protein levels. We knocked down BCAL8 expression in cancer cell lines and analyzed cell cycle profiles. Consistent with our GBA prediction, knocking down BCAL8 dramatically inhibited the G1-S transition of the cell cycle (Figure 7F). Finally, supporting our GBA analysis, suppressing BCAL8 expression significantly reduced both CCNE2 mRNA and Cyclin E2 protein levels (Figure 7G and H). In summary, using BCAL8 as an example, we described an integrated bioinformatic approach to elucidate the function of given lncRNAs using information from the lncRNome dataset of TCGA (Figure S6).
Figure 7. Inferring the functions of BCAL8 by integrative bioinformatics analyses.
A. Heatmap of PCGs that were significantly and positively co-expressed with BCAL8. The genes were arranged from top to bottom in ascending order of their correlation with BCAL8. B. Venn diagrams of BCAL8-associated genes among breast, ovarian, and endometrial cancers. C. Pathways over-represented by BCAL8-associated PCGs in all three cancer types according to DAVID analysis based on gene ontology term. D. Enrichment of cell cycle pathway genes in cancer specimens with high levels of BCAL8. E. Heatmap of PCGs whose protein expression (RPPA) is significantly correlated with BCAL8 expression in breast cancer. The proteins are arranged from top to bottom in ascending order of their correlation with BCAL8 expression. F. Cell-cycle profiles of cells expressing control and BCAL8 shRNAs. G. qRT-PCR of CCNE2 mRNA expression in cells expressing control or BCAL8 shRNAs. H. Western blot of Cylin E2 in cells expressing control or BCAL8 shRNAs. Error bars: SD. *: p<0.05. See also Figure S6 and Tables S8.
DISCUSSION
Before the discovery of non-coding RNAs, the search for cancer drivers was focused on PCGs that resided in recurrent alterations in cancer genomes. However, many of these recurrent alterations were found to either be located in “gene desert” regions or they contained no cancer-linked PCGs. The lack of PCGs in cancer-associated genetic alterations is further supported by the fact that only 2% of the human genome encodes proteins. These findings, in combination with the recent revelation that about 70% of the human genome is transcribed into RNA, strongly suggest that non-coding RNAs play significant roles in tumor development. Our study represents the one of largest analyses so far of lncRNA dysregulation at transcriptional, genomic, and epigenetic levels across cancers, substantially expanding our knowledge of non-coding RNAs in the cancer genome (the data generated from this study are available at http://tcla.fcgportal.org). Given that the majority of the human genome is transcribed to RNA while only a small portion of these transcripts encode proteins, the number of lncRNA genes may be very large. An important challenge is that the genome-wide annotation and functional characterization of lncRNAs is still in its infancy. Further efforts will be needed to de novo annotate and characterize cancer unique lncRNA transcripts (Iyer et al., 2015; Trimarchi et al., 2014).
The expression of lncRNAs is strikingly cell type-specific in normal tissues (Cabili et al., 2011; Mercer et al., 2008; Ravasi et al., 2006). Our results indicate that the expression of lncRNA has the highest cancer type-specificity, followed by pseudogenes, and then PCGs, which were least subtype specific. The expression of lncRNAs is frequently dysregulated in cancer. There are sensitive, rapid, low-cost methods readily available for lncRNA quantification. Additionally, lncRNAs often form secondary structures that are relatively stable, thereby facilitating their detection as free RNAs in body fluids such as urine and blood. Therefore, lncRNAs may be an ideal class of biomarkers with potential applications in cancer prediction, early-detection, diagnosis and classification.
The TCGA project has profiled large numbers of tumors to identify molecular aberrations at multi-omic levels. Extracting valid information from TCGA can deepen our understanding of tumorigenesis and lead to the development of therapeutics. However, because cancer genomes are highly unstable, many cancer-associated alterations are not the causes but instead the consequence of tumorigenesis. The main challenge in developing effective therapies is to identify cancer-driver genes, which once targeted by therapeutic agents can suppress or eliminate tumor growth. Analyses of genome-wide molecular profiles using various bioinformatics approaches can reveal genomic alterations during cancer initiation and progression but cannot distinguish “causal” from “bystander” genetic alterations. Genome-wide functional screening approaches have been used with some success in identifying cancer driver genes; however, this approach can be time and labor intensive, and more importantly, susceptible to finding false positives and fraught with high numbers of false negatives. Here, we have developed a clinically guided genetic screening approach to identify functional lncRNAs in cancer. Using the cancer lncRNome resource generated in our study as biological/clinical filters, we were able to generate a relatively short list of lncRNA candidates for more extensive testing using candidate-oriented genetic screening. Predicting the biological functions of a given lncRNA is challenging. A “co-expression” approach has been used as one approach to begin to achieve an understanding of lncRNA function (Huarte et al., 2010). Since the level of lncRNA expression may directly represent its biological function in cancer, we proposed predicting lncRNA functions by co-expression analysis, i.e., by identifying the PCGs whose expression are significantly correlated with the expression of a given lncRNA. The TCGA project contains multi-omic profiles of large-scale samples, serving as an excellent resource for co-expression analysis. Taken together, the lncRNome database generated in the present study provides a resource to effectively identify cancer driver lncRNAs and predict their functions in cancer, which will lead to a greater understanding of molecular mechanisms of cancer, and should lead to clinical applications in oncology.
EXPERIMENTAL PROCEDURES
Annotation of lncRNAs, PCGs, and pseudogenes
The GENCODE lncRNA annotation (V18), a manually curated and evidence-based lncRNA annotation containing 13,562 genes and 23,105 transcripts, was used to define lncRNA genes. The GENCODE whole annotation (V18) was used to define PCGs and pseudogenes, resulting in a PCG set containing 20,318 genes and 81,673 transcripts; a pseudogene set containing 14,181 genes and 17,517 transcripts; and an “other genes” set containing 9,384 genes and 73,289 transcripts.
RNA-seq data processing
RNA-seq files were downloaded from the Cancer Genomics Hub (http://cghub.ucsc.edu). We imported the aligned reads of each BAM file to the Partek Genomic Suite (http://www.partek.com/) to obtain the expression levels for genes by summarizing the reads per kb per million mapped reads (RPKM) values. For each cancer type, we applied two filters to eliminate unreliability in the measurements of genes: 1) the 50th percentile of the RPKM values are larger than 0; and 2) the 90th percentile of the RPKM values are larger than 0.1. The genes that passed the above two filters were defined as detectable in a given cancer type. Please see Supplemental Experimental Procedures for a discussion of detailed procedures.
Xenograft model in vivo
Six to eight week old female nude mice were used for the xenograft assays. A2780 cells and MDA-MB-231 cells were trypsinized and harvested in PBS, then a total volume of 0.1 ml PBS containing A2780 cells (1×10⁶) or MDA-MB-231 cells (1.5×10⁶) were injected subcutaneously into the flanks of the animals. The animal study protocol was reviewed and approved by the Institutional Animal Care and Use Committee of the University of Pennsylvania. Please see Supplemental Experimental Procedures for a discussion of detailed procedures.
Statistical analysis
Statistical analysis was performed using SPSS and SAS software. All results were expressed as mean ± SD, and p<0.05 indicated significance. The survival curves were constructed according to the Kaplan-Meier method and compared with the log-rank test.
Supplementary Material
HIGHLIGHTS.
lncRNA dysregulation was characterized in 5,037 tumor samples across 13 cancer types.
lncRNAs are altered in cancers at transcriptional, genomic, and epigenetic levels.
The expression and dysregulation of lncRNAs are strikingly cancer-type specific.
This study provides a resource to systematically identify cancer driver lncRNAs.
SIGNIFICANCE.
The discovery of long non-coding RNA (lncRNA) has dramatically changed our understanding of the biology of diseases. Recent studies have identified lncRNAs with tumor suppressive and oncogenic activities. We conducted comprehensive analyses on lncRNA profiles at transcriptional, genomic, and epigenetic levels in 5,037 tumor specimens across 13 cancer types from the Cancer Genome Atlas and in 935 cancer cell lines from the Cancer Cell Line Encyclopedia. Our large-scale analyses revealed that lncRNA alterations are highly tumor- and lineage-specific and are often associated with somatic copy number alterations, promoter hypermethylation, and/or cancer-associated SNPs. Here we provide a rich resource to the research community for further investigating lncRNAs functions and identifying lncRNAs with diagnostic and therapeutic potentials.
Acknowledgments
We thank the TCGA and CCLE project teams. This work was supported, in whole or in part, by the Basser Center for BRCA (LZ), the Harry Fields Professorship (LZ); the NIH (R01CA142776 to LZ, R01CA190415 to LZ, P50CA174523 to LZ, P50CA083638 to JB and LZ, R01CA148759 to QH, P50CA083639 to GBM, P50CA098258 to GBM, U24CA143883 to GBM, P01CA099031 to GBM), the Ovarian Cancer Research Fund (XH), the Foundation for Women’s Cancer (XH), and the Breast Cancer Alliance (LZ and CVD). DZ and LY were supported by the China Scholarship Council. Functional Proteomics RPPA Core is supported by NIH CA016672.
Footnotes
Publisher's Disclaimer: This is a PDF file of an unedited manuscript that has been accepted for publication. As a service to our customers we are providing this early version of the manuscript. The manuscript will undergo copyediting, typesetting, and review of the resulting proof before it is published in its final citable form. Please note that during the production process errors may be discovered which could affect the content, and all legal disclaimers that apply to the journal pertain.
References
- Akrami R, Jacobsen A, Hoell J, Schultz N, Sander C, Larsson E. Comprehensive analysis of long non-coding RNAs in ovarian cancer reveals global patterns and targeted DNA amplification. PloS one. 2013;8:e80306. doi: 10.1371/journal.pone.0080306. [DOI] [PMC free article] [PubMed] [Google Scholar]
- Batista PJ, Chang HY. Long noncoding RNAs: cellular address codes in development and disease. Cell. 2013;152:1298–1307. doi: 10.1016/j.cell.2013.02.012. [DOI] [PMC free article] [PubMed] [Google Scholar]
- Cabili MN, Trapnell C, Goff L, Koziol M, Tazon-Vega B, Regev A, Rinn JL. Integrative annotation of human large intergenic noncoding RNAs reveals global properties and specific subclasses. Genes & development. 2011;25:1915–1927. doi: 10.1101/gad.17446611. [DOI] [PMC free article] [PubMed] [Google Scholar]
- Calin GA, Liu CG, Ferracin M, Hyslop T, Spizzo R, Sevignani C, Fabbri M, Cimmino A, Lee EJ, Wojcik SE, et al. Ultraconserved regions encoding ncRNAs are altered in human leukemias and carcinomas. Cancer cell. 2007;12:215–229. doi: 10.1016/j.ccr.2007.07.027. [DOI] [PubMed] [Google Scholar]
- Derrien T, Johnson R, Bussotti G, Tanzer A, Djebali S, Tilgner H, Guernec G, Martin D, Merkel A, Knowles DG, et al. The GENCODE v7 catalog of human long noncoding RNAs: analysis of their gene structure, evolution, and expression. Genome research. 2012;22:1775–1789. doi: 10.1101/gr.132159.111. [DOI] [PMC free article] [PubMed] [Google Scholar]
- Du Z, Fei T, Verhaak RG, Su Z, Zhang Y, Brown M, Chen Y, Liu XS. Integrative genomic analyses reveal clinically relevant long noncoding RNAs in human cancer. Nature structural & molecular biology. 2013;20:908–913. doi: 10.1038/nsmb.2591. [DOI] [PMC free article] [PubMed] [Google Scholar]
- Ezkurdia I, Juan D, Rodriguez JM, Frankish A, Diekhans M, Harrow J, Vazquez J, Valencia A, Tress ML. Multiple evidence strands suggest that there may be as few as 19,000 human protein-coding genes. Human molecular genetics. 2014;23:5866–5878. doi: 10.1093/hmg/ddu309. [DOI] [PMC free article] [PubMed] [Google Scholar]
- Guttman M, Amit I, Garber M, French C, Lin MF, Feldser D, Huarte M, Zuk O, Carey BW, Cassady JP, et al. Chromatin signature reveals over a thousand highly conserved large non-coding RNAs in mammals. Nature. 2009;458:223–227. doi: 10.1038/nature07672. [DOI] [PMC free article] [PubMed] [Google Scholar]
- Guttman M, Rinn JL. Modular regulatory principles of large non-coding RNAs. Nature. 2012;482:339–346. doi: 10.1038/nature10887. [DOI] [PMC free article] [PubMed] [Google Scholar]
- Huarte M, Guttman M, Feldser D, Garber M, Koziol MJ, Kenzelmann-Broz D, Khalil AM, Zuk O, Amit I, Rabani M, et al. A large intergenic noncoding RNA induced by p53 mediates global gene repression in the p53 response. Cell. 2010;142:409–419. doi: 10.1016/j.cell.2010.06.040. [DOI] [PMC free article] [PubMed] [Google Scholar]
- Iyer MK, Niknafs YS, Malik R, Singhal U, Sahu A, Hosono Y, Barrette TR, Prensner JR, Evans JR, Zhao S, et al. The landscape of long noncoding RNAs in the human transcriptome. Nature genetics. 2015;47:199–208. doi: 10.1038/ng.3192. [DOI] [PMC free article] [PubMed] [Google Scholar]
- Kapranov P, Cheng J, Dike S, Nix DA, Duttagupta R, Willingham AT, Stadler PF, Hertel J, Hackermuller J, Hofacker IL, et al. RNA maps reveal new RNA classes and a possible function for pervasive transcription. Science. 2007;316:1484–1488. doi: 10.1126/science.1138341. [DOI] [PubMed] [Google Scholar]
- Karreth FA, Pandolfi PP. ceRNA cross-talk in cancer: when ce-bling rivalries go awry. Cancer discovery. 2013;3:1113–1121. doi: 10.1158/2159-8290.CD-13-0202. [DOI] [PMC free article] [PubMed] [Google Scholar]
- Kim T, Cui R, Jeon YJ, Lee JH, Lee JH, Sim H, Park JK, Fadda P, Tili E, Nakanishi H, et al. Long-range interaction and correlation between MYC enhancer and oncogenic long noncoding RNA CARLo-5. Proceedings of the National Academy of Sciences of the United States of America. 2014;111:4173–4178. doi: 10.1073/pnas.1400350111. [DOI] [PMC free article] [PubMed] [Google Scholar]
- Lee JT. Epigenetic regulation by long noncoding RNAs. Science (New York, NY) 2012;338:1435–1439. doi: 10.1126/science.1231776. [DOI] [PubMed] [Google Scholar]
- Li J, Han L, Roebuck P, Diao L, Liu L, Yuan Y, Weinstein JN, Liang H. TANRIC: An interactive open platform to explore the function of lncRNAs in cancer. Cancer Res. 2015;75:1–10. doi: 10.1158/0008-5472.CAN-15-0273. [DOI] [PMC free article] [PubMed] [Google Scholar]
- Ling H, Spizzo R, Atlasi Y, Nicoloso M, Shimizu M, Redis RS, Nishida N, Gafa R, Song J, Guo Z, et al. CCAT2, a novel noncoding RNA mapping to 8q24, underlies metastatic progression and chromosomal instability in colon cancer. Genome research. 2013;23:1446–1461. doi: 10.1101/gr.152942.112. [DOI] [PMC free article] [PubMed] [Google Scholar]
- Mattick JS, Rinn JL. Discovery and annotation of long noncoding RNAs. Nature structural & molecular biology. 2015;22:5–7. doi: 10.1038/nsmb.2942. [DOI] [PubMed] [Google Scholar]
- Mercer TR, Dinger ME, Mattick JS. Long non-coding RNAs: insights into functions. Nature reviews Genetics. 2009;10:155–159. doi: 10.1038/nrg2521. [DOI] [PubMed] [Google Scholar]
- Mercer TR, Dinger ME, Sunkin SM, Mehler MF, Mattick JS. Specific expression of long noncoding RNAs in the mouse brain. Proceedings of the National Academy of Sciences of the United States of America. 2008;105:716–721. doi: 10.1073/pnas.0706729105. [DOI] [PMC free article] [PubMed] [Google Scholar]
- Mercer TR, Mattick JS. Structure and function of long noncoding RNAs in epigenetic regulation. Nature structural & molecular biology. 2013;20:300–307. doi: 10.1038/nsmb.2480. [DOI] [PubMed] [Google Scholar]
- Morris KV, Mattick JS. The rise of regulatory RNA. Nature reviews Genetics. 2014;15:423–437. doi: 10.1038/nrg3722. [DOI] [PMC free article] [PubMed] [Google Scholar]
- Orom UA, Shiekhattar R. Long noncoding RNAs usher in a new era in the biology of enhancers. Cell. 2013;154:1190–1193. doi: 10.1016/j.cell.2013.08.028. [DOI] [PMC free article] [PubMed] [Google Scholar]
- Prensner JR, Chinnaiyan AM. The emergence of lncRNAs in cancer biology. Cancer discovery. 2011;1:391–407. doi: 10.1158/2159-8290.CD-11-0209. [DOI] [PMC free article] [PubMed] [Google Scholar]
- Prensner JR, Iyer MK, Balbin OA, Dhanasekaran SM, Cao Q, Brenner JC, Laxman B, Asangani IA, Grasso CS, Kominsky HD, et al. Transcriptome sequencing across a prostate cancer cohort identifies PCAT-1, an unannotated lincRNA implicated in disease progression. Nature biotechnology. 2011;29:742–749. doi: 10.1038/nbt.1914. [DOI] [PMC free article] [PubMed] [Google Scholar]
- Ravasi T, Suzuki H, Pang KC, Katayama S, Furuno M, Okunishi R, Fukuda S, Ru K, Frith MC, Gongora MM, et al. Experimental validation of the regulated expression of large numbers of non-coding RNAs from the mouse genome. Genome research. 2006;16:11–19. doi: 10.1101/gr.4200206. [DOI] [PMC free article] [PubMed] [Google Scholar]
- Trimarchi T, Bilal E, Ntziachristos P, Fabbri G, Dalla-Favera R, Tsirigos A, Aifantis I. Genome-wide mapping and characterization of Notch-regulated long noncoding RNAs in acute leukemia. Cell. 2014;158:593–606. doi: 10.1016/j.cell.2014.05.049. [DOI] [PMC free article] [PubMed] [Google Scholar]
- Ulitsky I, Bartel DP. lincRNAs: genomics, evolution, and mechanisms. Cell. 2013;154:26–46. doi: 10.1016/j.cell.2013.06.020. [DOI] [PMC free article] [PubMed] [Google Scholar]
- Xing Z, Lin A, Li C, Liang K, Wang S, Liu Y, Park PK, Qin L, Wei Y, Hawke DH, et al. lncRNA directs cooperative epigenetic regulation downstream of chemokine signals. Cell. 2014;159:1110–1125. doi: 10.1016/j.cell.2014.10.013. [DOI] [PMC free article] [PubMed] [Google Scholar]
- Xu Z, Zheng Y, Zhu Y, Kong X, Hu L. Evidence for OTUD-6B participation in B lymphocytes cell cycle after cytokine stimulation. PloS one. 2011;6:e14514. doi: 10.1371/journal.pone.0014514. [DOI] [PMC free article] [PubMed] [Google Scholar]
Associated Data
This section collects any data citations, data availability statements, or supplementary materials included in this article.


