

Abstract
Oxamate (OXA) is a pyruvate analogue that directly inhibits the lactate dehydrogenase (LDH)-catalyzed conversion process of pyruvate into lactate. Earlier and recent studies have shown elevated blood lactate levels among insulin-resistant and type 2 diabetes subjects and that blood lactate levels independently predicted the development of incident diabetes. To explore the potential of OXA in the treatment of diabetes, db/db mice were treated with OXA in vivo. Treatment of OXA (350–750 mg/kg of body weight) for 12 weeks was shown to decrease body weight gain and blood glucose and HbA1c levels and improve insulin secretion, the morphology of pancreatic islets, and insulin sensitivity in db/db mice. Meanwhile, OXA reduced the lactate production of adipose tissue and skeletal muscle and serum lactate levels and decreased serum levels of TG, FFA, CRP, IL-6, and TNF-α in db/db mice. The PCR array showed that OXA downregulated the expression of Tnf, Il6, leptin, Cxcr3, Map2k1, and Ikbkb, and upregulated the expression of Irs2, Nfkbia, and Pde3b in the skeletal muscle of db/db mice. Interestingly, LDH-A expression increased in the islet cells of db/db mice, and both treatment of OXA and pioglitazone decreased LDH-A expression, which might be related to the improvement of insulin secretion. Taken together, increased lactate production of adipose tissue and skeletal muscle may be at least partially responsible for insulin resistance and diabetes in db/db mice. OXA improved glycemic control and insulin sensitivity in db/db mice primarily via inhibition of tissue lactate production. Oxamic acid derivatives may be a potential drug for the treatment of type 2 diabetes.
Introduction
Oxamate (OXA) is a pyruvate analogue that directly inhibits the conversion of pyruvate into lactate by lactate dehydrogenase (LDH) [1]. OXA has been used for the research of physiological and pathogenic role of LDH in vitro or in animals in vivo. For example, most cancer cells rely on aerobic glycolysis instead of oxidative phosphorylation to generate metabolic energy, a phenomenon called the Warburg effect [2]. Aerobic glycolysis is a hallmark of malignant tumor metabolism, which is associated with the progression of tumors [3, 4]. It has been found that OXA inhibits the activity of LDH and decreases lactate production in cancer cells [5, 6]. Oxamic acid derivatives are considered potential drugs for the treatment of malignant tumors [7].
Earlier work suggests that blood lactate is elevated among obese, insulin-resistant subjects, and that blood lactate may be an independent risk factor for the development of type 2 diabetes [8–11]. Elevated lactate may promote hepatic gluconeogenesis and interfere with glucose uptake in the muscle by serving as a substitute for glucose utilization [12]. Lactate infusion also decreases glucose oxidation [13]. In 2010, a large sample retrospective study by Crawford and colleagues showed that plasma lactate was strongly associated with type 2 diabetes [14]. In 2013, a prospective study by Juraschek and colleagues reported that blood lactate predicted incident diabetes independent of many other risk factors and was strongly related to markers of insulin resistance [15].
In recent years, some researchers put forward the concept of ‘disallowed beta-cell genes’ [16, 17]. Disallowed beta-cell genes are a group of genes whose expression is specifically inhibited in beta cells to avoid inappropriate release of insulin [16]. Recent work has identified over 60 genes that are specifically repressed in beta cells. LDH-A is one of the ‘founder’ members of this group of genes [16]. In vivo and in vitro studies have shown that high glucose levels upregulate the expression of LDH-A mRNA in rodent and human pancreatic islets [18–20]. Increased expression of LDH-A may impair insulin secretion in beta cells [21, 22].
Increased FFA load can cause multiple dysregulations, which are collectively known as lipotoxicity [23]. Lipotoxicity constitutes an important pathogenic link between obesity, insulin resistance, and type 2 diabetes [24]. On the other hand, type 2 diabetes and obesity are characterized by low-grade, chronic inflammation. [25]. Pro-inflammatory cytokines might predict the development of type 2 diabetes [26–28]; inflammation increases insulin resistance, which leads to type 2 diabetes [29]. It was observed that lactate boosted the gene transcription of pro-inflammatory cytokines in macrophages, and OXA inhibited lactate output and FFA synthesis in 3T3-L1 cells, and improved insulin resistance induced by palmitate in myotubes [30–32].
Although the above studies indicate that OXA may have anti-diabetic properties, the effects of OXA in vivo in diabetic animal models have not yet been investigated. In the present study, we investigated the effects of OXA treatment on the glycemic control, insulin resistance, and the associated mechanisms in vivo in db/db mice, to explore the possibility of oxamic acid derivatives being used as potential drugs for the treatment of type 2 diabetes.
Materials and Methods
Animals
The db/db (BKS.Cg-Dock7m+/+Leprdb/JNju) mice and db/+ ([Leprdb]mut/wt) mice were purchased from Model Animal Research Center of Nanjing University (Nanjing, China). This study was carried out in strict accordance with the recommendations in the guide for the care and use of animals of the Association for the Committee for Animal Experiments of National Center. The protocol was approved by the Ethics Committee of Sun Yat-sen University. The mice were housed individually with free access to food and water on a 12 hour light/dark cycle.
Study design
Thirty-five four-week-old male mice were randomly divided into 7 groups (numbered as groups I–VII) with five mice in each group. Group I were db/+ mice treated with normal saline (NS, 0.9% NaCl) by intraperitoneal injection (vehicle db/+ group), group II–VII were db/db mice administrated with NS (vehicle db/db group), 150, 350, 550, and 750 mg/kg of body weight of OXA (Sigma-Aldrich, St. Louis, MO, USA) by intraperitoneal injection, and 100 mg/kg of body weight of pioglitazone (PIO, Takeda Pharmaceutical, Osaka, Japan) by oral gavage, respectively, daily for 12 weeks. The condition (including activity, posture, pelage, and skin) of the mice was observed daily. Food intake (estimated by collecting and weighing uneaten food) was determined three times per week. Fasting blood glucose (FBG) levels and body weight after 8-h fasting were monitored weekly. After treatment of 12 weeks, an intraperitoneal glucose tolerance test (IPGTT) and an insulin tolerance test (ITT) were performed. Then, after 8-h fasting, the mice were anesthetized with pentobarbital sodium (50 mg/kg, Sigma-Aldrich, St. Louis, MO, USA), blood samples were taken by cardiac puncture, and serum was separated and stored at -20°C for detection of lactate, glycosylated hemoglobin (HbA1c), triglyceride (TG), free fatty acid (FFA), C-reactive protein (CRP), interleukin-6 (IL-6), and tumor necrosis factor-α (TNF-α). The mice were then immediately sacrificed by cervical dislocation and adipose, skeletal muscle, and pancreas tissues were rapidly dissected. Adipose tissue and skeletal muscle were frozen in liquid nitrogen and stored at -70°C for the detection of lactate production and analysis of the PCR array, and the pancreas was fixed in 10% (v/v) formalin for the detection of insulin expression. The dosage of OXA and PIO was adjusted weekly according to body weight to maintain a similar dose per kilogram over the entire experiment.
In addition, after 8-h fasting, three 4-week-old male db/+ mice were anesthetized with pentobarbital sodium (50 mg/kg), sacrificed by cervical dislocation, and the liver, adipose, skeletal muscle, and pancreas tissue were rapidly dissected and fixed in 10% (v/v) formalin. These samples and the pancreas sample from the above experimental mice were tested for LDH-A expression.
Health score
Six criteria including activity, posture, dehydration, pelage, and skin wounding were used to assess the health of the mice (Table 1). The health score was determined daily throughout the study and scoring was performed in a blinded manner by two independent observers. The overall health score ranged from 0–10, and a health score of 0 indicated healthy, while mice with scores from 8 to 10 were considered euthanized according to our IACUC protocol.
Table 1. Health Score Criteria.
| Criteria | Score | |
|---|---|---|
| Activity | Active | 0 |
| Moves slowly or moves only when stimulated | 1 | |
| Stationary | 2 | |
| Posture | Normal | 0 |
| Hunched and able to rear up | 1 | |
| Hunched and unable to rear up | 2 | |
| Dehydration | Skin does not tent when picked up | 0 |
| Skin tents but is able to return to the original shape | 1 | |
| Skin tents and stays up in a tent | 2 | |
| Pelage | Smooth | 0 |
| Partly ruffled | 1 | |
| All ruffled | 2 | |
| Skin wound | Absent | 0 |
| Present | 1 | |
| Present with purulent discharge | 2 | |
To evaluate the overall health condition, the activity, posture, pelage, and skin of the mice were observed and scoring was performed daily throughout the study. The overall health score ranged from 0–10, and a health score of 0 indicated healthy, while a score of 8 to 10 was considered euthanized.
Intraperitoneal glucose tolerance test (IPGTT)
The IPGTT was carried out after an overnight 10 h fast by intraperitoneal injection of 2 g/kg of body weight of glucose. Blood samples were collected from tail tip vein at 0, 30, 60, and 120 min after glucose injection for the immediate detection of glucose, then blood samples were separated and serum was stored at -20°C for the detection of insulin. For insulin secretion, the percentage of insulin versus the 0 min time point was calculated.
Insulin tolerance test (ITT)
An ITT was conducted after an overnight 10 h fast by intraperitoneal injection of 1 U/kg of body weight of insulin (Novolin R, Novo Nordisk, Copenhagen, Denmark). Blood samples were collected from the tail tip vein at 0, 15, 30, and 60 min after insulin injection for the detection of glucose. The percentage of blood glucose versus the 0 min time point was calculated.
Blood biochemical marker measurements
Blood glucose concentrations were determined using a glucometer (LifeScan Inc., CA, USA). Serum insulin (Millipore, MO, USA), HbA1c (BlueGene Biotech, Shanghai, China), TG (BlueGene Biotech, Shanghai, China), CRP (R&D Systems, MN, USA), IL-6 (Neobioscience, Shenzhen, China), and TNF-α (Neobioscience, Shenzhen, China) levels were measured by enzyme-linked immunosorbent assay (ELISA). Serum lactate (BioVision, CA, USA) and FFA (BioVision, CA, USA) levels were assayed by a colorimetric method.
Measurements of tissue lactate production
Adipose tissue and skeletal muscle samples were rapidly thawed, blotted dry, and weighed. A 0.1 g sample of adipose tissue and skeletal muscle were homogenized respectively in the buffer that contained 50 mmol/L of potassium phosphate, 1 mmol/L of EDTA, 1 mmol/L of DTT, and 0.05% TritonX-100 (pH 7.4). The homogenates were then centrifuged at 10,000 rpm for 15 min at 4°C, and the supernatants were collected for the detection of lactate production. The lactate (BioVision, CA, USA) production of adipose tissue and skeletal muscle were examined by a colorimetric method.
PCR array analysis
Total RNA from the skeletal muscle of vehicle db/db mice (n = 3) and OXA (750 mg/kg of body weight)-treated mice (n = 3) was extracted using the TRIzol reagent (Invitrogen, CA, USA). RNA yield and quality were assessed by UV absorbance and agarose gel electrophoresis. Then, RNA was reverse transcribed to cDNA. Real-Time PCR array (PAMM-1562, SuperArray Bioscience Corp., MD, USA) was performed to scan for the expression of 84 genes related to the mouse insulin signaling pathway, according to manufacturer’s instructions. In brief, diluted cDNA was individually placed into the wells of the PCR array. Then Real-Time PCR was performed, and the thermal cycling conditions were as follows: initial polymerase activation/denaturation at 95°C for 10 min, followed by 40 cycles at 95°C for 15 sec, and 60°C for 1 min. The PCR array data were normalized by the housekeeping gene (β-actin) and expressed as the mean fold change in OXA-treated samples relative to the vehicle-treated samples.
Immunohistochemical staining
Liver, adipose, skeletal muscle, and pancreas tissues were fixed in formalin, embedded in paraffin, and sectioned (4 μm). Paraffin sections were deparaffinized with xylene and hydrated with a series of graded ethanol washes. For insulin immunochemical analysis of the pancreas, the sections were incubated overnight at 4°C with insulin Rabbit Polyclonal Antibody (1:500, Santa Cruz Biotechnology, Inc., CA, USA). For LDH-A immunochemical analysis of liver, adipose, skeletal muscle, and pancreas tissue, the sections were incubated overnight at 4°C with LDH-A Rabbit Polyclonal Antibody (1:300, LifeSpan Biosciences, WA, USA). The sections were then washed, and incubated with anti-rabbit Plus-HRP (Dako Cytomation, Glostrup, Denmark) for 30 min at room temperature. The sections were then incubated with DAB and counterstained with hematoxylin.
Statistical analysis
The data are presented as the mean ± standard deviation, and were analyzed using SPSS 13.0 statistical software. The Student’s t-test was used to compare two independent variables, and one way analysis of variance (ANOVA) followed by the Student-Newman-Keuls test was used to compare more than 2 variables. A P value of less than 0.05 was considered statistically significant.
Results
Health condition and food intake
All of the mice were healthy (a health score of 0) throughout the study. Treatment with 150, 350, and 550 mg/kg of body weight of OXA or 100 mg/kg of body weight of PIO had no effect on food intake, while treatment with 750 mg/kg of body weight of OXA lightly decreased food intake in the db/db mice during the 12-week treatment (Fig 1).
Fig 1. Effects of OXA on food intake.

db/+ mice received the vehicle (0.9% NaCl), and db/db mice received the vehicle and OXA (150, 350, 550, and 750 mg/kg of body weight) or PIO (100 mg/kg of body weight) for 12 weeks. Food intake (estimated by collecting and weighing uneaten food) was determined three times per week during the experimental period. Results are expressed as the mean ± SD, n = 5. OXA: oxamate; PIO: pioglitazone. **: p < 0.01 as compared to the vehicle db/+ mice; #: p < 0.05 as compared to the vehicle db/db mice (one-way ANOVA followed by Student-Newman-Keuls test).
Effects of OXA on weight gain
Changes in the body weight of all the studied mice during the 12 week period are shown in Fig 2. Although 150 mg/kg of body weight of OXA had not effect on inhibiting weight gain, from 11 weeks of age, the body weight of the db/db mice receiving OXA at 350, 550, and 750 mg/kg of body weight began to decrease compared with that of the vehicle db/db mice, and decreased by 12.4, 19.8, and 25.7%, respectively, at the age of 16 weeks (after treatment for 12 weeks). In contrast, from 9 weeks of age (except at 12 weeks of age) the body weight of the PIO-treated db/db mice began to increase compared with that of the vehicle db/db mice, and increased by 14.5% at the age of 16 weeks.
Fig 2. Effects of OXA on body weight gain.
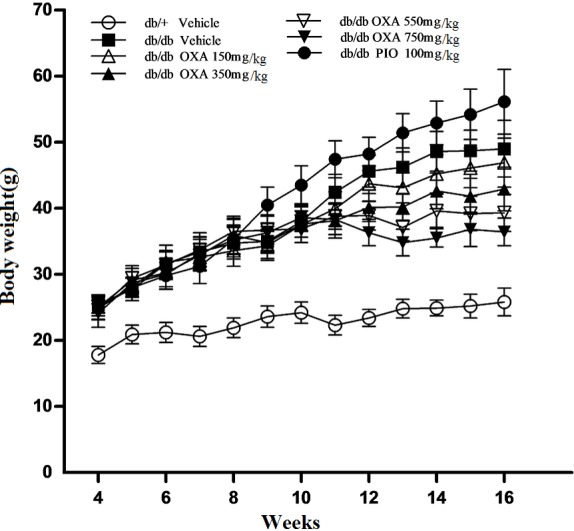
db/+ mice received the vehicle (0.9% NaCl), and db/db mice received the vehicle and OXA (150, 350, 550, 750 mg/kg of body weight) or PIO (100 mg/kg of body weight) respectively for 12 weeks. Body weight after 8-h fasting was monitored weekly during the experiment period. Results are expressed as the mean ± SD, n = 5. OXA: oxamate; PIO: pioglitazone.
Effects of OXA on glycemic control
We found that there were no significant differences in glycemic control between the vehicle db/db mice and the db/db mice treated with 150 mg/kg of body weight of OXA. However, from 11 and 9 weeks of age, FBG levels in the db/db mice receiving OXA at 350, 550, and 750 mg/kg of body weight were lower than that in the vehicle db/db mice, and at the age of 16 weeks (after treatment for 12 weeks), the FBG levels were decreased by 25.8, 39.7, and 56.9% respectively (Fig 3). With the increase in the dose of OXA from 350 to 750 mg/kg of body weight, glucose tolerance improved gradually and HbA1c levels became lower in the db/db mice at the age of 16 weeks (Figs 4 and 5).
Fig 3. Effects of OXA on fasting blood glucose.

db/+ mice received the vehicle (0.9% NaCl), and db/db mice received the vehicle and OXA (150, 350, 550, 750 mg/kg of body weight) or PIO (100 mg/kg of body weight) respectively for 12 weeks. Blood glucose after 8-h fasting was monitored weekly during the experiment period. Results are expressed as the mean ± SD, n = 5. OXA: oxamate; PIO: pioglitazone.
Fig 4. Effects of OXA on blood glucose levels during IPGTT.

db/+ mice received the vehicle (0.9% NaCl), and db/db mice received the vehicle and OXA (150, 350, 550, 750 mg/kg of body weight) or PIO (100 mg/kg of body weight) respectively for 12 weeks. After fasting for 10 h, the mice were subjected to a glucose tolerance test (GTT) by the intraperitoneal injection of 2 g/kg body weight of glucose. Blood was sampled and examined at 0 (baseline), 30, 60, and 120 min for glucose levels. Results are expressed as the mean ± SD, n = 5. OXA: oxamate; PIO: pioglitazone. *: p < 0.05 as compared to the vehicle db/+ mice; **: p < 0.01 as compared to the vehicle db/+ mice; ##: p < 0.01 as compared to the vehicle db/db mice (one-way ANOVA followed by Student-Newman-Keuls test).
Fig 5. Effects of OXA on serum HbA1c levels.

db/+ mice received the vehicle (0.9% NaCl), and db/db mice received the vehicle and OXA (150, 350, 550, 750 mg/kg of body weight) or PIO (100 mg/kg of body weight) respectively for 12 weeks. Then, an 8-h fasting blood sample was collected for the detection of HbA1c levels. Results are expressed as the mean ± SD, n = 5. OXA: oxamate; PIO: pioglitazone. **: p < 0.01 as compared to the vehicle db/+ mice; #: p < 0.05 as compared to the vehicle db/db mice; ##: p < 0.01 as compared to the vehicle db/db mice (one-way ANOVA followed by Student-Newman-Keuls test).
Effects of OXA on insulin sensitivity
To observe the effects of OXA on insulin sensitivity in db/db mice, an ITT was conducted, and fasting blood insulin levels were determined after 12 weeks of treatment. As shown in Fig 6, treatment with 350, 550, and 750, but not 150, mg/kg of body weight of OXA improved insulin sensitivity in response to an ITT in db/db mice. Compared with the vehicle db/db mice, serum insulin levels of db/db mice administrated with OXA of 350, 550, and 750 mg/kg of body weight were decreased. The effect of OXA seemed to be dose-dependent; however, the differences of serum insulin levels were not statistically significant between the db/db mice receiving OXA at 350, 550, and 750 mg/kg of body weight (Fig 7).
Fig 6. Effects of OXA on blood glucose levels during ITT.

db/+ mice received the vehicle (0.9% NaCl), and db/db mice received the vehicle and OXA (150, 350, 550, 750 mg/kg of body weight) or PIO (100 mg/kg of body weight) respectively for 12 weeks. After fasting for 10 h, the mice were subjected to an insulin tolerance test (ITT) by the intraperitoneal injection of 1 U/kg of body weight of insulin. Blood was sampled and examined at 0 (baseline), 15, 30, and 60 min for glucose. Results are expressed as the percentage (% versus 0 min glucose) ± SD, n = 5. OXA: oxamate; PIO: pioglitazone. **: p < 0.01 as compared to the vehicle db/+ mice; #: p < 0.05 as compared to the vehicle db/db mice; ##: p < 0.01 as compared to the vehicle db/db mice (one-way ANOVA followed by Student-Newman-Keuls test).
Fig 7. Effects of OXA on fasting serum insulin levels.

db/+ mice received the vehicle (0.9% NaCl), and db/db mice received the vehicle and OXA (150, 350, 550, 750 mg/kg of body weight) or PIO (100 mg/kg of body weight) respectively for 12 weeks. Then, an 8-h fasting blood sample was collected for the detection of insulin. Results are expressed as the mean ± SD, n = 5. OXA: oxamate; PIO: pioglitazone. **: p < 0.01 as compared to the vehicle db/+ mice; ##: p < 0.01 as compared to the vehicle db/db mice (one-way ANOVA followed by Student-Newman-Keuls test).
Effects of OXA on tissue lactate production and serum lactate levels
After 12 weeks of treatment, the lactate production of adipose tissue and skeletal muscle and serum lactate levels were more increased in the vehicle db/db mice than those in the vehicle db/+ mice. Treatment with 150 mg/kg of body weight of OXA decreased the lactate production of adipose tissue, but had no effect on the lactate production of skeletal muscle and serum lactate levels in db/db mice. However, administration of OXA at 350, 550, and 750 mg/kg of body weight decreased the lactate production of adipose tissue and skeletal muscle and serum lactate levels in db/db mice in a dose-dependent manner. Treatment with pioglitazone had not effect on the lactate production of adipose tissue and skeletal muscle and serum lactate levels in db/db mice (Fig 8A–8C).
Fig 8. Effects of OXA on tissue lactate production and serum lactate levels.

db/+ mice received the vehicle (0.9% NaCl), and db/db mice received the vehicle and OXA (150, 350, 550, 750 mg/kg of body weight) or PIO (100 mg/kg of body weight) respectively for 12 weeks. Then an 8-h fasting blood sample was collected for the detection of lactate, and skeletal muscle and adipose tissue were dissected for the detection of lactate production. (A) Lactate production of adipose tissue; (B) lactate production of skeletal muscle; (C) serum lactate levels. Results are expressed as the mean ± SD, n = 5. OXA: oxamate; PIO: pioglitazone. *: p < 0.05 as compared to the vehicle db/+ mice; **: p < 0.01 as compared to the vehicle db/+ mice; #: p < 0.05 as compared to the vehicle db/db mice; ##: p < 0.01 as compared to the vehicle db/db mice (one-way ANOVA followed by Student-Newman-Keuls test).
Effects of OXA on serum levels of lipid and pro-inflammatory cytokines
As shown in Fig 9, treatment with 350 and 750 mg/kg of body weight of OXA for 12 weeks decreased serum TG and FFA levels in db/db mice. The 750 mg/kg of body weight dose of OXA had more obvious effects on serum FFA (but not TG) levels than those of the 350 mg/kg of body weight dose of OXA (Fig 9A and 9B). Likewise, treatment with 350 and 750 mg/kg of body weight of OXA decreased serum CRP, IL-6, and TNF-α levels in db/db mice, and the 750 mg/kg of body weight dose of OXA had more obvious effects on serum IL-6 and TNF-α (but not CRP) levels than those of the 350 mg/kg of body weight dose of OXA in db/db mice (Fig 9C–9E).
Fig 9. Effects of OXA on serum levels of lipid and pro-inflammatory cytokines.

db/+ mice received the vehicle (0.9% NaCl), and db/db mice received the vehicle and OXA (350 and 750 mg/kg of body weight) or PIO (100 mg/kg of body weight) respectively for 12 weeks. Then an 8-h fasting blood sample was collected for the detection of lipid and pro-inflammatory cytokines. (A) serum TG; (B) serum FFA; (C) serum CRP; (D) serum IL-6; (E) serum TNF-α. Results are expressed as the mean ± SD, n = 5. OXA: oxamate; PIO: pioglitazone. *: p < 0.05 as compared to the vehicle db/+ mice; **: p < 0.01 as compared to the vehicle db/+ mice; #: p < 0.05 as compared to the vehicle db/db mice; ##: p < 0.01 as compared to the vehicle db/db mice (one-way ANOVA followed by Student-Newman-Keuls test).
Effects of OXA on genes related to the insulin-signaling pathway in skeletal muscle
To compare the expression of genes related to the insulin response in OXA (750 mg/kg of body weight)-treated and vehicle-treated db/db mice, we used a PCR array for skeletal muscle. According to the criteria of at least a 2.0-fold-change in the experiment sets with statistically significant differences (p < 0.05), we found that the mRNA levels of acyl-CoA synthetase long-chain family member 4 (Acsl4), cellular nucleic acid binding protein (Cnbp), chemokine (C-X-C motif) receptor 4 (Cxcr4), EGF-like module containing, mucin-like, hormone receptor-like sequence 1 (Emr1), interleukin 6 (Il6), leptin (Lep), inhibitor of kappaB kinase beta (Ikbkb), nicotinamide phosphoribosyltransferase (Nampt), mitogen-activated protein kinase kinase 1 (Map2k1), Mitogen-activated protein kinase 3 (Mapk3), and tumor necrosis factor (Tnf) were decreased, while insulin receptor substrate 2 (Irs2), nuclear factor of kappa light polypeptide gene enhancer in B-cells inhibitor, alpha (Nfkbia) and Phosphodiesterase 3B, cGMP-inhibited (Pde3b) were increased in OXA-treated db/db mice (Fig 10).
Fig 10. Effects of OXA on genes related to the insulin signaling pathway in skeletal muscle.

db/db mice received the vehicle and OXA (750 mg/kg of body weight) for 12 weeks. Then, skeletal muscle was dissected.and the expressions of genes related to the insulin signaling pathway were measured by PCR array. Fold changes of the skeletal muscle genes in OXA-treated db/db mice compared with vehicle-treated db/db mice. *p < 0.05 and **p < 0.01 as compared to the vehicle-treated db/db mice (unpaired, two-tail Student’s t-test); (n = 3 for each group, the mRNA levels of all genes were normalized by β-actin). Abbreviated names for the genes are presented in red. Numbers (in black) represent fold-changes. A (in blue): This gene's average threshold cycle was > 30 in the control or the test sample, and was reasonably < 30 in the other sample. B (in blue): This gene's average threshold cycle was > 30, which means that the level of gene expression was relatively low in both samples, and the P-value for the fold-change was unavailable or high (P > 0.05). C (in blue): This gene's average threshold cycle was not determined or was > 35 (cut-off value) in both samples, indicating that gene expression was undetected, and the result was erroneous and non-interpretable. “OKAY” means that this gene's average threshold cycle was < 30 in both samples, and the result was accepted.
Effects of OXA on insulin secretion, islet morphology, and insulin expression
In the vehicle db/+ mice and PIO-treated db/db mice after 12 weeks of treatment, peak serum insulin levels occurred at 30 min during IPGTT, but no peak plasma insulin levels were observed in the vehicle db/db mice. Peak serum insulin levels appeared at 60 min in the db/db mice receiving OXA at 350 mg/kg of body weight, and at 30 min in the db/db mice receiving OXA at 750 mg/kg of body weight (Fig 11).
Fig 11. Effects of OXA on insulin secretion during IPGTT.

db/+ mice received the vehicle (0.9% NaCl), and db/db mice received the vehicle and OXA (350 and 750 mg/kg of body weight) or PIO (100 mg/kg of body weight) respectively for 12 weeks. After fasting for 10 h, the mice were subjected to a glucose tolerance test (GTT) by the intraperitoneal injection of 2 g/kg of body weight of glucose. Blood was sampled and examined at 0 (baseline), 30, 60, and 120 min for insulin. Results are expressed as the percentage (% versus 0 min insulin) ± SD, n = 5. OXA: oxamate; PIO: pioglitazone. *: p < 0.05 as compared to the vehicle db/+ mice; **: p < 0.01 as compared to the vehicle db/+ mice; ##: p < 0.01 as compared to the vehicle db/db mice (one-way ANOVA followed by Student-Newman-Keuls test).
After 12 weeks of treatment, the pancreatic islets of vehicle db/+ mice and PIO-treated db/db mice maintained normal morphologies, and insulin staining was dark brown (Fig 12A and 12E). In contrast, some of the islets of the vehicle db/db mice became larger and irregular, some of the islets lost boundary definition, the arrangement of the cells in the islet became loose, and insulin staining was shallow (Fig 12B). Compared with the vehicle db/db mice, the morphology of the islet became regular, cells in the islet were relatively orderly arranged, and insulin staining was darker in the db/db mice receiving OXA at 350 and 750 mg/kg of body weight. Furthermore, the size of the islets became smaller and the insulin staining of cells became darker in the db/db mice receiving OXA at 750 mg/kg than those receiving 350 mg/kg of body weight (Fig 12C and 12D).
Fig 12. Effects of OXA on islet morphology and insulin expression.

db/+ mice received the vehicle (0.9% NaCl), and db/db mice received the vehicle and OXA (350 and 750 mg/kg of body weight) or PIO (100 mg/kg of body weight) respectively for 12 weeks. Then, the pancreas was dissected and insulin staining was performed (×200). (A) pancreas from vehicle db/+ mice; (B) pancreas from vehicle db/db mice; (C) pancreas from db/db mice treated with OXA of 350 mg/kg of body weight; (D) pancreas from db/db mice treated with OXA of 750 mg/kg of body weight; (E) pancreas from db/db mice treated with PIO of 100 mg/kg of body weight. OXA: oxamate; PIO: pioglitazone.
Effects of OXA on LDH-A expression in islets
To observe LDH-A expression in the tissue of normal mice, and to investigate the effects of OXA on LDH-A expression in the islets of db/db mice, liver, adipose, skeletal muscle, and pancreas tissue from 4-week-old db/+ mice and pancreas tissue from 16-week-old (treated for 12 weeks) treated db/+ and db/db mice were dissected and were stained with LDH-A. In the 4-week-old db/+ mice, almost all of the cells in the liver (Fig 13A), adipose (Fig 13B), skeletal muscle (Fig 13C), and pancreatic exocrine tissue were stained positively for LDH-A, however, the cells in the islets were hardly stained for LDH-A (Fig 13D). Likewise, almost all of the cells in pancreatic exocrine tissue were stained positively for LDH-A in the 16-week-old vehicle db/+ mice and all treated db/db mice (Fig 13E–13I). LDH-A positive cells in islets were found predominantly in the vehicle db/db mice, while only a few cells in islets were lightly stained for LDH-A in the vehicle db/+ mice, the db/db mice receiving OXA at 350 and 750 mg/kg of body weight, and PIO at 16 weeks of age (Fig 13E–13I).
Fig 13. Effects of OXA on LDH-A expression in islets.

Liver, adipose, skeletal muscle, and pancreas tissue from 4-week-old db/+ mice, and pancreas tissue from the mice after a treatment (vehicle, OXA, and PIO) of 12 weeks were dissected and LDH-A staining was performed (×200). (A) Liver from 4-week-old db/+ mice; (B) adipose tissue from 4-week-old db/+ mice; (C) skeletal muscle from 4-week-old db/+ mice; (D) pancreas from 4-week-old db/+ mice; (E) pancreas from vehicle db/+ mice; (F) pancreas from vehicle db/db mice; (G) pancreas from db/db mice treated with OXA of 350 mg/kg of body weight; (H) pancreas from db/db mice treated with OXA of 750 mg/kg of body weight; (I) pancreas from db/db mice treated with PIO of 100 mg/kg of body weight. OXA: oxamate; PIO: pioglitazone.
Discussion
In the present study, we evaluated the effects of OXA on glycemic control and insulin sensitivity in db/db mice. Our results show that a treatment of OXA (350–750 mg/kg body weight) for 12 weeks significantly decreased the fasting and post-load blood glucose and HbA1c levels in the db/db mice. At the same time, OXA also improved insulin secretion and the morphology of pancreatic islets in the db/db mice. Meanwhile, OXA-treated mice were significantly more responsive to insulin and the blood insulin level was significantly decreased, indicating that the treatment of OXA ameliorated insulin resistance in db/db mice. These effects of OXA in the db/db mice were similar to that of pioglitazone; the difference was that treatment of OXA decreased the body weight, whereas pioglitazone significantly increased the body weight gain of the db/db mice.
OXA is a pyruvate-competitive inhibitor of LDH, which catalyzes the conversion process of pyruvate into lactate. In the fasted, resting state, lactate is produced by skeletal muscle, adipose tissue, the brain, erythrocytes, the liver, the gut, the kidneys, and skin, and both skeletal muscle and adipose tissue account for the majority of the lactate released [14]. Elevated blood lactate is a marker for cellular stress [30]. On the other hand, it was also demonstrated that lactate induced insulin resistance, and lactate treatment inhibited insulin action by inhibiting the insulin receptor substrate-1 (IRS-1) and IRS-2 mediated PI3K and PKB pathways [33, 34]. In animal models of type 2 diabetes, increased blood lactate levels and the production of lactate in adipose tissue and skeletal muscle had been observed [33, 35–37]. Earlier and recent studies, including retrospective and prospective studies, have suggested that blood lactate was strongly associated with insulin resistance and type 2 diabetes and was an independent risk factor of diabetes development [8–11, 14, 15]. In our study, the production of lactate was increased in adipose tissue and skeletal muscle, and serum lactate levels were elevated in vehicle db/db mice compared with vehicle db/+ mice at 16 weeks of age. After the treatment of OXA for 12 weeks, the production of lactate in adipose tissue and skeletal muscle and serum lactate levels were decreased, accompanied by improvement of insulin resistance and glycemic control in db/db mice. Meanwhile, a PCR array of skeletal muscle showed that OXA upregulated (Irs2, Nfkbia, and Pde3b) or downregulated (Map2k1, Mapk3, Ikbkb, etc.) the expression of genes related to the insulin-signaling pathway. However, the treatment of pioglitazone had no effects on the production of lactate in adipose tissue and skeletal muscle and serum lactate levels, although it significantly improved insulin resistance and glycemic control. These results indicate that the increased lactate production of adipose tissue and skeletal muscle may be at least partially responsible for insulin resistance and diabetes in db/db mice, and the anti-diabetic roles of OXA were primarily mediated by the inhibition of the lactate production of adipose tissue and skeletal muscle, and thus the improvement of insulin sensitivity.
In the beta cell, a small group of genes, which are almost ubiquitously expressed in mammalian tissues, are specifically repressed, in order to prevent inappropriate release of insulin. Abnormal upregulation of these genes might lead to the deterioration of beta-cell function. This group of genes is recently referred to as ‘disallowed beta-cell genes’ [16, 17]. LDH-A is one of the 'founder' members of this group [16]. In vivo and in vitro studies have shown that high glucose levels upregulate the expression of LDH-A mRNA in rodent and human pancreatic islets [18–20]. In the present study, we observed that LDH-A was highly expressed in the liver, adipose tissue, skeletal muscle, and pancreatic exocrine tissue, but was hardly expressed in islets from 4-week-old db/+ mice. However, LDH-A was prominently expressed higher in islets from the vehicle db/db mice than those from the vehicle db/+ mice at 16 weeks of age. Our results, for the first time at the protein level, strongly support the concept of ‘disallowed beta-cell genes’. Interestingly, both the treatment of OXA and pioglitazone for 12 weeks significantly downregulated the expression of LDH-A in islets from db/db mice. These results indicate an improvement in insulin resistance and glycemic control, lowered LDH-A expression in islets (probably due to restructuring of the morphology of the pancreatic islets and an increased supply of blood and oxygen). Decreased LDH-A expression in islets might be related to an improvement of insulin secretion in db/db mice. Since LDH-A expression was prominently decreased in the islets of db/db mice with the treatment of OXA, the direct effects of OXA on the inhibition of the LDH activity of beta cells to improve insulin secretion might be inconspicuous.
Lipotoxicity constitutes an important pathogenic link between obesity, insulin resistance, and type 2 diabetes [24]. Elevated FFA impairs glucose oxidation/glycogen synthesis and decreases glucose transport/phosphorylation via activation of the NF-κB, and inhibition of the IRS-1, signaling pathways [25, 38]. On the other hand, some evidence has suggested a state of chronic low-grade inflammation is involved in the development of insulin resistance and the pathogenesis of type 2 diabetes [39]. It has been demonstrated that pro-inflammatory cytokines like TNF-α and IL-6 are able to interfere with the insulin-signaling pathway and decrease insulin action [40–42]. In the adipose tissue of obese or diabetic rats or humans, up to 50–70% of the glucose taken up is converted to lactate [35]. Thus, the adipose tissue macrophages in patients with obesity or diabetes are likely to be exposed to a high level of lactate [30]. It was observed that lactate boosted the gene transcription of pro-inflammatory cytokines in macrophages, and OXA inhibited lactate output, FFA de novo synthesis, and TG accumulation in 3T3-L1 cells [30, 31]. A recent study also showed that palmitate caused a striking loss of PKB phosphorylation in response to insulin and markedly stimulated NF-κB-mediated pro-inflammatory signaling in myotubes, and both of these effects were antagonized by OXA [32]. In the present study, a treatment of OXA for 12 weeks decreased the serum levels of TG, FFA, CRP, IL-6, and TNF-α in db/db mice. OXA also downregulated the expression of inflammation-related genes, such as Tnf, Il6, Emr1, and Cxcr4, which might be mediated by the inhibition of the MAPK/NF-κB pathway (based on the downregulation of Map2k1, Mapk3, and Ikbkb and the upregulation of Nfkbia) in the skeletal muscle of db/db mice. These results indicated that the improvement of insulin resistance by OXA might involve the reduction of lipotoxicity and inflammation in db/db mice.
We also found that treatment with OXA (350–750 mg/kg body weight) decreased body weight gain in db/db mice. However, the mechanism was unclear. Decreased food intake might not be a major contributor, since only the high dose of OXA (750 mg/kg body weight) lightly decreased food intake in db/db mice. An in vitro study of 3T3-L1 cells showed that OXA inhibited FFA synthesis and TG accumulation [31], but the effects of OXA on fat accumulation in vivo in db/db mice need to be further studied.
Although OXA treatment improved insulin resistance and glycemic control, it failed to prevent the development of diabetes in db/db mice. The db/db mice were treated with OXA at the age of 4 weeks, when blood glucose levels were normal. However, all the db/db mice became diabetic (FBG ≥ 13.9 mmol/L) at the age of 6 weeks. OXA began to take effect on glycemic control after 5–7 weeks of treatment. One possible explanation for this phenomenon was that elevated blood glucose, together with FFA, significantly increased lactate production in the tissues of db/db mice at about the age of 10 weeks, which in return exacerbated insulin resistance and hyperglycemia. However, at this time point, OXA began to exert effects on glycemic control.
It is worth pointing out that in addition to the inhibition of LDH, OXA also inhibits pyruvate carboxylase (PC) and aspartate aminotransferase (AAT) [43, 44], which might have some effects on the glucose metabolism of cells of the liver, adipose tissue, and skeletal muscle. PC is a member of the biotin-dependent enzyme family and catalyzes the ATP-dependent carboxylation of pyruvate to oxaloacetate [45]. In mammals, PC plays a crucial role in gluconeogenesis and lipogenesis [45]. Increased expression of PC has been reported in obese Zucker Diabetic Fatty (ZDF) rats, and targeting the inhibition of PC expression in liver and adipose tissue reduces gluconeogenesis and adiposity and improves insulin resistance [46]. Earlier in vitro studies suggest that OXA inhibits hepatic gluconeogenesis via non-competitive inhibition of PC and the competitive inhibition of the mitochondrial pyruvate translocator protein [43, 47, 48]. AAT is an ubiquitous pyridoxal phosphate-dependent enzyme, and functions together with malate dehydrogenase to form the NADH shuttle system, which plays an essential role in the coupling of glycolytic metabolism and mitochondrial generation of energy [44]. Accordingly, the inhibition of OXA on AAT might have deleterious effects on the glucose metabolism of cells of the liver, skeletal muscle, and adipose tissue. Therefore, the effects of the inhibition of PC and AAT by OXA in vivo on insulin resistance and glycemic control in db/db mice should be further investigated.
Aerobic glycolysis is a hallmark of malignant tumor metabolism, and OXA can inhibit the activity of LDH and decrease lactate production in cancer cells [2, 3]. It has been reported that OXA has anti-cancer properties in vitro and in animals in vivo [1, 5, 6, 49, 50]. However, OXA is a competitive inhibitor of LDH at high concentrations, which limits its therapeutic potential in clinical practice [49]. Oxamic acid derivatives are developing, which are being considered as a potential drug for the treatment of malignant tumors in the future [7, 51]. In the present study, we demonstrated that OXA improved glycemic control and insulin sensitivity in db/db mice. Therefore, we consider that Oxamic acid derivatives may also be a potential drug for the treatment of type 2 diabetes.
In summary, our results show that increased lactate production of adipose tissue and skeletal muscle may be at least partially responsible for insulin resistance and diabetes in db/db mice. Treatment with OXA (350–750 mg/kg of body weight) improved glycemic control and insulin sensitivity in db/db mice primarily via the inhibition of tissue lactate production, and the reduction of lipotoxicity and inflammation. Oxamic acid derivatives may be a potential drug for the treatment of type 2 diabetes.
Data Availability
All relevant data are within the paper
Funding Statement
The authors have no support or funding to report.
References
- 1.Zhou M, Zhao Y, Ding Y, Liu H, Liu Z, Fodstad O, et al. Warburg effect in chemosensitivity: targeting lactate dehydrogenase-A re-sensitizes taxol-resistant cancer cells to taxol. Mol Cancer. 2010;9:33 10.1186/1476-4598-9-33 [DOI] [PMC free article] [PubMed] [Google Scholar]
- 2.Demetrius LA, Coy JF, Tuszynski JA. Cancer proliferation and therapy: the Warburg effect and quantum metabolism. Theor Biol Med Model. 2010;19,7:2 10.1186/1742-4682-7-2 [DOI] [PMC free article] [PubMed] [Google Scholar]
- 3.Hsu PP, Sabatini DM. Cancer cell metabolism: Warburg and beyond. Cell. 2008;134(5):703–7. 10.1016/j.cell.2008.08.021 [DOI] [PubMed] [Google Scholar]
- 4.Kim JW, Dang CV. Cancer's molecular sweet tooth and the Warburg effect. Cancer Res. 2006;15,66(18):8927–30. 10.1158/0008-5472.CAN-06-1501 [DOI] [PubMed] [Google Scholar]
- 5.Ramanathan A, Wang C, Schreiber SL. Perturbational profiling of a cell-line model of tumorigenesis by using metabolic measurements. Proc Natl Acad Sci U S A. 2005;102:5992–7. 10.1073/pnas.0502267102 [DOI] [PMC free article] [PubMed] [Google Scholar]
- 6.Zhao Y, Liu H, Liu Z, Ding Y, Ledoux SP, Wilson GL, et al. Overcoming trastuzumab resistance in breast cancer by targeting dysregulated glucose metabolism. Cancer Res. 2011;71(13):4585–97. 10.1158/0008-5472.CAN-11-0127 [DOI] [PMC free article] [PubMed] [Google Scholar]
- 7.Granchi C, Bertini S, Macchia M, Minutolo F. Inhibitors of lactate dehydrogenase isoforms and their therapeutic potentials. Curr Med Chem. 2010; 17(7):672–97. 10.2174/092986710790416263 [DOI] [PubMed] [Google Scholar]
- 8.Chen YD, Varasteh BB, Reaven GM. Plasma lactate con-centration in obesity and type 2 diabetes. Diabetes Metab. 1993;19:348–54. [PubMed] [Google Scholar]
- 9.Lovejoy J, Newby FD, Gebhart SS, DiGirolamo M. Insulin resistance in obesity is associated with elevated basal lactate levels and diminished lactate appearance following intravenous glucose and insulin. Metabolism. 1992;41:22–7. [DOI] [PubMed] [Google Scholar]
- 10.Reaven GM, Hollenbeck C, Jeng CY, Wu MS, Chen YD. Measurement of plasma glucose, free fatty acid, lactate,and insulin for 24 h in patients with NIDDM. Diabetes. 1988;37:1020–24. [DOI] [PubMed] [Google Scholar]
- 11.Ohlson LO, Larsson B, Björntorp P, Eriksson H, Svärdsudd K, Welin L, et al. Risk factors for type 2 (non-insulin-dependent) diabetes mellitus. Thirteen and one-half years of follow-up of the participants in a study of Swedish men born in 1913. Diabetologia. 1988;31(11):798–805. [DOI] [PubMed] [Google Scholar]
- 12.Consoli A, Nurjhan N, Reilly JJ Jr, Bier DM, Gerich JE. Mechanism of increased gluconeogenesis in noninsulin-dependent diabetes mellitus. Role of alterations in systemic, hepatic, and muscle lactate and alanine metabolism. J Clin Invest 1990; 86:2038–45. [DOI] [PMC free article] [PubMed] [Google Scholar]
- 13.Miller BF, Fattor JA, Jacobs KA, Horning MA, Suh SH, Navazio F, et al. Metabolic and cardiorespiratory responses to “the lactate clamp”. Am J Physiol Endocrinol Metab. 2002; 283:E889–98. [DOI] [PubMed] [Google Scholar]
- 14.Crawford SO, Hoogeveen HC, Brancati FL, Astor BC, Ballantyne CM, Schmidt MI, et al. Association of blood lactate with type 2 diabetes: the Atherosclerosis Risk in Communities Carotid MRI Study. Int J Epidemiol. 2010;39:1647–55. 10.1093/ije/dyq126 [DOI] [PMC free article] [PubMed] [Google Scholar]
- 15.Juraschek SP, Shantha GP, Chu AY, Miller ER 3rd, Guallar E, Hoogeveen RC, et al. Lactate and risk of incident diabetes in a case-cohort of the atherosclerosis risk in communities (ARIC) study. PLoS One. 2013;8(1):e55113 10.1371/journal.pone.0055113 [DOI] [PMC free article] [PubMed] [Google Scholar]
- 16.Pullen TJ, Rutter GA. When less is more: the forbidden fruits of gene repression in the adult β-cell. Diabetes Obes Metab. 2013;15(6):503–12. 10.1111/dom.12029 [DOI] [PubMed] [Google Scholar]
- 17.Schuit F, Van Lommel L, Granvik M, Goyvaerts L, de Faudeur G, Schraenen A, et al. Beta-Cell- specific gene repression: a mechanism to protect against inappropriate or maladjusted insulin secretion? Diabetes. 2012;61(5):969–75. 10.2337/db11-1564 [DOI] [PMC free article] [PubMed] [Google Scholar]
- 18.Laybutt DR, Sharma A, Sgroi DC, Gaudet J, Bonner-Weir S, Weir GC. Genetic regulation of metabolic pathways in beta-cells disrupted by hyperglycemia. J Biol Chem. 2002;277(13):10912–21. 10.1074/jbc.M111751200 [DOI] [PubMed] [Google Scholar]
- 19.Bensellam M, Van Lommel L, Overbergh L, Schuit FC, Jonas JC. Cluster analysis of rat pancreatic islet gene mRNA levels after culture in low-, intermediate- and high- glucose concentrations. Diabetologia. 2009;52(3):463–76. 10.1007/s00125-008-1245-z [DOI] [PubMed] [Google Scholar]
- 20.Marselli L, Thorne J, Dahiya S, Sgroi DC, Sharma A, Bonner-Weir S, et al. Gene expression profiles of Beta-cell enriched tissue obtained by laser capture microdissection from subjects with type 2 diabetes. PLoS One. 2010; 5(7):e11499 10.1371/journal.pone.0011499 [DOI] [PMC free article] [PubMed] [Google Scholar]
- 21.Zhao C, Rutter GA. Overexpression of lactate dehydrogenase A attenuates glucose-induced insulin secretion in stable MIN-6 beta-cell lines. FEBS Lett. 1998;430(3):213–6. [DOI] [PubMed] [Google Scholar]
- 22.Malmgren S, Nicholls DG, Taneera J, Bacos K, Koeck T, Tamaddon A, et al. Tight coupling between glucose and mitochondrial metabolism in clonal beta-cells is required for robust insulin secretion. J Biol Chem. 2009;284(47):32395–404. 10.1074/jbc.M109.026708 [DOI] [PMC free article] [PubMed] [Google Scholar]
- 23.Verma MK, Yateesh AN, Smitha R, Neelima K, Pallavi PM, Reddy M, et al. Integrated analysis of chronic lipotoxicity on muscle metabolism and stress and its reversal by antioxidants. Springerplus. 2014;3:251 10.1186/2193-1801-3-251 [DOI] [PMC free article] [PubMed] [Google Scholar]
- 24.Day C, Bailey CJ. Obesity in the pathogenesis of type 2 diabetes. Br J Diabetes Vasc Dis. 2010;11(2):55–61. 10.1177/1474651411407418 [DOI] [Google Scholar]
- 25.DeFronzo RA. Insulin resistance, lipotoxicity, type 2 diabetes and atherosclerosis: the missing links. The Claude Bernard Lecture 2009. Diabetologia. 2010;53(7):1270–87. 10.1007/s00125-010-1684-1 [DOI] [PMC free article] [PubMed] [Google Scholar]
- 26.Pradhan AD, Manson JE, Rifai N, Buring JE, Ridker PM. C-reactive protein, interleukin 6, and risk of developing type 2 diabetes mellitus. JAMA. 2001;286(3):327–34. [DOI] [PubMed] [Google Scholar]
- 27.Festa A, D'Agostino R Jr, Tracy RP, Haffner SM; Insulin Resistance Atherosclerosis Study. Elevated levels of acute-phase proteins and plasminogen activator inhibitor-1 predict the development of type 2 diabetes: the insulin resistance atherosclerosis study. Diabetes. 2002;51(4):1131–7. 10.2337/diabetes.51.4.1131 [DOI] [PubMed] [Google Scholar]
- 28.Herder C, Baumert J, Zierer A, Roden M, Meisinger C, Karakas M, et al. Immunological and cardiometabolic risk factors in the prediction of type 2 diabetes and coronary events: MONICA/KORA Augsburg case-cohort study. PLoS One. 2011;6(6):e19852 10.1371/journal.pone.0019852 [DOI] [PMC free article] [PubMed] [Google Scholar]
- 29.Agrawal NK, Kant S. Targeting inflammation in diabetes: Newer therapeutic options. World J Diabetes. 2014;5(5):697–710. 10.4239/wjd.v5.i5.697 [DOI] [PMC free article] [PubMed] [Google Scholar]
- 30.Samuvel DJ, Sundararaj KP, Nareika A, Lopes-Virella MF, Huang Y. Lactate boosts TLR4 signaling and NF-kappaB pathway-mediated gene transcription in macrophages via monocarp- boxylate transporters and MD-2 up-regulation. J Immunol. 2009;182(4):2476–84. 10.4049/jimmunol.0802059 [DOI] [PMC free article] [PubMed] [Google Scholar]
- 31.Si Y, Shi H, Lee K. Impact of perturbed pyruvate metabolism on adipocyte triglyceride accumulation. Metab Eng. 2009;11(6):382–90. 10.1016/j.ymben.2009.08.001 [DOI] [PMC free article] [PubMed] [Google Scholar]
- 32.Lipina C, Macrae K, Hundal HS. Glucose availability and metabolism represent an important determinant of fatty-acid-induced insulin resistance and pro-inflammatory signalling in skeletal muscle [Abstract]. Diabet Med. 2012;29 (SUPPL1):50 10.1111/j.1464-5491.2011.03555_1.x21726279 [DOI] [Google Scholar]
- 33.DiGirolamo M, Newby FD, Lovejoy J. Lactate production in adipose tissue: a regulated function with extra-adipose implications. FASEB J. 1992;6(7):2405–12. [DOI] [PubMed] [Google Scholar]
- 34.Choi CS, Kim YB, Lee FN, Zabolotny JM, Kahn BB, Youn JH. Lactate induces insulin resistance in skeletal muscle by suppressing glycolysis and impairing insulin signaling. Am J Physiol Endocrinol Metab. 2002;283(2):E233–40. [DOI] [PubMed] [Google Scholar]
- 35.Mondon CE, Jones IR, Azhar S, Hollenbeck CB, Reaven GM. Lactate production and pyruvate dehydrogenase activity in fat and skeletal muscle from diabetic rats. Diabetes. 1992;41(12):1547–54. [DOI] [PubMed] [Google Scholar]
- 36.Li J, Deng J, Sheng W, Zuo Z. Metformin attenuates Alzheimer's disease-like neuropathology in obese, leptin-resistant mice. Pharmacol Biochem Behav. 2012; 101(4):564–74. 10.1016/j.pbb.2012.03.002 [DOI] [PMC free article] [PubMed] [Google Scholar]
- 37.Oakes ND, Thalén P, Aasum E, Edgley A, Larsen T, Furler SM, Ljung B, et al. Cardiac metabolism in mice: tracer method developments and in vivo application revealing profound metabolic inflexibility in diabetes. Am J Physiol Endocrinol Metab. 2006;290(5):E870–81. 10.1152/ajpendo.00233.2005 [DOI] [PubMed] [Google Scholar]
- 38.Mukherjee B, Hossain CM, Mondal L, Paul P, Ghosh MK. Obesity and insulin resistance: an abridged molecular correlation. Lipid Insights. 2013;6:1–11. 10.4137/LPI.S10805 [DOI] [PMC free article] [PubMed] [Google Scholar]
- 39.Shoelson SE, Herrero L, Naaz A. Obesity, inflammation, and insulin resistance. Gastroenterology. 2007;132(6):2169–80. [DOI] [PubMed] [Google Scholar]
- 40.Gao ZG, Zuberi A, Quon MJ, Dong ZG, Ye JP. Aspirin inhibits serine phosphorylation of insulin receptor substrate 1 in tumor necrosis factor-treated cells through targeting multiple serine kinases. J Biol Chem. 2003;278(27):24944–50. [DOI] [PubMed] [Google Scholar]
- 41.Klover PJ, Zimmers TA, Koniaris LG, Mooney RA. Chronic exposure to interleukin-6 causes hepatic insulin resistance in mice. Diabetes. 2003;52(11):2784–9. [DOI] [PubMed] [Google Scholar]
- 42.Senn JJ, Klover PJ, Nowak IA, Mooney RA. Interleukin-6 induces cellular insulin resistance in hepatocytes. Diabetes. 2002;51(12):3391–9. [DOI] [PubMed] [Google Scholar]
- 43.Zeczycki TN, Maurice MS, Attwood PV. Inhibitors of Pyruvate Carboxylase. Open Enzym Inhib J. 2010;3:8–26. 10.2174/1874940201003010008 [DOI] [PMC free article] [PubMed] [Google Scholar]
- 44.Thornburg JM, Nelson KK, Clem BF, Lane AN, Arumugam S, Simmons A, et al. Targeting aspartate aminotransferase in breast cancer. Breast Cancer Res. 2008; 10(5):R84 10.1186/bcr2154 [DOI] [PMC free article] [PubMed] [Google Scholar]
- 45.Jitrapakdee S, St Maurice M, Rayment I, Cleland WW, Wallace JC, Attwood PV. Structure, mechanism and regulation of pyruvate carboxylase. Biochem J. 2008;413(3):369–87. 10.1042/BJ20080709 [DOI] [PMC free article] [PubMed] [Google Scholar]
- 46.Kumashiro N, Beddow SA, Vatner DF, Majumdar SK, Cantley JL, Guebre-Egziabher F, et al. Targeting pyruvate carboxylase reduces gluconeogenesis and adiposity and improves insulin resistance. Diabetes. 2013; 62(7):2183–94. 10.2337/db12-1311 [DOI] [PMC free article] [PubMed] [Google Scholar]
- 47.Martin-Requero A, Ayuso MS, Parrilla R. Interaction of oxamate with the gluconeogenic pathway in rat liver. Arch Biochem Biophys. 1986;246(1):114–27. [DOI] [PubMed] [Google Scholar]
- 48.Martin-Requero A, Ayuso MS, Parrilla R. Rate-limiting steps for hepatic gluconeogenesis. Mechanism of oxamate inhibition of mitochondrial pyruvate metabolism. J Biol Chem. 1986;261(30):13973–8. [PubMed] [Google Scholar]
- 49.Zhai X, Yang Y, Wan J, Zhu R, Wu Y. Inhibition of LDH-A by oxamate induces G2/M arrest, apoptosis and increases radiosensitivity in nasopharyngeal carcinoma cells. Oncology Reports. 2013;30(6):2983–91. 10.3892/or.2013.2735 [DOI] [PubMed] [Google Scholar]
- 50.Li X, Lu W, Hu Y, Wen S, Qian C, Wu W, Huang P. Effective inhibition of nasopharyngeal carcinoma in vitro and in vivo by targeting glycolysis with oxamate. Int J Oncol. 2013;43(5):1710–8. 10.3892/ijo.2013.2080 [DOI] [PubMed] [Google Scholar]
- 51.Granchi C, Paterni I, Rani R, Minutolo F. Small-molecule inhibitors of human LDH5. Future Med Chem. 2013;5(16):1967–91. 10.4155/fmc.13.151 [DOI] [PMC free article] [PubMed] [Google Scholar]
Associated Data
This section collects any data citations, data availability statements, or supplementary materials included in this article.
Data Availability Statement
All relevant data are within the paper