Abstract
Extraction of data from the proprietary RAW files generated by Thermo Fisher mass spectrometers is the primary step for subsequent data analysis. High resolution and high mass accuracy data obtained by state-of-the-art mass spectrometers (e.g., Orbitraps) can significantly improve both peptide/protein identification and quantification. We developed RawConverter, a stand-alone software tool, to improve data extraction on RAW files from high-resolution Thermo Fisher mass spectrometers. RawConverter extracts full scan and MSn data from RAW files like its predecessor RawX-tract, most importantly, it associates the accurate precursor mass-to-charge (m/z) value with the tandem mass spectrum. RawConverter accepts RAW data generated by either data-dependent acquisition (DDA) or data-independent acquisition (DIA). It generates output into MS1/MS2/MS3, MGF or mzXML file formats, which fulfills the format requirements for most data identification and quantification tools. Using the tandem mass spectra extracted by RawConverter with corrected m/z values, 32.8%, 27.1%, and 84.1% more peptide spectra matches (PSMs) produce 17.4% (13.0%), 14.4% (11.5%), and 45.7% (36.2%) more peptide (protein) identifications than ProteoWizard, pXtract and RawXtract, respectively. Raw-Converter is implemented in C# and is freely accessible at http://fields.scripps.edu/rawconv.
Graphical Abstract
INTRODUCTION
Protein identification and quantification using tandem mass spectrometry (MS/MS) has gained widespread use in proteomics research. In a typical proteomics experiment, proteins are proteolyzed into peptides, which are then ionized by ESI and analyzed by tandem mass spectrometers. Tandem mass spectra collected from ionized peptide fragments are searched against protein sequence databases to identify peptide sequences and proteins that were present in the sample. The start of the data analysis process requires extracting data from the instrument’s data file. By USA Federal regulation, instrument data files to be provided as electronic data to the Federal Drug Administration (FDA) must be proprietary, and thus data extraction into a format that can be used by proteomic search programs requires the use of computer software provided by the instrument maker. A number of computer programs like RawXtract 1, ProteoWizard 2, and pXtract 3 have been developed to read data files. Interestingly, Hao et al.4 showed that phosphopeptide identification results could vary significantly depending on the extraction program used, suggesting that not all programs extract and process data in the same manner, or with the same effectiveness. Furthermore, Furthermore, data from mass spectrometers have been improving and new types of data acquisition strategies are being used, creating new data extraction and processing challenges.
The development of Orbitrap mass spectrometers has made the use of high resolution and high mass accuracy data much more commonplace. While the use of a high accuracy mass assignment in a database search can significantly reduce the search space, the assignment of the precursor ion as the monoisotopic ion with high-resolution data is a challenge. During MS/MS an isolation window of approximately 3 amu wide is used to collect a tandem mass spectrum and acquisition of the MS/MS is triggered by the most abundant ion within the isotopic cluster, which is usually the monoisotopic precursor ion. However, above roughly 1500 Da, the 13C containing isotopic ion is the most abundant ion for a peptide, and thus is responsible for triggering MS/MS. In these cases, the 13C containing isotopic ion will be recorded as the precursor ion in the data file.5 The Thermo Fisher data acquisition software will attempt to identify which ion is the monoisotopic ion of the isotope cluster and this process can be confounded if there are multiple precursor ions in the isolation window or if the signal-to-noise ratio (S/N) of the precursor ion is low. Failure to accurately identify the monoisotopic ion can negate the benefits of using accurate mass assignments in a search, as use of the M+1 or M+2 ion can create 1–2 amu mass errors. This error might not heavily influence protein identification, but it can limit the benefit of higher accuracy mass spectrometers for the characterization of post-translational modifications (PTMs). Precursor mass assignment is even more challenging when MS/MS data is collected by data independent acquisition (DIA) because no precursor m/z value and charge state is supplied with the peptide fragmentation information unless an MS1 scan is collected. In some programs, data files collected in a DIA mode use the m/z value of the middle of the isolation window.6 Most current data analysis tools, either database searching or de novo sequencing, depend on accurate precursor information to confidently identify peptides.
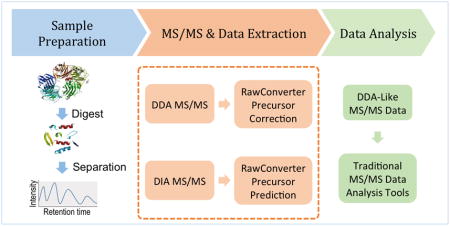
Several computational strategies have been proposed to rectify these issues in data extraction. For example, ProteoWizard 2 and pXtract 3 provide a function to pick a monoisotopic peak from the MS1 scan for each tandem mass spectrum in a DDA data set. ProteoWizard has recently been improved by integrating a wavelet-based peak picker and a precursor charge-determining algorithm 7, which help to extract more accurate peak m/z ratios and precursor charge states. Another extraction tool, pXtract, determines the monoisotopic peak of a peptide precursor using its integrated pParse algorithm.3 It adopts a simple scoring function to evaluate each piece of candidate precursor information by considering three features extracted from the candidate precursor peaks. These two extraction tools have been intrinsically designed to correct precursor m/z ratios for DDA, but not DIA data. Hoopmann et al. 8 proposed another computational approach that employs an averagine model 9 to predict the monoisotopic m/z values for tandem mass spectra. This method distinguishes signals from background using a Thrash approach.10 It then looks for all possible isotopic envelopes for each peak in a given m/z range and iteratively combines them to fit the observed peak intensities. All possible combinations of two isotopic envelopes are analyzed iteratively until either the maximum number of combinations specified by the user is reached or the dot-product threshold is exceeded. This approach requires users to specify the conditions of iteration termination. Venable et al. proposed a cross-correlation algorithm for calculation of peptide molecular weight from tandem mass spectra.11 This cross-correlation algorithm uses complementary b- and y-ions to calculate the accurate precursor mass and can be used on both DDA and DIA data. DIA-Umpire 12 is a recently published workflow for DIA data analysis. It provides a function to generate pseudo-tandem mass spectra with precursor information predicted from both MS1 precursor isotopes and MS/MS fragment ions. Both the Venable et al. approach and DIA-Umpire use MS/MS fragment ion information in tandem mass spectra to predict monoisotopic m/z precursor values. However, we claim that in a well-designed proteomics experiment the precursor m/z values and charge states of tandem mass spectra can be accurately retrieved from high-resolution MS1 scans without the need of simultaneously using fragment ion information as Venable et al. and DIA-Umpire propose. MS/MS fragment ion information can be alternatively used as an optional step for validating the corrected or predicted precursor m/z values and charge states. We propose an elegant computational approach that thoroughly utilizes the information in MS1 scans. It can address the precursor correction and prediction issues in both DDA and DIA data extraction. This novel algorithm has been implemented and integrated into a new user-friendly software tool, RawConverter. RawConverter is designed for use with both DDA and DIA data acquisition strategies. It extracts the MS and MS/MS data from Thermo Fisher RAW files and determines correct monoisotopic m/z values for selected precursor ions in MS/MS. For DDA data, RawConverter provides an option to assign the monoisotopic precursor m/z value for each MS/MS spectrum. For DIA data, RawConverter can select all the possible peptide precursors from the MS1 scan in a given isolation window. Our experiments demonstrate that RawConverter helps to improve peptide identification from DDA data and enables DIA data analysis using traditional database searching tools.
METHODS
RawConverter can be run in either GUI-based or command line-based mode. It is implemented by C# using Microsoft Visual Studio Express 2013 and uses Thermo MSFileReader library to parse RAW files. RawConverter is freely accessible at http://fields.scripps.edu/rawconv.
In a DDA experiment, the tandem mass spectrometer selects and fragments target precursor ions based on abundance. Subsequent analysis by database searching assumes that the majority of fragment ions detected in a spectrum come from a single peptide precursor ion and thus can be matched to a single theoretical peptide spectrum. Other ionized peptide ions can occur within the user defined m/z isolation window (typically ±1 Da) and also be fragmented, but the small window size will limit the frequency of this occurrence.13,14 In contrast, in a DIA experiment all precursor ions within a wider isolation window (e.g., ±10 Da) are fragmented and detected as a mixed spectrum. Our assumption is that, in most cases, a more abundant peptide ion in an isolation window generates the dominant and more abundant fragment ions, although this assumption does not consider peptide related fragmentation efficiency. Based on this assumption, RawConverter is designed to accurately report information about the most abundant precursor ions in an isolation window. For DDA data, the m/z value of the precursor ion is corrected, and for DIA data, the m/z values and charge states of all abundant precursor ions in the isolation window are reported for a single MS/MS spectrum.
Precursor peptide ions are recognized in an isolation window using two steps: (i) isotopic envelopes are constructed for all possible charge states for each peak, and (ii) each isotopic envelope is evaluated to filter out impossible matches. RawConverter generates all possible isotopic envelopes based on the observed m/z values and possible charge states (instrument-provided charge state in DDA data extraction and charge 1 to 6 in DIA data extraction in our experiments). The maximum monoisotopic precursor mass in the isotopic envelope construction is 8 kDa. The selection of this preset mass threshold is because above 8,000 Da the monoisotopic peak cannot be identified due to its negligible abundance according to the averagine lookup table,9 and RawConverter is not designed to retrieve peaks not present in the spectra. This also stays within the limits of typical bottom-up MS/MS-based shotgun proteomics experiment, where generating peptides larger than 8 kDa is unlikely and a threshold of 6 kDa is frequently used as the maximum peptide mass in database searches.
The evaluation of isotopic envelopes can be treated as a linear programming problem. Let E be the set of envelopes, Ei ∈ E the ith envelope, and the jth peak in envelope Ei. Let P be the set of peaks in the isolation window and Pi ∈ P be the ith peak. We define two functions, mz(·) and h(·), to get the m/z value and the intensity of a given peak, respectively. We use wi to denote the weight of envelope Ei and ε to measure the difference between the theoretical and observed peak intensity. Then the isotopic envelope evaluation problem can be represented as following:
A weighted value is reported for each envelope by solving this linear programming problem. The peak intensities in each envelope are recalculated according to these weight values. Each envelope contains all possible isotopic peaks and the distribution of these intensities is called an observed isotope distribution (Eobsv). From the averagine lookup table,9 a theoretical isotope distribution (Etheo) can be retrieved using the mass of the target peptide. Two distributions are compared to calculate a distribution similarity score using Eq. (1):
| (1) |
| (2) |
| (3) |
where Imono(Eobsv) is the log-relative intensity of the first peak in Eobsv, Eobsvi denotes the intensity of the ith peak in Eobsv, and Etheoi denotes the intensity of the ith peak in Etheo.
For DDA data, the observed envelope with the top similarity score relative to the theoretical one is considered to be the correct envelope and its first peak is selected as the monoisotopic peak. To improve accuracy, we also apply the same approach on the previous and next MS scans. The envelope selected at least twice from these three MS scans will be used to report the monoisotopic precursor information. For DIA data, the observed envelopes with top N similarity scores are selected and their corresponding monoisotopic m/z values and charge states are reported as precursor information of the given tandem mass spectrum. RawConverter dynamically determines the value of N according to the width of the isolation window.
RESULTS
RawConverter provides three types of conversions: (i) conversion of binary Thermo Fisher RAW files to text-based files in the form of MS1/MS2/MS3, MGF, or mzXML format, (ii) conversion of mzML or mzXML files to MS1/MS2/MS3 or MGF files, and (iii) conversion between MGF files and MS2 files. The resulting text-based files can be submitted directly to most current database search and de novo sequencing software tools. We evaluated the performance of RawConverter in two experiments, one that evaluated monoisotopic peak selection for DDA data and the other that evaluated precursor prediction for DIA data.
1. Evaluation of Monoisotopic Peak Selection for DDA Data
We compared RawConverter with RawXtract v1.9.9.2 1, pXtract v2.0 (with pParse 3), and ProteoWizard v3.0.7162 2. Since RawXtract cannot select monoisotopic peaks in data extraction, it was used as the baseline in the comparison. These four extraction tools were applied to a RAW file generated from a Thermo Velos LTQ Orbitrap mass spectrometer. Briefly, 10 ug of HEK293T cells were digested with trypsin after reduction and alkylation with iodoacetamide. The resulting peptides were separated and analyzed by MudPIT 15 and a single salt fraction was used for comparison of extraction tools. All programs extracted a total of 37532 tandem mass spectra and each set was searched against the UniProt 16 human protein database using IP2.17 The database search tools in IP2, ProLuCID 18 and DTASelect 2 19, are used to process the search results. The precursor and fragment error tolerance were set as 50 ppm and 600 ppm, respectively. Semi-tryptic peptides with one missed-cleavage site were considered. Carbami-domethylation (Cys) was set as a fixed modification. Oxidation (Met) and deamidation (Asn and Gln) were set as variable modifications, and at most one variable modification was allowed for each peptide. We used the target-decoy database search strategy to control the false discovery rate (FDR) and the FDR threshold was set as 1% at the peptide-spectrum match (PSM) level. The number of isotopic peaks considered in the ProLuCID search was set to one to measure the accuracy of monoisotopic peak assignment by different extraction programs. To further evaluate the performance of tandem mass spectrometry data analysis using IP2 with RawConverter-extracted data, we also included MaxQuant 20 in the comparison. A difficulty with this comparison is that MaxQuant reads tandem mass spectra directly from a RAW file and searches the data using Andromeda 21. In our experiment, the same RAW file was submitted to MaxQuant for the Andromeda database search 21, using as closely as possible the same IP2 search parameters. It is possible that any differences observed in the analysis are related to the performance of the search algorithms rather than data extraction, but Cox et al. claims Andromeda is comparable to any other search tools.21
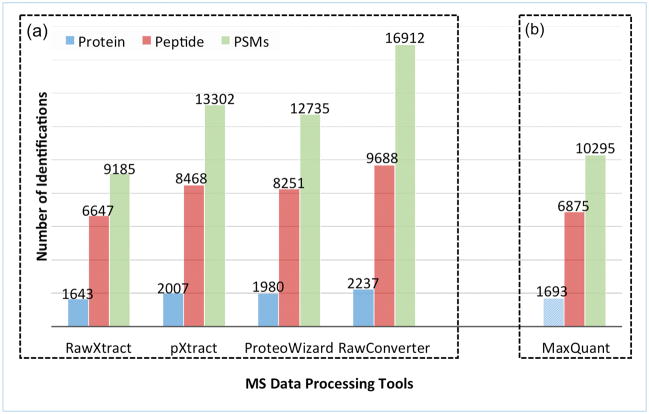
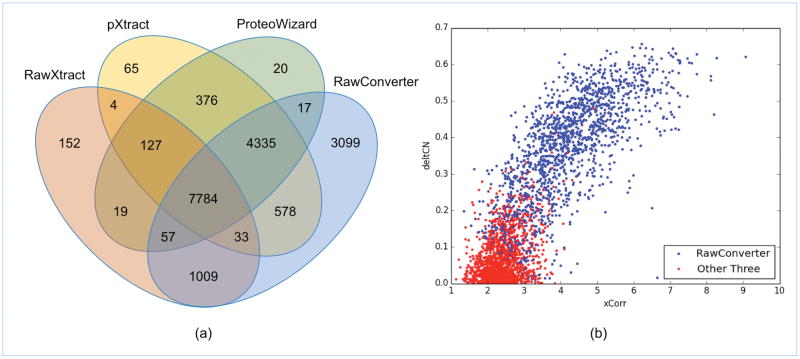
Figure 1 shows the numbers of peptide identification from the data sets extracted by the four extraction tools using the same search parameters and database search tool. The number of identifications using MaxQuant is shown as a sidebar because the integration of Andromeda in Max Quant does not allow a direct comparison of the extraction step in this method. IP2 identified the most peptides and proteins using the data set extracted by RawConverter (Figure 1a). MaxQuant (Figure 1b) identified slightly more PSMs and peptides than RawXtract. However, after precursor m/z value correction, the other three extraction programs significantly exceeded MaxQuant in the numbers of identifications, both at the PSM and peptide level. We further examined the overlaps between identifications from the four data sets. The Venn diagram in Figure 2a shows 7784 PSMs were identified from all four data sets, 3099 PSMs were identified exclusively in the data set generated by RawConverter, and 763 were reported exclusively in the other three data sets.
Figure 1.
Comparison of the numbers of identifications from the data sets extracted by five MS data processing software tools. (a) MS2 files were generated from the four extraction tools and then analyzed by IP2. (b) The RAW file was directly read and then analyzed by MaxQuant using the Andromeda search program but using as closely as possible the same parameters as IP2.
Figure 2.
Comparison of identified PSMs from the data sets extracted by the four extraction software tools. (a) The overlap of identified PSMs, and (b) the score distribution of different PSMs identified from the data sets extracted by RawConverter and the other three tools.
To understand why 3099 PSMs in Figure 1a were exclusively reported from the RawConverter-generated data set, we further checked the internal identification results of other three data sets in IP2, i.e., the ProLuCID search results without the post-analysis using DTASelect 2. First, we noticed that the tandem mass spectra extracted by the other three extraction tools had +1 Da precursor mass shift. This is due to the incorrect assignment of precursor m/z values by picking the M+1 peak. Further examination of the top scoring PSMs reported by ProLuCID for these spectra showed that 1580 of them were interpreted as modified peptides with deamidation on an Asn or Gln residue. According to our database search parameter description, deamidation on Asn/Gln was considered as a variable PTM. ProLuCID used deamidation in these modified peptides to match the spectrum precursor mass. However, such incorrect mass compensation resulted in loss of some of the peak matching and led to lower XCorr and DeltCN scores, which caused the top scoring PSMs of these spectra to be discarded by DTASelect 2. In contrast, RawConverter assigned correct precursor m/z values to these 1580 spectra and they were then matched to unmodified peptides without introducing deamidation for precursor mass matching. The unmodified PSMs identified by RawConverter acquired higher XCorr and DeltCN scores and thus passed the post-analysis. Similarly, we also checked the internal identification results for the other 1519 tandem mass spectra, which were plotted in Figure 2b with their XCorr and DeltCN scores. Blue dots indicate results from the spectra extracted by RawConverter and red dots denote results from the spectra extracted by the other three tools. Clearly, accurately assigned precursor m/z values help to select the correct peptide candidates with higher XCorr and DeltCN scores in a database search as shown in Figure 2b. These search results illustrated the benefits of accurate extraction and processing of mass spectral data using RawConverter. In the RawConverter-extracted data set, only 17 PSMs have lower XCorr scores than data extracted from the other three extraction programs. Careful examination of the data showed that these errors were caused by low precursor ion abundance and isobaric ions present from peptide co-elution.
2. Evaluation on Precursor Prediction for DIA Data
There are two different strategies for acquiring DIA data: (i) collecting an MS1 scan prior to fragmenting all ions within the selection window, and (ii) fragmenting all ions within the selection window without collecting an MS1 scan in advance. RawConverter is optimized for extracting the DIA data generated after collecting an MS1 scan. In DIA data collection a tandem mass spectrum is generated by fragmenting all precursor peptide ions in a wide isolation window, thus in most cases it has multiple pieces of precursor information, unlike DDA data collection that merely uses a single piece of precursor information. A straightforward way to analyze a DIA tandem mass spectrum is to search it multiple times, specifying a single piece of precursor information each time. RawConverter automatically generates DDA-like spectral files from DIA data to simulate a DDA-like search approach using a traditional database search tool.
DDA and DIA files of HEK 293T cell lysate were collected on a Thermo Fisher Q Exactive. Briefly, 1 ug of trypsin-digested lysate was injected onto a 20cm C18 column (YMC 5uM particles) and peptides were separated over a four-hour reverse phase gradient using a Nano Easy nLCII. DDA files were acquired with a 1.5-m/z isolation window and intensity based peak selection with a dynamic exclusion of 15s. DIA raw files were acquired with windows of 3, 5, or 10 m/z spanning the range of 400–1200 m/z and repeated cycling throughout the experiment.
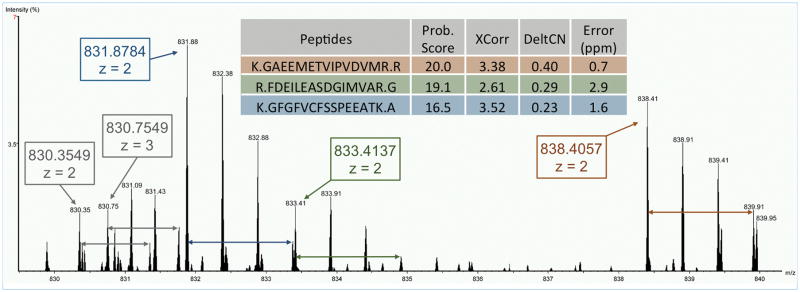
Figure 3 illustrates an example of the precursor prediction using RawConverter. Given a DIA MS/MS spectrum with center precursor m/z of 835, RawConverter located its isolation window in the corresponding MS1 scan according to its center m/z value and the isolation window width. In the isolation window, five peptide precursors were predicted, as shown in the boxes in Figure 3. ProLu-CID, coupled with DTASelect 2, identified three (in colored boxes in Figure 3) of these five peptide precursors.
Figure 3.
An example of the precursor prediction function of RawConverter. Five peptide precursor m/z values and charge states were predicted and three of them (in colored boxes) were identified from the corresponding MS/MS spectrum.
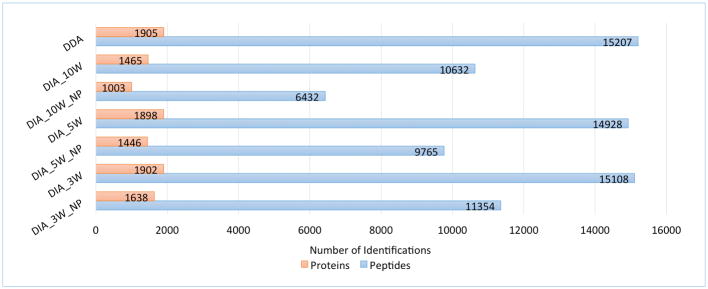
The DIA data sets acquired with three different isolation window widths performed differently in peptide and protein identification using our proteomics analysis pipeline, IP2. Theoretically, a smaller isolation window width indicates a smaller number of co-eluted peptides in a DIA tandem mass spectrum, and thus increases the probability of confidently identifying one or multiple peptides from each spectrum. This is confirmed in the comparison of identified peptide/protein numbers as shown in Figure 4. In this experiment, three MS2 files, DIA_3W, DIA_5W, and DIA_10W, were generated from the three DIA RAW files by RawConverter (with precursor predicted) and then analyzed by IP2 proteomics analysis pipeline (Pro-LuCID with DTASelect 2). The precursor and fragment error tolerance were set as 50 ppm and 100 ppm, respectively. Semi-tryptic peptides with at most one missed-cleavage site were considered. Carbamidomethylation (Cys) was set as a fixed modification. Oxidation (Met) and deamidation (Asn and Gln) were set as variable modifications, and at most one variable modification was allowed for each peptide. In the DTASelect filtering, precursor delta mass cutoff was set as 10 ppm. The target-decoy database search strategy was used to control the FDR and the FDR threshold was set as 1% at the peptide level. As shown in Figure 4, with a DIA data isolation window width of 3 m/z, 1.2% and 42.1% more peptides were identified than from the data sets with isolation window width of 5 m/z and 10 m/z, respectively.
Figure 4.
Comparison of the numbers of peptides/proteins identified from DDA and DIA data sets. DIA data was acquired with three different isolation windows, 3 m/z, 5 m/z, and 10 m/z. DIA_3W_NP, DIA_5W_NP, and DIA_10W_NP are the data sets extracted by RawConverter without precursor information prediction, and DIA_3W, DIA_5W, and DIA_10W are the data sets with predicted precursor information.
To evaluate the performance of the precursor prediction, we re-analyzed the DIA data sets without precursor ions predicted in data extraction. Since in the DIA mode the instrument only provides the center m/z value of an isolation window and no charge state, RawConverter, by default, generates MS2 files with two charge states (charge 2 and 3) for each MS/MS spectrum. For the DIA data set with an isolation window width of 3 m/z, the precursor error tolerance was set as 4.5 Da because a peptide in this isolation window would differ from the middle m/z with at most 4.5 Da when the peptide was triply charged. Similarly, for the DIA data sets with an isolation window width of 5 m/z and 10 m/z, the precursor ion error tolerance values were set as 7.5 Da and 15 Da. All other search parameters were kept the same as in the previous search, except that the precursor delta mass cutoff in DTASelect 2 was disabled. As shown in Figure 4, 6432, 9765, and 11354 peptides were identified from these MS2 files without precursor prediction in data extraction. In contrast, when precursor prediction is selected using RawConverter, we have identified 65.3%, 52.9%, and 33.1% more peptides, proving the precursor prediction function can facilitate peptide identification from DIA tandem mass spectra. Not surprisingly, compared with the DDA data generated from the same sample and instrument, DIA data sets with larger windows produced fewer identifications both at the peptide and protein levels, as shown in Figure 4. However, the gap between identification numbers from the DDA and DIA data becomes smaller when a smaller isolation window width is set in DIA. Once the precursor mass is predicted, DIA data is comparable to DDA data when the isolation window width in DDA mode is set as 3 Da. As the speeds of mass spectrometers increase, it becomes more feasible to collect DIA data with small isolation windows, and our data suggest that prediction of precursor mass can allow the use of more stringent database searches with similar parameters and provides similar results to that of DDA data.
Conclusion
After decades of improvements in both mass spectrometry instruments and computational analysis approaches, peptide induced protein identification and quantification using mass spectrometry, aka. bottom-up proteomics, has become a routine method in proteomics research. The accuracy of a precursor mass may not be crucial in peptide identification, since in most cases the best PSM is based on the match between peptide fragment ions and the peaks in a given tandem mass spectrum. A wider precursor error tolerance, however, increases the running time and the number of reported false positives of some database search software tools. Also, accurate precursor information is required for the characterization of modified peptide with unknown PTMs and for peptide identification from DIA data.
RawConverter is designed to extract and process high resolution and mass accuracy data produced by advance mass spectrometers such as Orbitrap mass spectrometers. RawConverter converts Thermo RAW data into text-based files with different formats, fulfilling the requirement of multiple MS/MS data analysis tools. It also provides a powerful algorithm to correctly extract the precursor information for peptide precursor ions in both DDA and DIA data. This function enables accurate PTM mass calculation in an unrestricted PTM search. In DIA database peptide identification, it detects all the possible precursor m/z values and charge states from an MS scan. Such precursor information detection enables users to search for peptides using traditional peptide identification software packages with a narrow precursor error tolerance, which significantly reduces search space, accelerates search speed, and significantly reduces the number of false positives. Our experimental results have proved that RawConverter is an indispensable upgrade to MS/MS data extraction solutions.
Acknowledgments
The work was funded in part by NIH R01 MH067880 and P41 GM103533, UCLA/NHLBI Proteomics Centers (HHSN268201000035C), and Ministry of Science and Technology Overseas Project, Taiwan, R.O.C. (NSC 103-2917-I-008-040).
Footnotes
Author Contributions
The manuscript was written through contributions of all authors. / All authors have given approval to the final version of the manuscript.
Supporting Information
This material is available free of charge via the Internet at http://pubs.acs.org.
References
- 1.McDonald WH, Tabb DL, Sadygov RG, MacCoss MJ, Venable J, Graumann J, Johnson JR, Cociorva D, Yates JR., III Rapid Commun Mass Spectrom. 2004;18:2162–2168. doi: 10.1002/rcm.1603. [DOI] [PubMed] [Google Scholar]
- 2.Chambers MC, Maclean B, Burke R, Amodei D, Ruderman DL, Neumann S, Gatto L, Fischer B, Pratt B, Egertson J, Hoff K, Kessner D, Tasman N, Shulman N, Frewen B, Baker TA, Brusniak M, Paulse C, Creasy D, Flashner L, Kani K, Moulding C, Seymour SL, Nuwaysir LM, Lefebvre B, Kuhlmann F, Roark J, Rainer P, Detlev S, Hemenway T, Huhmer A, Langridge J, Connolly B, Chadick T, Holly K, Eckels J, Deutsch EW, Moritz RL, Katz JE, Agus DB, MacCoss MJ, Tabb DL, Mallick P. Nat Biotechnol. 2012;30:918–920. doi: 10.1038/nbt.2377. [DOI] [PMC free article] [PubMed] [Google Scholar]
- 3.Yuan ZF, Liu C, Wang HP, Sun RX, Fu Y, Zhang JF, Wang LH, Chi H, Li Y, Xiu LY, Wang WP, He SM. Proteomics. 2012;12(2):226–235. doi: 10.1002/pmic.201100081. [DOI] [PubMed] [Google Scholar]
- 4.Hao P, Ren Y, Tam JP, Sze SK. J Proteome Res. 2013;12(12):5548–5557. doi: 10.1021/pr4004486. [DOI] [PubMed] [Google Scholar]
- 5.Nassar AF, Hollenberg P, Scatina J. Drug metabolism handbook: concepts and applications. John Wiley and Sons; Hoboken, New Jersey: 2009. p. 216. [Google Scholar]
- 6.Venable JD, Dong MQ, Wohlschlegel J, Dillin A, Yates JR., III Nat Methods. 2004;1:39–45. doi: 10.1038/nmeth705. [DOI] [PubMed] [Google Scholar]
- 7.French WR, Zimmerman LJ, Schilling B, Gibson BW, Miller CA, Townsend RR, Sherrod SD, Goodwin CR, McLean JA, Tabb DL. J Proteome Res. 2014;14(2):1299–1307. doi: 10.1021/pr500886y. [DOI] [PMC free article] [PubMed] [Google Scholar]
- 8.Hoopmann MR, Finney GL, MacCoss MJ. Anal chem. 2007;79(15):5620–5632. doi: 10.1021/ac0700833. [DOI] [PMC free article] [PubMed] [Google Scholar]
- 9.Senko MW, Beu SC, McLaffertycor FW. J Am Soc Mass Spectrom. 1995;6:229–233. doi: 10.1016/1044-0305(95)00017-8. [DOI] [PubMed] [Google Scholar]
- 10.Horn DM, Zubarev RA, McLafferty FW. J Am Soc Mass Spectrom. 2000;11(4):320–332. doi: 10.1016/s1044-0305(99)00157-9. [DOI] [PubMed] [Google Scholar]
- 11.Venable JD, Xu T, Cociorva D, Yates JR., III Anal Chem. 2006;78(6):1921–1929. doi: 10.1021/ac051636h. [DOI] [PubMed] [Google Scholar]
- 12.Tsou CC, Avtonomov D, Larsen B, Tucholska M, Choi H, Gingras AC, Nesvizhskii AI. Nat methods. 2015;12(3):258–264. doi: 10.1038/nmeth.3255. [DOI] [PMC free article] [PubMed] [Google Scholar]
- 13.Zhang B, Pirmoradian M, Chernobrovkin A, Zubarev RA. Mol Cell Proteomics. 2014;13(11):3211–3223. doi: 10.1074/mcp.O114.038877. [DOI] [PMC free article] [PubMed] [Google Scholar]
- 14.Li H, Hwang KB, Mun DG, Kim H, Lee H, Lee SW, Paek E. J Proteome Res. 2014;13(7):3488–3497. doi: 10.1021/pr500060d. [DOI] [PubMed] [Google Scholar]
- 15.Washburn MP, Wolters D, Yates JR., III Nat Biotechnol. 2001;19(3):242–247. doi: 10.1038/85686. [DOI] [PubMed] [Google Scholar]
- 16.UniProt Consortium. Nucleic Acids Res. 2011:gkr981. doi: 10.1093/nar/gky092. [DOI] [PMC free article] [PubMed] [Google Scholar]
- 17.Integrated Proteomics Pipeline (IP2) http://www.integratedproteomics.com/
- 18.Xu T, Park SK, Venable JD, Wohlschlegel JA, Diedrich JK, Cociorva D, Lu B, Liao L, Hewel J, Han X, Wong CCL, Fonslow B, Delahunty C, Gao Y, Shah H, Yates JR., III J Proteomics. 2015 doi: 10.1016/j.jprot.2015.07.001. Accepted. [DOI] [PMC free article] [PubMed] [Google Scholar]
- 19.Tabb DL, McDonald WH, Yates JR., III J Proteome Res. 2002;1(1):21–26. doi: 10.1021/pr015504q. [DOI] [PMC free article] [PubMed] [Google Scholar]
- 20.Cox J, Mann M. Nat Biotechnol. 2008;26(12):1367–1372. doi: 10.1038/nbt.1511. [DOI] [PubMed] [Google Scholar]
- 21.Cox J, Neuhauser N, Michalski A, Scheltema RA, Olsen JV, Mann M. J Proteome Res. 2011;10(4):1794–1805. doi: 10.1021/pr101065j. [DOI] [PubMed] [Google Scholar]


