Abstract
Background
Current measures of obesity do not accurately describe body composition. Using cross-sectional imaging, objective measures of musculature and adiposity are possible and may inform efforts to optimize liver transplantation outcomes.
Methods
Abdominal visceral fat area and psoas muscle cross-sectional area were measured on CT scans for 348 liver transplant recipients. After controlling for donor and recipient characteristics, survival analysis was performed using Cox regression.
Results
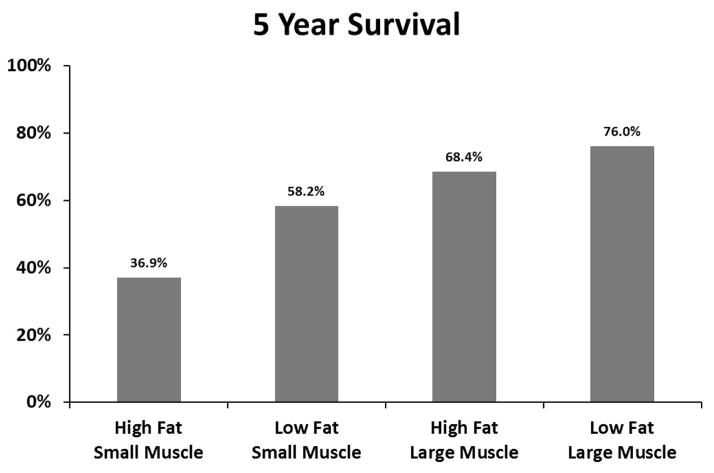
Visceral fat area was significantly associated with post-transplant mortality (p<0.001; HR=1.06 per 10 cm2, 95%CI: 1.04 – 1.09), as were positive hepatitis C status (p=0.004; HR = 1.78, 95%CI: 1.21 – 2.61) and total psoas area (p<0.001; HR = 0.91 per cm2, 95%CI: 0.88 – 0.94). Among patients with smaller total psoas area, the patients with high visceral fat area had 71.8% 1-year survival compared to 81.8% for those with low visceral fat area (p=0.15). At 5 years, the smaller muscle patients with high visceral fat area had 36.9% survival compared to 58.2% for those with low visceral fat area (p=0.023).
Conclusions
Abdominal adiposity is associated with survival after liver transplantation, especially in patients with small trunk muscle size. When coupled with trunk musculature, abdominal adiposity offers direct characterization of body composition that can aid preoperative risk evaluation and inform transplant decision-making.
Keywords: analytic morphomics, risk assessment, body composition, survival
Introduction
The prevalence of obesity in the United States continues to be a major health concern, with over one third of adults identified as obese.(1) As a result, Non-Alcoholic Steatohepatitis (NASH) has become the third most common indication for liver transplantation in the United States.(2) Although these patients have acceptable survival following transplantation, their body habitus makes them particularly susceptible to obesity-related complications and recurrence of NASH. This increasing group of liver transplant candidates also requires greater utilization of health care resources.(3)
Current measures of obesity do not accurately describe body composition or distinguish between lean body mass and adipose tissue. Previous studies have shown a strong correlation between survival and lean trunk muscle size following liver transplantation and major surgery.(4–5) While this has improved risk stratification, muscle by itself is insufficient to completely describe body composition. Within this context, objective measurement of body fat may improve efforts to assign risk and optimize outcomes in liver transplantation.
With this study, we evaluate abdominal visceral adiposity and outcomes following liver transplantation. Using a retrospective database of 348 liver transplant recipients, we hypothesize that increased abdominal visceral fat is associated with poorer survival following liver transplantation. Overall, we aim to evaluate the clinical importance of abdominal adiposity in conjunction with trunk musculature in order to better understand the relationship between body composition and survival following liver transplantation.
Methods
Study Population
Our study population was comprised of all adult (≥18 years old), deceased-donor liver transplant recipients at the University of Michigan between 2000 and 2011 with a suitable 90-day preoperative or postoperative CT scan. For patients with multiple scans, the scan nearest to transplantation was chosen with preference given to preoperative scans, if present. Patient records were retrospectively reviewed to collect patient age, gender, race, body mass index (BMI), preoperative serum albumin and preoperative MELD (Model for End-Stage Liver Disease) components (serum creatinine, total bilirubin, and INR). Additionally, etiology of end-stage liver disease (ESLD), presence of hepatocellular carcinoma (HCC), diabetes, hypertension requiring medication, smoking within the year prior to transplant, and donor age were also recorded.
Analytic Morphomics
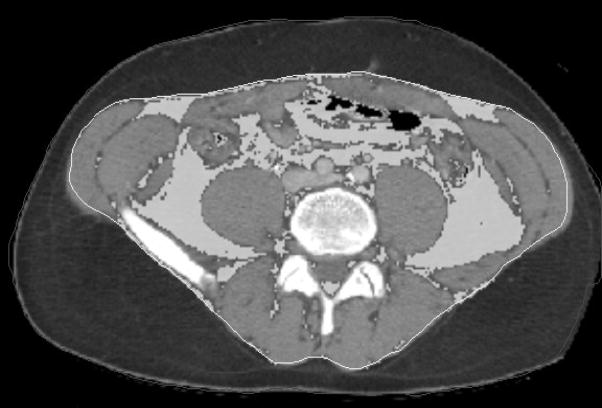
CT scans were processed using semi-automated algorithms programmed into MATLAB v13.0 (MathWorks; Natick, MA). After identifying individual vertebral levels on each patient’s CT scan, the deep fascia was traced at each level, as shown in Figure 1. Using automated methods, each pixel within the area encompassed by the fascia was sampled for its radiologic density (in Hounsfield Units [HU]). Those pixels which were sampled to be in the density range of fat were designated as abdominal visceral fat, and the sum of the pixels were termed the visceral fat area. The visceral fat area from T12 through L4 was averaged for each patient and served as the primary exposure variable for this study. Additionally, total psoas area (TPA) was measured as described in our previous work.(9–12) Briefly, the cross-sectional areas of the left and right psoas muscles at the level of L4 were measured.
Figure 1.
Outcomes
The primary outcome measures for this study were survival at 1 and 5 years following transplantation. Mortality was assessed by referencing the Social Security master death index.
Statistical Analysis
Descriptive statistics were computed for the study population. Continuous variables were summarized by mean and standard deviation, and frequency tables were produced for categorical variables. Continuous variables were compared using Student’s t-test, and categorical variables were compared using Fisher’s exact test. Relationships between visceral fat area and patient factors were assessed using standard linear regression techniques.
Standard survival analysis using Cox regression was performed to determine the covariate-adjusted effect of visceral fat area on post-transplantation mortality. Patients began follow-up at the time of liver transplantation and continued until the earliest of death or loss to follow-up. Adjustment covariates include all variables listed above. A final subset of adjustment criteria was determined using backwards selection.
All analyses were performed using SAS v9.1. A 2-sided significance of α=0.05 was used for all analyses. This study was approved by the University of Michigan Institutional Review Board with a waiver of informed consent for subjects.
Results
Study Population
Overall, 785 adult patients underwent deceased-donor liver transplantation from 2000 to 2011. Of these patients, 348 received a 90-day perioperative CT scan which included regions of interest for morphometric assessment. These patients served as the study population. Overall, 78 patients had preoperative scans, while the remaining 270 had postoperative scans.
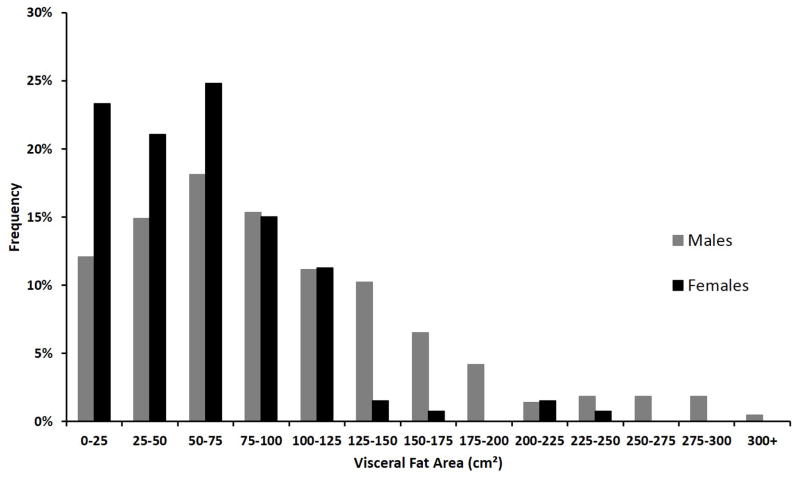
The distribution of visceral fat area for the study population is shown in Figure 2. Overall, males had significantly greater amounts of visceral fat area than females (96.1 cm2 vs 61.2 cm2, p<0.001). There was a linear correlation between visceral fat area and BMI for both males (Pearson-product moment correlation, r = 0.48) and females (r=0.50). Visceral fat area tended to increase with age (r=0.26 for males, 0.25 for females) and total psoas area (r=0.14 for males, 0.15 for females). Visceral fat area did not correlate strongly with MELD score (r=0.04 for both males and females) or serum albumin (r =0.09 for males, 0.08 for females).
Figure 2.
Descriptive statistics of the study population are shown in Table 1. Patients were designated as having either high or low visceral fat area, and large or small total psoas area. The median values of total psoas area and visceral fat area were used to separate these designations. Due to significant differences in both metrics due to gender, males and females were analyzed relative to their respective medians. Overall, the mean recipient age at transplant was 51.8 ± 10.0 years, and 61.8% (n=215) of patients were male. Patients designated as Small Muscle/High Fat were the oldest and had the greatest prevalence of diabetes, hypertension and cirrhosis. Patients designated as Large Muscle/Low Fat were the youngest and had the least prevalence of diabetes.
Table 1.
Patient Characteristics (N=348)
| Large Muscle High Fat | Large Muscle Low Fat | Small Muscle High Fat | Small Muscle Low Fat | |
|---|---|---|---|---|
| N | 90 | 85 | 85 | 88 |
| Female | 37.8% (34) | 38.8% (33) | 38.8% (33) | 37.5% (33) |
| Age (yrs) | 53.8 ± 8.1 | 47.6 ± 10.5 | 54.7 ± 8.9 | 50.9 ± 10.9 |
| Non White Race | 14.4% (13) | 23.5% (20) | 9.4% (8) | 18.2% (16) |
| Weight (kg) | 93.1 ± 18.6 | 77.8 ± 18.2 | 87.4 ± 19.9 | 72.7 ± 16.4 |
| BMI (kg/m2) | 31.3 ± 5.9 | 26.1 ± 5.6 | 30.1 ± 6.3 | 24.7 ± 4.2 |
| Creatinine (mg/dL) | 1.1 ± 0.8 | 1.2 ± 0.8 | 1.5 ± 1.0 | 1.5 ± 1.0 |
| Total Bilirubin (mg/dL) | 5.2 ± 7.0 | 7.3 ± 7.9 | 6.9 ± 7.4 | 8.4 ± 9.8 |
| INR | 1.7 ± 1.1 | 1.7 ± 1 | 1.6 ± 0.6 | 1.6 ± 0.4 |
| Albumin (g/dL) | 2.9 ± 0.7 | 2.8 ± 0.7 | 2.8 ± 0.6 | 2.8 ± 0.6 |
| Diabetes | 27.8% (25) | 17.6% (15) | 45.9% (39) | 21.6% (19) |
| Smoking within 1 yr | 16.7% (15) | 18.8% (16) | 27.1% (23) | 27.3% (24) |
| HTN requiring medication | 46.7% (42) | 50.6% (43) | 62.4% (53) | 45.5% (40) |
| HCV | 45.6% (41) | 36.5% (31) | 40% (34) | 30.7% (27) |
| Cirrhosis | 33.3% (30) | 36.5% (31) | 51.8% (44) | 40.9% (36) |
| HCC | 51.1% (46) | 22.4% (19) | 23.5% (20) | 11.4% (10) |
| MELD | 16.6 ± 8.1 | 19.2 ± 6.9 | 19.6 ± 8.4 | 19.4 ± 7 |
| Donor Age (yrs) | 40.9 ± 16.8 | 37.6 ± 16.5 | 38.2 ± 16.3 | 39.0 ± 17 |
| Total Psoas Area (cm2) | 24.9 ± 6.6 | 23.3 ± 5.6 | 15.8 ± 4.7 | 15.3 ± 4.6 |
| Visceral Fat Area (cm2) | 126.2 ± 54.0 | 42.3 ± 20.8 | 125.7 ± 56.9 | 36.0 ± 21.3 |
The relationship between visceral fat area and presence of HCC or hepatitis C virus (HCV) was also explored. There were no significant differences in visceral fat area for patients based on HCV status (88.6 cm2 for HCV positive patients vs 79.1 cm2, p=0.14), though the prevalence of HCV was significantly greater in Large Muscle/High Fat patients compared to Small Muscle/Low Fat (45.6% vs 30.7%, p = 0.046). Patients with HCC had significantly greater visceral fat area than those without HCC (108.0 vs. 73.3 cm2, p<0.001). This difference was significant for both males (117.3 vs. 87.1 cm2, p=0.003) and females (89.0 vs. 52.8 cm2, p=0.002). The prevalence of HCC was greatest in Large Muscle/High Fat patients and least in Small Muscle/Low Fat patients (51.1% vs 11.4%, p <0.001).
Survival Analysis
Cox regression was used to determine whether visceral fat area was an independent predictor of survival. All available covariates were entered into the model and the subset of adjustment covariates were chosen by backwards selection. The model showed that visceral fat area was a significant independent predictor of mortality (p<0.001; Hazard Ratio [HR]=1.06 per 10 cm2, 95% Confidence Interval [95%CI]: 1.04 – 1.09), as were hepatitis C positivity (p=0.004; HR = 1.78, 95%CI: 1.21 – 2.61) and total psoas area (p<0.001; HR = 0.91 per cm2, 95%CI: 0.88 – 0.94). Recipient age was not significant (p=0.29, HR = 1.01 per year, 95%CI: 0.99 – 1.04), as were non-White race (p = 0.96, HR = 1.02, 95%CI: 0.57 – 1.80), HCC (p=0.94, HR = 1.02, 95%CI: 0.61 – 1.70), BMI (p = 0.89, HR = 1.00, 95%CI: 0.96 – 1.03), gender (p=0.80, HR = 0.94 for females, 95%CI: 0.58 – 1.53), MELD (p=0.51, HR = 1.01, 95%CI: 0.98 – 1.04), hypertension (p=0.43, HR = 0.86, 95%CI: 0.58 – 1.26), smoking (p=0.30, HR = 1.28, 95%CI: 0.81 – 2.02), albumin (p = 0.22, HR = 1.83, 95%CI: 0.62 – 1.12), diabetes (p=0.16, HR = 1.34, 95%CI: 0.89 – 2.02), and donor age (p = 0.11, HR = 1.01 per year, 95%CI: 0.99 – 1.02). Additionally, creatinine (HR = 1.01, 95CI: 0.78 – 1.28), INR (HR = 0.98, 95CI: 0.69 – 1.38) and bilirubin (HR = 1.01, 95CI 0.98 – 1.04) were not significant predictors of survival when analyzed in lieu of MELD.
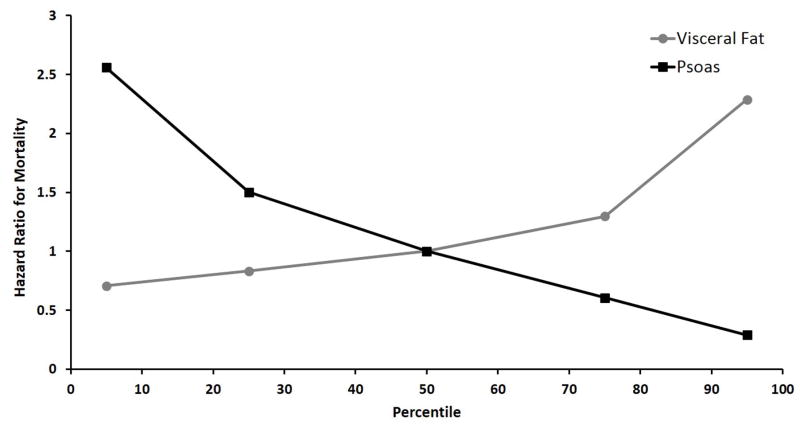
Figure 3 shows the covariate-adjusted hazard ratio for both visceral fat area and total psoas area across their observed ranges. The reference value is the median of each metric: 68.3 cm2 for visceral fat area and 1.9 cm2 for total psoas area. The hazard ratio for a patient in the 75th percentile of visceral fat area was 1.30 compared to a patient with median visceral fat area, holding other covariates equal. The hazard ratio for a patient in the 25th percentile of total psoas area was 1.50 compared to a patient with median total psoas area, holding other covariates equal.
Figure 3.
1-Year Survival
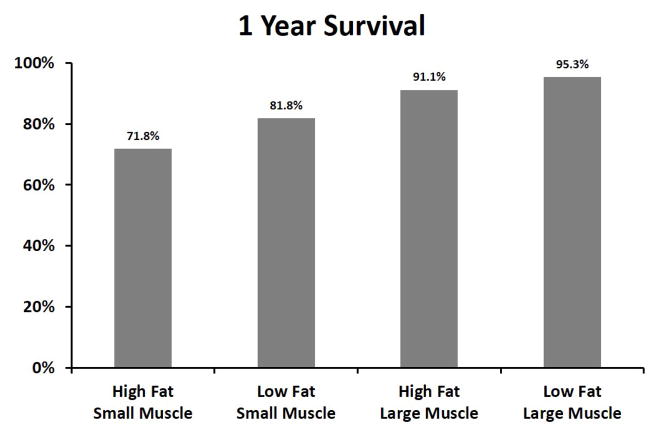
348 patients reached 1-year follow-up, with an 85.1% survival rate. Figure 4a depicts 1-year survival based on both total psoas area and visceral fat area. Among patients with larger total psoas area, the patients with high visceral fat area had 91.1% 1-year survival compared to 95.3% for those with low visceral fat area (p=0.37). Among patients with smaller total psoas area, the patients with high visceral fat area had 71.8% survival compared to 81.8% for those with low visceral fat area (p=0.15).
Figure 4.
5-Year Survival
227 patients reached 5-year follow-up, with a 58.6% survival rate. Figure 4b depicts 5-year survival based on both total psoas area and visceral fat area. Among patients with larger total psoas area, the patients with high visceral fat had 68.4% 5-year survival compared to 76.0% for those with low visceral fat area (p=0.40). Among patients with smaller total psoas area, the patients with high visceral fat area had 36.9% 5-year survival compared to 58.2% for those with low visceral fat area (p=0.023).
Discussion
With this work, we introduce a novel approach to quantifying body composition in patients undergoing liver transplantation. Utilizing perioperative cross-sectional imaging, we measured abdominal visceral fat and evaluated its association with outcomes following transplantation. The data suggests that abdominal adiposity is a significant predictor of survival after liver transplantation, especially in patients with small trunk muscle size. When coupled with trunk musculature, abdominal adiposity offers a direct characterization of body composition. The distinction between lean and non-lean body mass measurements make analytic morphomics a powerful tool for risk stratification that cannot be offered by non-distinguishing measurements such as BMI.
The assessment of obesity in the liver transplant patient has been well studied. Numerous studies suggest that obesity is not a contraindication for liver transplantation, though excess body weight may delay improvement in quality of life.(4–7) These studies stratified patients by BMI. Our study is unique in that it utilizes analytic morphomics to distinguish lean mass from adiposity and uses both measures to characterize body composition. A recent study by Cruz et al. also demonstrates the ability to measure body composition using CT scans.(8) However this study focuses on comparing body composition with other patient clinical variables, and did not find visceral adiposity to be significantly associated with survival. We report that visceral fat area is a significant predictor of survival, especially in patients with small trunk muscle size.
This study has several important limitations. First, it is a retrospective study at a single institution with a small cohort of patients. Future studies should include a larger sample size across multiple institutions. Second, there is selection bias for patient inclusion. Patients who did not receive an abdominal CT scan within 90 days of transplant were not included in the study. The patients who did receive a scan were presumably in poorer health than those who did not and thus had greater mortality risk following transplantation, though we only compared survival rates amongst patients who did receive a scan. This bias may explain the low observed 5 year survival rate (58.6%) relative to expected values, and thus our results may not be representative of the general transplant population.
Furthermore there is potential bias in utilizing data acquired from postoperative CT scans. Many of these patients seemingly received a postoperative scan for the surgeon to investigate a complicated post-transplant course and as such represent a greater mortality risk. While the patients with postoperative scans did have greater 1 year mortality (15.9% vs 11.5%, p = 0.37) and 5 year mortality (42.4% vs 37.2%, p = 0.61) compared to patients with preoperative scans, pre/postoperative scan status was not significant in survival analysis using Cox regression (p = 0.65; HR =0.88, 95CI: 0.52 – 1.51).
It is also necessary to consider whether the timing of the scans influence morphomics. Overall the patients with postoperative scans had greater visceral fat area (86.5 vs 69.9 cm2, p = 0.015) but similar TPA (19.6 vs 20.6 cm2, p = 0.21) and BMI (28.1 vs 27.9 kg/m2, p = 0.80). However, the patients with postoperative scans also had greater morbidity compared to the patients with preoperative scans, with greater prevalence of HCV (41.9% vs 25.6%, p =0.012), diabetes (31.5% vs 16.7%, p = 0.010), and smoking (25.2% vs 12.8%, p = 0.021), however the groups had similar renal function (1.32 vs 1.33 g/dL, p = 0.98) and MELD scores (18.3 vs 19.9, p = 0.11). This suggests that morphomic differences in patients with postoperative scans may be attributable to the patient’s preoperative morbidity rather than postoperative wasting or the effect of immunosuppression. Future studies that prospectively assess patients would be mandatory before making definitive conclusions.
Finally, the measurements we chose to describe body composition are only two of perhaps hundreds of other possibilities. Other measures of lean body mass, such as thigh musculature, may have increased sensitivity to patient outcomes, though our measurements were limited to the region scanned, namely the thorax and abdomen. Furthermore, we only focused on visceral adiposity of the abdomen and did not include subcutaneous fat in our assessment of body composition. The choice of abdominal visceral fat may be gender-biased as it is the classic pattern of fat accumulation for males, compared subcutaneous fat in the extremities for females. Our decision reflects the increased operative difficulty in patients with more visceral than subcutaneous fat, and limitations in capturing the skin layer in many scans in obese patients, as they were outside of the imaging window.
This study suggests the potential for objective measures of body composition to be informative for both clinicians and patients. Most importantly, the application of analytic morphomics to transplantation may help discriminate patients most likely to survive following liver transplantation. Beyond this, liver transplant candidates whose body composition correlates with poorer survival may be targets for nutritional intervention and physical therapy in an effort to optimize outcomes. Targeted therapy may also serve as a prophylactic measure against developing metabolic syndrome or new-onset diabetes following transplantation.
As NASH continues to increase as an indicator for liver transplantation, additional work is warranted to assess the role of body composition in the survival of liver transplant patients. Future studies can also aim to investigate the pathophysiological relationship between body composition and abnormal macronutrient metabolism in the context of an immunosuppressed patient. Objective measures of fat may also help expound the processes of steatosis, fibrosis and hepatic inflammation that lead to ESLD. Overall, such efforts demonstrate the broad applicability of analytic morphomics. Conceivably, the use of cross-sectional imaging to aid preoperative risk evaluation and inform transplant decision-making will become clinically relevant in the future.
Acknowledgments
Grants and Financial Support
Dr Englesbe receives funding support from NIH grant NIDDK (K08 DK0827508).
Footnotes
Disclosures
The authors have no conflicts of interest to disclose.
References
- 1.Flegal KM, Carroll MD, Kit BK, Ogden CL. Prevalence of obesity and trends in the distribution of body mass index among US adults, 1999–2010. JAMA. 2012 Feb;307(5):491–7. doi: 10.1001/jama.2012.39. [DOI] [PubMed] [Google Scholar]
- 2.Charlton MR, Burns JM, Pedersen RA, et al. Frequency and outcomes of liver transplantation for nonalcoholic steatohepatitis in the United States. Gastroenterology. 2011 Oct;141:1249–53. doi: 10.1053/j.gastro.2011.06.061. [DOI] [PubMed] [Google Scholar]
- 3.Agopian VG, Kaldas FM, Hong JC, et al. Liver transplantation for nonalcoholic steatohepatitis: the new epidemic. Ann Surg. 2012 Oct;256:624–33. doi: 10.1097/SLA.0b013e31826b4b7e. [DOI] [PubMed] [Google Scholar]
- 4.Pelletier SJ, Schaubel DE, Wei G, et al. Effect of body mass index on the survival benefit of liver transplantation. Liver Transpl. 2007 Dec;13(12):1678–83. doi: 10.1002/lt.21183. [DOI] [PubMed] [Google Scholar]
- 5.Lamattina JC, Foley DP, Fernandez LA, et al. Complications associated with liver transplantation in the obese recipient. Clin Transplant. 2012 Nov-Dec;26(6):910–8. doi: 10.1111/j.1399-0012.2012.01669.x. [DOI] [PMC free article] [PubMed] [Google Scholar]
- 6.Perez-Protto SE, Quintin C, Reynolds LF, et al. Comparable graft and patient survival in lean and obese liver transplant recipients. Liver Transpl. 2013 Aug;19(8):907–15. doi: 10.1002/lt.23680. [DOI] [PubMed] [Google Scholar]
- 7.Zayfudim V, Feurer ID, Moore DE, et al. The negative effect of pretransplant overweight and obesity on the rate of improvement in physical quality of life after liver transplantation. Surgery. 2009 Aug;146(2):174–80. doi: 10.1016/j.surg.2009.04.027. [DOI] [PubMed] [Google Scholar]
- 8.Cruz RJ, Jr, Dew MA, Myaskovsky L, et al. Objective radiologic assessment of body composition in patients with end-stage liver disease: going beyond the BMI. Transplantation. 2013 Feb;95(4):617–22. doi: 10.1097/TP.0b013e31827a0f27. [DOI] [PMC free article] [PubMed] [Google Scholar]
- 9.Englesbe MJ, Patel SP, He K, et al. Sarcopenia and mortality after liver transplantation. J Am Coll Surg. 2010 Aug;211(2):271–8. doi: 10.1016/j.jamcollsurg.2010.03.039. [DOI] [PMC free article] [PubMed] [Google Scholar]
- 10.Englesbe MJ, Lee JS, He K, et al. Analytic morphomics, core muscle size, and surgical outcomes. Ann Surg. 2012 Aug;256(2):255–61. doi: 10.1097/SLA.0b013e31826028b1. [DOI] [PubMed] [Google Scholar]
- 11.Lee JS, He K, Harbaugh CM, et al. Frailty, core muscle size, and mortality in patients undergoing open abdominal aortic aneurysm repair. J Vasc Surg. 2011 Apr;53(4):912–7. doi: 10.1016/j.jvs.2010.10.111. [DOI] [PubMed] [Google Scholar]
- 12.Lee JS, Terjimanian MN, Tishberg LM, et al. Surgical site infection and analytic morphometric assessment of body composition in patients undergoing midline laparotomy. J Am Coll Surg. 2011 Aug;213(2):236–44. doi: 10.1016/j.jamcollsurg.2011.04.008. [DOI] [PMC free article] [PubMed] [Google Scholar]


