

Abstract
Background
Imitation, which is impaired in children with Autism Spectrum Disorder (ASD) and critically depends on the integration of visual input with motor output, likely impacts both motor and social skill acquisition in children with ASD; however it is unclear what brain mechanisms contribute to this impairment. Children with ASD also exhibit what appears to be an ASD-specific bias against using visual feedback during motor learning. Does the temporal congruity of intrinsic activity, or functional connectivity, between motor and visual brain regions contribute to ASD-associated deficits in imitation, motor and social skills?
Methods
We acquired resting state functional Magnetic Resonance Imaging scans from 100, 8-12 year-old children (50 ASD). Group independent component analysis was used to estimate functional connectivity between visual and motor systems. Brain-behavior relationships were assessed by regressing functional connectivity measures with social deficit severity, imitation and gesture performance scores.
Results
We observed increased intrinsic asynchrony between visual and motor systems in children with ASD and replicated this finding in an independent sample from the Autism Brain Imaging Data Exchange. Moreover, children with more out-of-sync intrinsic visual-motor activity displayed more severe autistic traits while children with greater intrinsic visual-motor synchrony were better imitators.
Conclusions
Our twice replicated findings confirm that visual-motor functional connectivity is disrupted in ASD. Furthermore, the observed temporal incongruity between visual and motor systems, which may reflect diminished integration of visual consequences with motor output, was predictive of the severity of social deficits and may contribute to impaired social-communicative skill development in children with ASD.
Keywords: autism, imitation, functional connectivity, visual-motor integration, symptom severity, independent component analysis
Introduction
Motor deficits are prevalent in Autism Spectrum Disorder (ASD) (1). Due to the developmental nature of ASD, brain-based mechanisms for mastering motor skills may contribute to the impaired acquisition of skills crucial for normal social and communicative interaction. Imitation, which critically depends on linking visual input with motor output, is vital to the development of motor skills as well as social skills and social cognition (2). Thus, understanding the brain basis of visual-motor integration deficits may be critical for understanding heterogeneity in the social and communicative deficits at the core of ASD.
Support for the importance of visual-motor integration comes from children with ASD who exhibit a distinctly anomalous pattern of motor learning. When learning novel movements, children with ASD discount visual feedback in favor of proprioceptive feedback (3–5). This bias appears to be specific to ASD (4) and is a robust predictor of motor, imitation and social skill deficits(3–5). This reduced sensitivity to visual input is consistent with reports that children with ASD perform worse on clinical assessments of visual-motor integration (6) and struggle to incorporate visual input into movement planning (7; 8). Children with ASD also display particular difficulty with motor tasks that tax visual-motor coordination (9), including catching, which again appears to be ASD-specific(10; 11).
This under-reliance on visual feedback and over-reliance on proprioceptive feedback may be rooted in the wiring of the brain (5). Temporal congruity in evoked neural activity plays a critical role in integration (12), and accumulating evidence suggests a mechanistic link between the transient changes in brain activity induced by perceptual stimuli and the baseline of ongoing spontaneous fluctuations from which they arise (13). One method for measuring the temporal congruity of spontaneous activity in distributed brain regions is functional magnetic resonance imaging measured at rest (rs-fMRI) (14). rs-fMRI recently revealed increased intrinsic visual-motor synchrony in a chronic spinal cord injury patient, which may reflect cortical reorganization following dorsal column transection and the patient's self-reported over-reliance on visual feedback while walking (15). Does intrinsic visual-motor synchrony also relate to social skill and imitation ability in children with ASD? Functional connectivity findings in ASD have been mixed depending on the age range of participants and the regions of the brain studied (16). However, there have been consistent reports of an over-expression of localized connectivity in school-age children with ASD (17; 18) and a relative under-expression of long-range connectivity (19; 20), including connectivity between parietal/occipital and frontal cortices critical for encoding visual feedback (21; 22). Given this evidence, we hypothesized long-range visual-motor functional connectivity would be reduced in children with ASD compared to their TD peers.
Materials and Methods
Participants
The Johns Hopkins Medical Institutional Review Board approved this experiment. Written assent and written informed consent were obtained from all participants and their legal guardians.
One hundred, 8-12 year-old children participated at Kennedy Krieger Institute (KKI). 50 had high-functioning autism/Asperger's syndrome and 50 were TD children balanced for age; handedness, using the Edinburgh Handedness Inventory (23); perceptual reasoning index (PRI) from the Wechsler Intelligence Scale for Children (WISC-IV) (24); and socioeconomic status (SES), using the four factor index of social status (25) (Table 1). PRI, which reflects intelligence required to perform the tasks in this study, was used to balance groups because task-specific measures of intelligence are more appropriate than more general measures of intelligence like the Full Scale IQ (FSIQ) for children with ASD (26). If a child's FSIQ was less than 80, but his/her PRI or Verbal Comprehension Index was at least 80, he/she was still eligible.
Table 1. Demographic and behavioral information for KKI participants by group.
The mean is listed for each variable with the standard deviation in parentheses. FD, Framewise Displacement (a measure of head movement during the resting state scan); PRI, Perceptual Reasoning Index; SES, socioeconomic status; SRS, Social Responsiveness Scale. The SRS questionnaire was scored for all of the typically developing (TD) children and most of the children with autism (49 of 50). All TD children and 43 out of 50 children with autism completed the praxis exam.
| Typically Developing | Autism | |
|---|---|---|
| Gender (M/F) | 45/5 | 40/10 |
| Age (years) | 10.44 (1.23) | 10.28 (1.44) |
| Handedness | .69 (.54) | .67 (.51) |
| PRI | 110.0 (14.2) | 107.8 (14.7) |
| SES | 52.6 (8.4) | 52.5 (10.8) |
| Mean FD (mm) | .27 (.12) | .32 (.17) |
| Total Raw SRS | 18.9 (9.97) | 98.5 (26.8) |
| Imitation % Correct | 69.4 (10.1) | 48.6 (16.5) |
| Total Praxis % Correct | 72.1 (9.24) | 49.3 (15.4) |
Diagnosis
Children with ASD met DSM-IV criteria for autism or Asperger's Syndrome (27) according to the judgment of a clinician with more than 20 years of experience. Diagnoses were confirmed using the Autism Diagnostic Observation Schedule-Generic (ADOS-G) (28), the Autism Diagnostic Interview-Revised (ADI-R) (29), or both. Children with ASD were excluded if they had identifiable causes of autism or known neurological disorders, including epilepsy, based on parent responses during an initial phone screening. Children were excluded from the TD group if they had a first-degree relative with ASD or if parent responses to the Diagnostic Interview for Children and Adolescents (DICA-IV) (30) revealed a history of a developmental or psychiatric disorder, with the exception of simple phobias.
Social deficits were quantified using the Social Responsiveness Scale (SRS) questionnaire (31). The SRS probes a child's level of motivation to engage in social interactions, his/her ability to recognize emotional and interpersonal cues from other people, to interpret those cues correctly and to respond to what he/she interprets appropriately. The social deficit severity index generated from the SRS has been shown to be independent of intelligence, continuously distributed in the general population and consistent across informants (e.g., parents and teachers) (31; 32). Raw total scores range from 0 to 195 with higher scores indicating more severe social deficits.
Testing Procedure
Testing was distributed over two on-site study visits (Table 2). On average, the time between visits was 2 weeks and never exceeded 6 months.
Table 2. Testing outline.
Information from the telephone screening was reviewed by S.H.M. Each eligible child then completed two on-site study visits. On average, the time between visits was 2 weeks and never exceeded 6 months. Within a visit, the order of testing varied based on the availability of MRI facilities and behavioral testing rooms.
| Telephone Screening | Day 1 | Day 2 |
|---|---|---|
| The High-Functioning Autism Spectrum Screening Questionnaire (65) (15-20 min) | Consent/Assent | Motor skill testing: PANESS or Praxis (60 min) |
| Oral Consent | Collect completed parent/teacher rating scales | MRI scan (90 min) |
| DICA-IV (with parent) | ADOS (ASD only) (45 min) | |
| ADI-R (with parent) | IQ testing: WISC-IV (60 min)Mock MRI training (45-60 min) Motor skill testing: PANESS or Praxis (60 min) |
Gesture Examination
We assessed gesture ability using a version of the Florida Apraxia Battery modified for children (33). The battery has three domains: 1) gesture imitation, 2) gestures to verbal command (GTC), and 3) gestures involving a tool (GTU). All gestures involved movement of the upper limbs. Exams were video-recorded, and each gesture was evaluated for errors offline by two raters blind to diagnosis. 80% or greater concurrence between raters was achieved for each exam and then scores were averaged across raters. Scores reflect the percentage of gestures performed without error. Details of the modified praxis exam are described in detail elsewhere (33–35) and outlined in the supplementary material.
fMRI Acquisition and Preprocessing
Children completed a mock scan to acclimatize to the scanning environment. Scans were acquired on a Phillips 3T (Achieva, Philips Healthcare, Best, The Netherlands) using a single-shot, partially parallel (SENSE) gradient-recalled echo planar sequence (Repetition Time/Echo Time [TR/TE] = 2500/30 ms, FA = 70°, SENSE acceleration factor of 2, 3-mm axial slices with no slice gap, in-plane resolution of 3.05 × 3.15 –mm [84 × 81 voxels]) and either an eight-channel (n = 1, 162 time points; n = 70, 156 time points; n=27, 128 time points) or a thirty-two channel head coil (n = 2 [1 TD], 156 time points). An ascending slice order was used, and the first 10 seconds were discarded to allow for magnetization stabilization. T1-weighted scans (TR/TE = 8.0/3.7 ms, 1-mm isotropic voxels) were also acquired to facilitate registration to standard space. Children were instructed to relax and focus on a cross-hair while remaining as still as possible.
Preprocessing was completed using SPM8 (Wellcome Department of Imaging Neuroscience) and custom code written in Matlab (The Mathworks, Inc.). rs-fMRI scans were slice time adjusted using the slice acquired at the middle of the TR as a reference, and rigid body realignment parameters were estimated to adjust for motion. Anatomical scans were registered to the first functional volume and spatially normalized to Montreal Neurological Institute (MNI) space using SPM8′s unified segmentation-normalization algorithm. The estimated rigid body and non-linear spatial transformations were applied to the functional data, producing 2-mm isotropic voxels. Linear trends were removed, the data were spatially smoothed using a Gaussian filter (6-mm FWHM kernel), and voxel time series were variance-normalized.
No data included in subsequent analyses contained between-volume translational movements larger than 3 mm or rotational movements larger than 3 degrees. Several volumes were discarded from the beginning/end of four scans to uphold these criteria, but each participant retained at least 5 min 10 s of data. Mean framewise displacement (FD) was calculated using the realignment estimates (36), compared across groups and included as a covariate in brain-behavior models to minimize the impact of lingering motion-induced artifacts.
Independent Component Analysis (ICA)
Data were decomposed into temporally coherent networks using the Group ICA of fMRI Toolbox [GIFT v1.3i: http://icatb.sourceforge.net/](37; 38). Spatial ICA estimates maximally independent spatial source maps (SMs) in fMRI data from their linearly mixed fMRI signal time courses (TCs). We chose ICA because of its effectiveness at separating signal from noise (39) and its increased sensitivity to detect inter-individual differences (40). We performed dimension estimation on each participant's preprocessed data using an information theoretic approach (41) and chose the number of independent components (ICs) for the group to be the maximum dimension estimate across participants (55).
Each participant's preprocessed data was reduced from 124-162 timepoints using principal component analysis (PCA) to 100. We retained a large number of participant-specific principal components (PCs) to improve back-reconstruction of participant-specific SMs and TCs (38) while still reducing the computational demands of ICA. Participant-specific PCs were temporally concatenated and a second PCA reduced the aggregate data set to 55 PCs. ICA was repeated on these 55 group-level PCs 100 times in Icasso (42) using the Infomax algorithm (43) with randomized initial conditions. Icasso clustered the 5500 ICs across iterations using a group average-link hierarchical strategy, and 55 aggregate SMs were defined as the modes of the clusters. Participant-specific SMs and TCs were then generated from the aggregate IC decomposition using a method based on PCA compression and projection (37; 44).
Network Identification
We used available brain atlases to extract our visual and motor components of interest from the 55 estimated sources. The Juelich histological atlas (45) was used to define two early visual processing regions, BA 17/V1 and BA 18/V2 (46), as well as three middle stage visual processing regions in ventral occipital cortex: hOC3v, hOC4v and hOC5 (47; 48). The Type II Eve Atlas was used to define the pre- and post-central gyri (primary motor and somatosensory cortex, respectively) (49). All masks were spatially blurred using a 6-mm FWHM Gaussian filter to match the smoothness of the estimated components. We sorted components based on how well these templates predicted their SMs in a multiple linear regression model and separated components with high spatial similarity to known visual and motor regions from components with low spatial similarity to the regions of interest.
Statistical Analyses
Before calculating visual-motor synchrony, we compared visual and motor network topography across groups. Participant-specific visual and motor SMs were converted to z values so image intensities reflected the degree to which the component was present in each participant's data. Visual and motor SMs were combined in a second-level random effects analysis using a two-sample t-test in SPM8. Voxels which contributed unequally to the components across groups were identified using a liberal voxel-wise p-value of .01 and a cluster-level p value of .05 corrected for multiple comparisons (50).
We estimated visual-motor synchrony using Pearson's correlation coefficient between pairs of participant-specific motor and visual TCs (51; 52). Prior to correlation, participant-specific motor and visual TCs were despiked using 3DDespike (http://afni.nimh.nih.gov/afni) to remove lingering noise artifacts not decomposed well by ICA (53). Pairwise correlations were converted to z-scores using Fisher's transformation. We compared visual-motor synchrony across groups using two-sample t-tests and adjusted p-values using a false discovery rate correction.
Brain-Behavior Relationships
We investigated relationships between intrinsic visual-motor synchrony and three outcome measures: 1) social deficit severity using total Raw SRS score, 2) imitation ability and 3) percent correct across the GTC and GTU sections of the praxis exam. We included the third measure because we wanted to investigate whether intrinsic visual-motor synchrony was related to the more general ability to perform skilled gestures, since linking visual input with motor output is critical to acquire a wide range of motor skills. Indeed, the so-called “mirror neuron system” crucial to imitation, is embedded within a more general, fundamental visual-motor processing stream necessary to translate visual inputs into motor outputs (54). For each outcome, we constructed a multivariate linear regression model with terms for possible confounders: head motion as measured by mean FD, age, sex, SRS informant (outcome #1), and the number of image volumes used to calculate between network connectivity. To investigate group differences in the relationship between visual-motor synchrony and the outcome, we included interaction terms for each visual-motor pair and disease group. For each outcome, we constructed a model of the form , where Yi denotes the behavioral outcome for the ith child (i = 1, …, 100). Di = 1 if the ith child has ASD and Di = 0 otherwise. is the vector of visual-motor connectivity scores for the ith child. is a vector of subject-specific confounders; εi are independent, normally distributed random errors. β2–4 are vectors of varying length; by including all 6 connectivity scores along with potential confounders, we obtained estimates of the association between the synchrony of each visual-motor pair with the outcome while correcting for the effects of synchrony between the other visual-motor pairs and the confounders. After running each model with connectivity and diagnosis interaction terms, we removed non-significant interaction terms and reran each model to investigate potential main effects of functional connectivity on outcomes.
Validation
Data from the Autism Brain Imaging Data Exchange (ABIDE) were used for validation (55). To minimize variance between the datasets, we selected data from a single site that contributed a large sample and used similar imaging parameters (University of Michigan Sample 1 [UM_1]). We had previously processed these data (56) and included all male subjects from UM_1 for whom DSM-IV-TR Diagnostic Category was provided, who met our criteria for motion, and whose images were successfully registered to standard space (N = 25). We then restricted the TD sample to balance the two diagnostic groups according to Full Scale IQ, age, handedness and head movement (N = 25, Table 2). Preprocessing, group ICA and statistical analyses of the UM_1 dataset were implemented as described for the KKI data with these exceptions: 1) 170 PCs were retained for each subject because more data were acquired for UM_1 subjects; 2) ICA model order was set to be the same as for the KKI dataset (55); 3) visual and motor networks were extracted by comparing the UM_1 components to KKI visual and motor components; and 4) brain-behavior relationships were not assessed because imitation and SRS scores were not provided.
Results
Group Differences in Visual-Motor Functional Connectivity
The KKI motor and visual networks are illustrated in Figure 1A. We found the motor system to be represented by two components reflecting the separation of dorsomedial lower limb areas (“LL”) from more lateral upper limb areas (“UL”) within the pre- and post-central gyri. Distinct areas in the thalamus, putamen, premotor cortex, parietal operculum and cerebellum, which are all key regions underlying motor control and learning, were also contained within each motor component. The visual system was found to be represented by three components: “VC1” and “VC2” included early visual processing areas (BA 17 and 18), while “VC3” was mainly in the lateral occipital cortex and included higher-order visual processing areas V4, V5, and the extrastriate body area (EBA). Entering subject-specific SMs into a two-sample t-test, we found no significant group differences with respect to the spatial topography of any of the motor or visual networks.
Figure 1. Intrinsic visual-motor synchronization in the KKI sample.
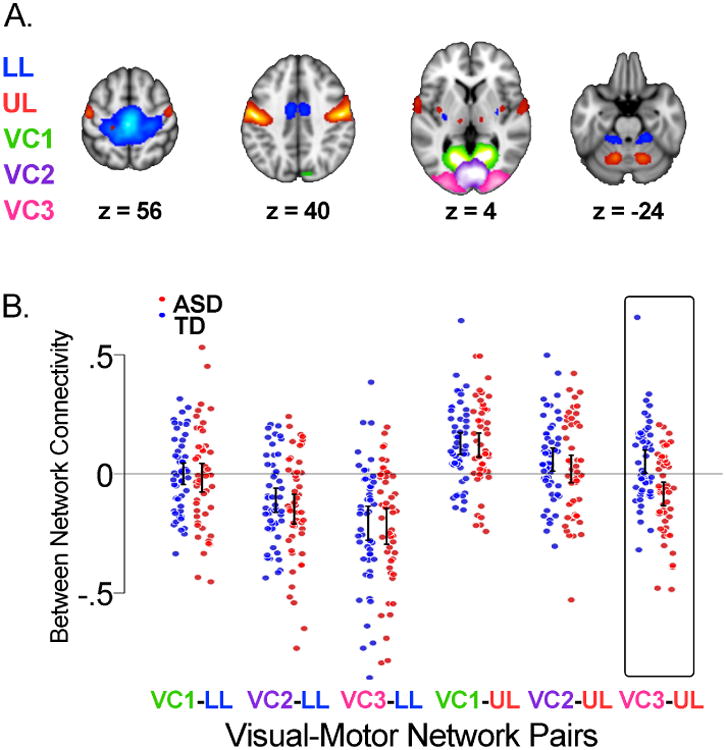
A) Topography of visual and motor networks estimated from the fMRI data using group independent component analysis (37). The motor system was represented by two components reflecting the separation of dorsomedial lower limb areas (“LL”, blue) from more lateral upper limb areas (“UL”, red) within the pre and post central gyri. The visual system was represented by three components. Two (“VC1”, green, and “VC2”, purple) were localized to early visual processing areas, while the third (“VC3”, pink) was situated mainly in the lateral occipital cortex. These maps are the result of entering participant-specific motor and visual components into one-sample t-tests. B) Dot plots and 95% confidence intervals of the intrinsic synchronization of each pair of participant-specific motor and visual networks for each group. Typically developing children (TD, N=50) are in blue; children with autism (ASD, N=50) are in red. Synchronization was calculated as the Pearson correlation between component time courses and converted to a z-score using Fisher's transform. Confidence intervals are based on comparing the mean of each group to 0. VC3-UL was the only visual-motor pair with a significant group difference in connectivity (t = 3.923, p < .001, non-overlapping confidence intervals).
Figure 1B shows dot plots of the six visual-motor connectivity scores for each KKI group; positive scores reflect greater intrinsic synchronization between networks. VC3-UL was the only visual-motor pair with a significant group difference (t = 3.923, p < .001), suggesting intrinsic activity in upper limb motor regions and higher order visual processing areas was, on average, more out-of-sync in children with ASD compared to TD children.
Validation
Figure 2A shows UM_1 motor and visual networks; Figure 2B shows dot plots of the six visual-motor connectivity scores. We found no significant group differences in the spatial topography of any of the motor or visual networks using two-sample t-tests. Similar to the KKI data, we found a group difference in visual-motor functional connectivity specific to the VC3-UL pair (t = 3.673, p = .006). Intrinsic activity in upper limb motor and higher order visual processing areas was, again, more out-of-sync in individuals with ASD compared to TD controls. Copies of all visual and motor components are available through NeuroVault (57) : http://neurovault.org/collections/PITHNIWJ/.
Figure 2. Intrinsic visual-motor synchronization in the UM_1 sample.
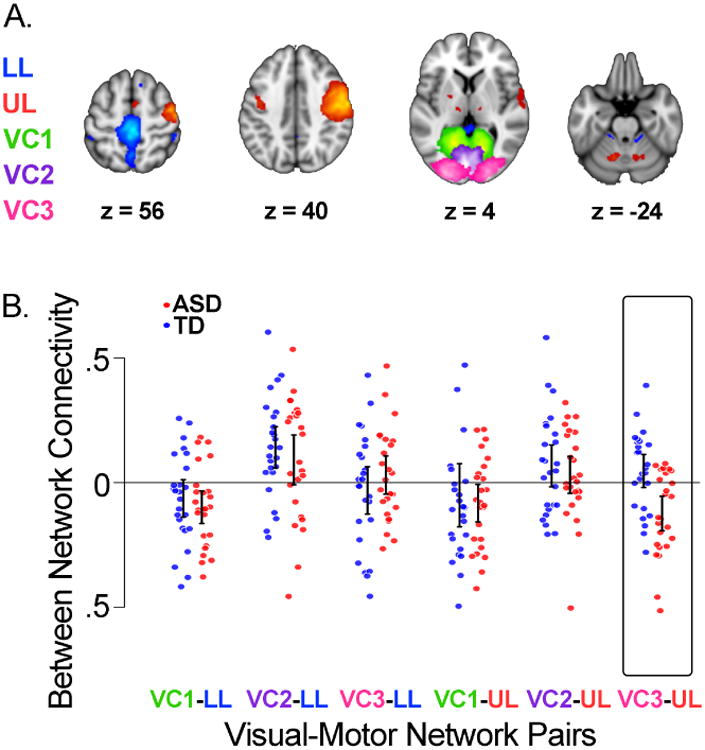
A) Topography of estimated visual and motor networks. B) Dot plots and 95% confidence intervals of the intrinsic synchronization of each pair of participant-specific motor and visual networks by group. Typically developing children (TD, N=25) are in blue; children with autism (ASD, N=25) are in red. Confidence intervals are based on comparing the mean of each group to 0. VC3-UL was the only visual-motor pair with a significant group difference in connectivity (t = 3.673, p = .006).
Brain-Behavior Relationships
We next investigated whether intrinsic visual-motor synchrony was related to ASD trait severity using a multivariate linear regression model. Out of all of the model parameters, we found a brain-behavior association specific to VC3-UL synchrony. Children with ASD who displayed more out-of-sync intrinsic activity between upper limb motor and higher order visual processing regions also demonstrated more severe social deficits; a .1 decrease in VC3-UL synchronization in the ASD group resulted in an increase in SRS by 8.227 compared with the TD group (t = -3. 01, p = 0.003, Figure 3A). Rerunning the model with non-significant diagnosis interaction terms removed, none of the other parameters besides VC3-UL connectivity were significant predictors of SRS across all children.
Figure 3. Intrinsic visual-motor synchronization as a predictor of social, imitation and overall gesture ability.
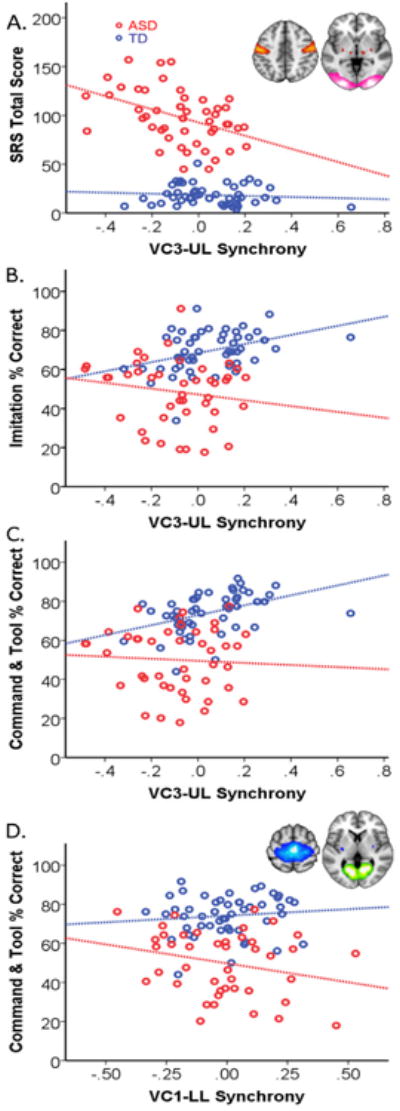
A) The Social Responsiveness Scale (SRS), a measure of social engagement in naturalistic settings, was scored for all of the typically developing (TD) children and most of the children with autism (ASD, 49 of 50). The inset shows upper limb motor and higher order visual processing areas included in the UL (red) and VC3 (pink) networks, respectively. The x axes represent the intrinsic synchronization between UL and VC3. B) Imitation ability was assessed by asking the child to mimic a series of 34 actions (performed one at a time). C) Overall gesture ability (praxis) was assessed by asking the child to perform a series of 25 gestures to verbal command and 17 gestures using a common tool in addition to the 34 imitated. All TD children and 43 out of 50 children with ASD completed the praxis exam.
We also examined whether intrinsic visual-motor synchrony was related to imitation ability. Again, we found a brain-behavior relationship specific to VC3-UL synchrony. The interaction of VC3-UL synchrony with diagnosis indicated a significant difference in the group trends depicted in Figure 3B. TD children with more synchronized intrinsic activity between upper limb motor and higher order visual processing regions were better imitators; a .1 increase in VC3-UL synchrony in the TD group resulted in an increase in the percent of gestures imitated correctly by 4.5 compared to the ASD group (t = -2.272, p =.028). Rerunning the model with non-significant diagnosis interaction terms removed, none of the other parameters besides VC3-UL connectivity were significant predictors of imitation ability across all children. According to post-hoc individual group analyses, none of the visual-motor connectivity scores were significant predictors of imitation performance within the ASD group.
Finally, we asked whether intrinsic visual-motor synchrony was related to the more general ability to perform skilled gestures, since the linking of visual input with motor output is critical to acquiring a wide range of motor skills. Similar to the imitation findings, TD children with more synchronized intrinsic activity in upper limb motor regions and higher order visual processing areas were better at performing all skilled gestures compared to ASD children (Figure 3C). After correcting for all other variables, a .1 increase in VC3-UL synchronization resulted in a 4.23 increase in the combined GTU and GTC score (t = 2.263, p = .026) in TD children compared to ASD children. We found an additional significant interaction between VC1-LL connectivity and skilled gesture performance driven by the ASD group (Figure 3D). Children with ASD who displayed more out-of-sync intrinsic activity between dorsomedial motor regions and early visual processing regions performed more skilled gestures correctly; a .1 decrease in VC1-LL synchronization in the ASD group resulted in an increase in the combined gesture score by 4.3 compared with the TD group (t = -2.421, p = 0.017). Rerunning the model with non-significant diagnosis interaction terms removed, none of the other connectivity scores were significant predictors of combined gesture ability across all children.
Discussion
We examined intrinsic functional connectivity between visual and motor brain networks in children with ASD compared to TD children. Using a data-driven approach to analyze rs-fMRI data from 100 children collected at KKI, we found intrinsic activity in motor and high-order visual areas was more anti-correlated, or out-of-sync, in children with ASD compared to their TD peers. The functional significance of this visual-motor temporal incongruity in ASD was reinforced by validation in an independent dataset and by observation of a link to clinical symptoms. Children with ASD who displayed more out-of-sync intrinsic visual-motor activity demonstrated more severe social deficits.
Visual-Motor Synchrony in ASD
Using a group ICA approach, we examined functional connectivity between visual and motor systems. Out of the six visual-motor subnetwork pairs identified, the group difference we observed in both datasets was specific to VC3-UL connectivity, and in both datasets, these networks were more out-of-sync in children with ASD. Regions of the brain unique to these two networks have previously been implicated in visual-motor integration. In addition to the hand knob of the primary motor cortex, the UL network contained subregions of the ventral premotor cortex and the parietal operculum, both of which were recently identified as important points of convergence for visual and motor information streams (58). Activity in the lateral occipital cortex, including V4 and EBA in VC3, has been shown to be modulated by action observation and is also involved in the integration of visual, spatial attention and sensory-motor signals necessary to maintain a mental estimate or model of one's own body configuration (59). During rest, the brain purportedly generates predictions about the optimal network configuration for a given impending input, and neural network simulations suggest rs-fMRI anti-correlations reflect different spatiotemporal structures of coherent networks within a larger, common anatomical skeleton (60). That we observed increased anti-correlations between intrinsic activity in visual and motor regions in children with ASD may reflect reduced integration between these networks, which is consistent with behavioral evidence children with ASD struggle with hand-eye coordination(9; 10; 61) and other tasks requiring temporal integration of visual information (62). Reduced visual-motor functional coupling is also consistent with magnetoencephalography findings associating ASD with disrupted integration between brain networks (20) and diffusion tensor imaging evidence that visual regions are structurally less efficiently connected with the rest of the brain in ASD (63).
Behavioral Consequences of Visual-Motor Synchrony
Our observation of increased visual-motor temporal incongruity in ASD is strengthened not only by replication, but also by a link to social deficits. After accounting for potential confounding effects of age, sex, and head motion, we found a brain-behavior association specific to VC3-UL connectivity; children with ASD who displayed more out-of-sync intrinsic activity between the UL network and higher order visual regions in VC3 also demonstrated more severe social deficits as measured by total SRS. This visual-motor temporal incongruity, which may reflect diminished integration of visual consequences with motor output, may contribute to impaired social-communicative skill development. This relationship also represents a possible neural correlate to motor learning data suggesting children who are less sensitive to visual feedback during motor learning also display more severe autistic traits (3; 4).
We also examined whether visual-motor functional connectivity was related to the ability to imitate gestures. Again, we found a brain-behavior association specific to VC3-UL connectivity. TD children with stronger functional connectivity between the UL network and higher order visual regions in VC3 imitated more gestures correctly. No relationship was observed between imitation ability and visual-motor connectivity in children with ASD, possibly because children with ASD rely on compensatory circuitry to imitate gestures, but are still impaired, on average, compared to TD children.
Finally, we asked whether intrinsic visual-motor synchrony was related to the more general ability to perform skilled gestures, since the so-called “mirror neuron system” crucial to imitation, is embedded within a more fundamental visual-motor processing stream necessary to translate visual inputs into motor outputs (54). We hypothesized visual-motor synchrony would not only be associated with imitation, but also more broadly with the ability to perform skilled gestures. In support of this hypothesis, we found stronger intrinsic UL-VC3 functional coupling was associated with performing more gestures correctly, whether by imitation, by command or when demonstrating how to use a tool in TD children. Unlike the imitation condition, we also observed a relationship between combined gesture ability and visual-motor connectivity in children with ASD. This association between the ability to perform skilled gestures involving the upper limbs and connectivity between more dorsomedial motor areas and a visual network is consistent with our previously reported finding that, compared to TD children, children with ASD show less functional separation within the primary motor cortex between upper and lower limb regions (64).
Our findings suggest intrinsic visual-motor synchrony is associated with the ability to imitate others' actions and may be related more generally to the association of visual consequences with motor commands critical for learning skilled movements in TD children. Furthermore, for children with ASD, reduced visual-motor synchrony, may contribute to impaired social-communicative skill development. It is unclear when this visual-motor temporal incongruity emerges in the developmental cascade of neural and behavioral abnormalities associated with ASD. Future studies characterizing the trajectory of visual-motor development in very young children are necessary to answer this outstanding question. Despite this limitation, our findings provide further support for a neural link between motor and social deficits in ASD.
Supplementary Material
Table 3. Demographic information for included UM_1 participants by group.
The mean is listed for each variable with the standard deviation in parentheses. FD, Framewise Displacement (a measure of head movement during the resting state scan); L, left handed; M, mixed handedness; R, right handed; UK, unknown handedness
| Typically Developing | Autism | |
|---|---|---|
| Gender (M/F) | 25/0 | 25/0 |
| Age (years) | 13.6 (2.74) | 13.1 (2.06) |
| Handedness (R/L/M/UK) | 19/5/0/1 | 16/5/1/3 |
| Full Scale IQ | 110.2 (8.38) | 102.8 (18.8) |
| Mean FD (mm) | .18 (.10) | .22 (.14) |
Acknowledgments
This research was supported by grants from Autism Speaks, the National Institute of Mental Health (R01 MH085328-09, and R01 MH078160-07), the National Institute of Neurological Disorders and Stroke (R01 NS048527-08) and the National Institute of Biomedical Imaging and Bioengineering (P41 EB015908 and R01 EB012547). The authors would like to thank Deana Crocetti, Benjamin Dirlikov and Daniel Peterson for their assistance with data acquisition, as well as Suresh Joel for help with ICA. Further support for the data collected at the University of Michigan and made publically available by the ABIDE was provided by the National Institute of Mental Health (R01 MH066496 and R21 MH079871), the National Institute on Child Health and Human Development (U19 HD035482), and the Michigan Institute for Clinical and Health Research.
Dr. Pekar serves as Manager of the F.M. Kirby Research Center, which receives support from Philips Health Care, which makes the MRI scanners used in this study.
Footnotes
Author Contributions: M.B.N. prepared the neuroimaging data and the manuscript; A.E. performed statistical analyses. C.N., K.A., K.S., and R.W. collected and scored the social, imitation and praxis data. A.S.C., A.D.B., J.J.P. and S.H.M. provided conceptual advice and technical support. All authors discussed the results and commented on the manuscript.
Financial Disclosures: All other authors report no biomedical financial interests or potential conflicts of interest.
Publisher's Disclaimer: This is a PDF file of an unedited manuscript that has been accepted for publication. As a service to our customers we are providing this early version of the manuscript. The manuscript will undergo copyediting, typesetting, and review of the resulting proof before it is published in its final citable form. Please note that during the production process errors may be discovered which could affect the content, and all legal disclaimers that apply to the journal pertain.
References
- 1.Lai MC, Lombardo MV, Baron-Cohen S. Autism. Lancet. 2014;383:896–910. doi: 10.1016/S0140-6736(13)61539-1. [DOI] [PubMed] [Google Scholar]
- 2.Jones V, Prior DM. Motor imitation abilities and neurological signs in autistic children. J Autism Dev Disord. 1985;15:37–46. doi: 10.1007/BF01837897. [DOI] [PubMed] [Google Scholar]
- 3.Haswell CC, Izawa J, Dowell LR, Mostofsky SH, Shadmehr R. Representation of internal models of action in the autistic brain. Nat Neurosci. 2009;12:970–972. doi: 10.1038/nn.2356. [DOI] [PMC free article] [PubMed] [Google Scholar]
- 4.Izawa J, Pekny SE, Marko MK, Haswell CC, Shadmehr R, Mostofsky SH. Motor Learning Relies on Integrated Sensory Inputs in ADHD, but Over-Selectively on Proprioception in Autism Spectrum Conditions. Autism Res. 2012;5:124–136. doi: 10.1002/aur.1222. [DOI] [PMC free article] [PubMed] [Google Scholar]
- 5.Marko MK, Crocetti D, Hulst T, Donchin O, Shadmehr R, Mostofsky SH. Behavioural and neural basis of anomalous motor learning in children with autism. Brain J Neurol. 2015;138:784–797. doi: 10.1093/brain/awu394. [DOI] [PMC free article] [PubMed] [Google Scholar]
- 6.Mayes SD, Calhoun SL. Learning, Attention, Writing, and Processing Speed in Typical Children and Children with ADHD, Autism, Anxiety, Depression, and Oppositional-Defiant Disorder. Child Neuropsychol. 2007;13:469–493. doi: 10.1080/09297040601112773. [DOI] [PubMed] [Google Scholar]
- 7.Glazebrook C, Gonzalez D, Hansen S, Elliott D. The role of vision for online control of manual aiming movements in persons with autism spectrum disorders. Autism. 2009;13:411–433. doi: 10.1177/1362361309105659. [DOI] [PubMed] [Google Scholar]
- 8.Dowd AM, McGinley JL, Taffe JR, Rinehart NJ. Do Planning and Visual Integration Difficulties Underpin Motor Dysfunction in Autism? A Kinematic Study of Young Children with Autism. J Autism Dev Disord. 2012;42:1539–1548. doi: 10.1007/s10803-011-1385-8. [DOI] [PubMed] [Google Scholar]
- 9.Crippa A, Forti S, Perego P, Molteni M. Eye-hand coordination in children with high functioning autism and Asperger's disorder using a gap-overlap paradigm. J Autism Dev Disord. 2013;43:841–850. doi: 10.1007/s10803-012-1623-8. [DOI] [PubMed] [Google Scholar]
- 10.Ament K, Mejia A, Buhlman R, Erklin S, Caffo B, Mostofsky S, Wodka E. Evidence for Specificity of Motor Impairments in Catching and Balance in Children with Autism. J Autism Dev Disord. 2014 doi: 10.1007/s10803-014-2229-0. [DOI] [PMC free article] [PubMed] [Google Scholar]
- 11.Whyatt CP, Craig CM. Motor Skills in Children Aged 7–10 Years, Diagnosed with Autism Spectrum Disorder. J Autism Dev Disord. 2012;42:1799–1809. doi: 10.1007/s10803-011-1421-8. [DOI] [PubMed] [Google Scholar]
- 12.Rodriguez E, George N, Lachaux JP, Martinerie J, Renault B, Varela FJ. Perception's shadow: long-distance synchronization of human brain activity. Nature. 1999;397:430–433. doi: 10.1038/17120. [DOI] [PubMed] [Google Scholar]
- 13.Raichle ME. Two views of brain function. Trends Cogn Sci. 2010;14:180–190. doi: 10.1016/j.tics.2010.01.008. [DOI] [PubMed] [Google Scholar]
- 14.Biswal B, Yetkin FZ, Haughton VM, Hyde JS. Functional connectivity in the motor cortex of resting human brain using echo-planar MRI. Magn Reson Med Off J Soc Magn Reson Med Soc Magn Reson Med. 1995;34:537–541. doi: 10.1002/mrm.1910340409. [DOI] [PubMed] [Google Scholar]
- 15.Choe AS, Belegu V, Smith SA, Zijl PCM van, Pekar JJ, McDonald JW. Extensive neurological recovery from a complete spinal cord injury: a case report and hypothesis on the role of cortical plasticity. Front Hum Neurosci. 2013;7:290. doi: 10.3389/fnhum.2013.00290. [DOI] [PMC free article] [PubMed] [Google Scholar]
- 16.Uddin LQ, Supekar K, Menon V. Reconceptualizing functional brain connectivity in autism from a developmental perspective. Front Hum Neurosci. 2013;7:458. doi: 10.3389/fnhum.2013.00458. [DOI] [PMC free article] [PubMed] [Google Scholar]
- 17.Keown CL, Shih P, Nair A, Peterson N, Mulvey ME, Müller RA. Local functional overconnectivity in posterior brain regions is associated with symptom severity in autism spectrum disorders. Cell Rep. 2013;5:567–572. doi: 10.1016/j.celrep.2013.10.003. [DOI] [PMC free article] [PubMed] [Google Scholar]
- 18.Uddin LQ, Supekar K, Lynch CJ, Khouzam A, Phillips J, Feinstein C, et al. Salience network-based classification and prediction of symptom severity in children with autism. JAMA Psychiatry Chic Ill. 2013;70:869–879. doi: 10.1001/jamapsychiatry.2013.104. [DOI] [PMC free article] [PubMed] [Google Scholar]
- 19.Courchesne E, Pierce K. Why the frontal cortex in autism might be talking only to itself: local over-connectivity but long-distance disconnection. Curr Opin Neurobiol, Cognitive neuroscience. 2005;15:225–230. doi: 10.1016/j.conb.2005.03.001. [DOI] [PubMed] [Google Scholar]
- 20.Ye AX, Leung RC, Schäfer CB, Taylor MJ, Doesburg SM. Atypical resting synchrony in autism spectrum disorder. Hum Brain Mapp. 2014 doi: 10.1002/hbm.22604. [DOI] [PMC free article] [PubMed] [Google Scholar]
- 21.Villalobos ME, Mizuno A, Dahl BC, Kemmotsu N, Müller RA. Reduced functional connectivity between V1 and inferior frontal cortex associated with visuomotor performance in autism. NeuroImage. 2005;25:916–925. doi: 10.1016/j.neuroimage.2004.12.022. [DOI] [PMC free article] [PubMed] [Google Scholar]
- 22.Libero LE, Maximo JO, Deshpande HD, Klinger LG, Klinger MR, Kana RK. The role of mirroring and mentalizing networks in mediating action intentions in autism. Mol Autism. 2014;5:50. doi: 10.1186/2040-2392-5-50. [DOI] [PMC free article] [PubMed] [Google Scholar]
- 23.Oldfield RC. The assessment and analysis of handedness: The Edinburgh inventory. Neuropsychologia. 1971;9:97–113. doi: 10.1016/0028-3932(71)90067-4. [DOI] [PubMed] [Google Scholar]
- 24.Wechsler D. Wechsler Intelligence Scale for Children-WISC-IV. Psychological Corporation; 2003. [Google Scholar]
- 25.Hollingshead A. Four factor index of social status. Yale University Department of Sociology; 1975. [Google Scholar]
- 26.Mottron L. Matching strategies in cognitive research with individuals with high-functioning autism: current practices, instrument biases, and recommendations. J Autism Dev Disord. 2004;34:19–27. doi: 10.1023/b:jadd.0000018070.88380.83. [DOI] [PubMed] [Google Scholar]
- 27.American Psychiatric Association. Diagnostic and statistical manual of mental disorders. 4th. Washington, D.C.: American Psychiatric Press; 1994. [Google Scholar]
- 28.Lord C, Risi S, Lambrecht L, Cook EH, Jr, Leventhal BL, DiLavore PC, et al. The autism diagnostic observation schedule-generic: a standard measure of social and communication deficits associated with the spectrum of autism. J Autism Dev Disord. 2000;30:205–223. [PubMed] [Google Scholar]
- 29.Lord C, Rutter M, Le Couteur A. Autism Diagnostic Interview-Revised: a revised version of a diagnostic interview for caregivers of individuals with possible pervasive developmental disorders. J Autism Dev Disord. 1994;24:659–685. doi: 10.1007/BF02172145. [DOI] [PubMed] [Google Scholar]
- 30.Welner Z, Reich W, Herjanic B, Jung KG, Amado H. Reliability, validity, and parent-child agreement studies of the Diagnostic Interview for Children and Adolescents (DICA) J Am Acad Child Adolesc Psychiatry. 1987;26:649–653. doi: 10.1097/00004583-198709000-00007. [DOI] [PubMed] [Google Scholar]
- 31.Constantino JN, Davis SA, Todd RD, Schindler MK, Gross MM, Brophy SL, et al. Validation of a brief quantitative measure of autistic traits: comparison of the social responsiveness scale with the autism diagnostic interview-revised. J Autism Dev Disord. 2003;33:427–433. doi: 10.1023/a:1025014929212. [DOI] [PubMed] [Google Scholar]
- 32.Constantino JN, Todd RD. Autistic traits in the general population: a twin study. Arch Gen Psychiatry. 2003;60:524–530. doi: 10.1001/archpsyc.60.5.524. [DOI] [PubMed] [Google Scholar]
- 33.Mostofsky SH, Dubey P, Jerath VK, Jansiewicz EM, Goldberg MC, Denckla MB. Developmental dyspraxia is not limited to imitation in children with autism spectrum disorders. J Int Neuropsychol Soc JINS. 2006;12:314–326. doi: 10.1017/s1355617706060437. [DOI] [PubMed] [Google Scholar]
- 34.Dziuk MA, Larson JCG, Apostu A, Mahone EM, Denckla MB, Mostofsky SH. Dyspraxia in autism: association with motor, social, and communicative deficits. Dev Med Child Neurol. 2007;49:734–739. doi: 10.1111/j.1469-8749.2007.00734.x. [DOI] [PubMed] [Google Scholar]
- 35.Dowell LR, Mahone EM, Mostofsky SH. Associations of postural knowledge and basic motor skill with dyspraxia in autism: implication for abnormalities in distributed connectivity and motor learning. Neuropsychology. 2009;23:563–570. doi: 10.1037/a0015640. [DOI] [PMC free article] [PubMed] [Google Scholar]
- 36.Power JD, Barnes KA, Snyder AZ, Schlaggar BL, Petersen SE. Spurious but systematic correlations in functional connectivity MRI networks arise from subject motion. NeuroImage. 2012;59:2142–2154. doi: 10.1016/j.neuroimage.2011.10.018. [DOI] [PMC free article] [PubMed] [Google Scholar]
- 37.Calhoun VD, Adali T, Pearlson GD, Pekar JJ. A method for making group inferences from functional MRI data using independent component analysis. Hum Brain Mapp. 2001;14:140–151. doi: 10.1002/hbm.1048. [DOI] [PMC free article] [PubMed] [Google Scholar]
- 38.Erhardt EB, Rachakonda S, Bedrick EJ, Allen EA, Adali T, Calhoun VD. Comparison of multi- subject ICA methods for analysis of fMRI data. Hum Brain Mapp. 2011;32:2075–2095. doi: 10.1002/hbm.21170. [DOI] [PMC free article] [PubMed] [Google Scholar]
- 39.De Martino F, Gentile F, Esposito F, Balsi M, Di Salle F, Goebel R, Formisano E. Classification of fMRI independent components using IC-fingerprints and support vector machine classifiers. NeuroImage. 2007;34:177–194. doi: 10.1016/j.neuroimage.2006.08.041. [DOI] [PubMed] [Google Scholar]
- 40.Koch W, Teipel S, Mueller S, Buerger K, Bokde ALW, Hampel H, et al. Effects of aging on default mode network activity in resting state fMRI: Does the method of analysis matter? NeuroImage. 2010;51:280–287. doi: 10.1016/j.neuroimage.2009.12.008. [DOI] [PubMed] [Google Scholar]
- 41.Li YO, Adali T, Calhoun VD. Estimating the number of independent components for functional magnetic resonance imaging data. Hum Brain Mapp. 2007;28:1251–1266. doi: 10.1002/hbm.20359. [DOI] [PMC free article] [PubMed] [Google Scholar]
- 42.Himberg J, Hyvärinen A, Esposito F. Validating the independent components of neuroimaging time series via clustering and visualization. NeuroImage. 2004;22:1214–1222. doi: 10.1016/j.neuroimage.2004.03.027. [DOI] [PubMed] [Google Scholar]
- 43.Bell AJ, Sejnowski TJ. An information-maximization approach to blind separation and blind deconvolution. Neural Comput. 1995;7:1129–1159. doi: 10.1162/neco.1995.7.6.1129. [DOI] [PubMed] [Google Scholar]
- 44.Calhoun VD, Adali T, Pearlson GD, Pekar JJ. A method for making group inferences from functional MRI data using independent component analysis. Hum Brain Mapp. 2002;16:131–131. doi: 10.1002/hbm.1048. [DOI] [PMC free article] [PubMed] [Google Scholar]
- 45.Eickhoff SB, Stephan KE, Mohlberg H, Grefkes C, Fink GR, Amunts K, Zilles K. A new SPM toolbox for combining probabilistic cytoarchitectonic maps and functional imaging data. NeuroImage. 2005;25:1325–1335. doi: 10.1016/j.neuroimage.2004.12.034. [DOI] [PubMed] [Google Scholar]
- 46.Amunts K, Malikovic A, Mohlberg H, Schormann T, Zilles K. Brodmann's Areas 17 and 18 Brought into Stereotaxic Space—Where and How Variable? NeuroImage. 2000;11:66–84. doi: 10.1006/nimg.1999.0516. [DOI] [PubMed] [Google Scholar]
- 47.Malikovic A, Amunts K, Schleicher A, Mohlberg H, Eickhoff SB, Wilms M, et al. Cytoarchitectonic Analysis of the Human Extrastriate Cortex in the Region of V5/MT+: A Probabilistic, Stereotaxic Map of Area hOc5. Cereb Cortex. 2007;17:562–574. doi: 10.1093/cercor/bhj181. [DOI] [PubMed] [Google Scholar]
- 48.Rottschy C, Eickhoff SB, Schleicher A, Mohlberg H, Kujovic M, Zilles K, Amunts K. Ventral visual cortex in humans: Cytoarchitectonic mapping of two extrastriate areas. Hum Brain Mapp. 2007;28:1045–1059. doi: 10.1002/hbm.20348. [DOI] [PMC free article] [PubMed] [Google Scholar]
- 49.Oishi K, Faria A, Jiang H, Li X, Akhter K, Zhang J, et al. Atlas-based whole brain white matter analysis using large deformation diffeomorphic metric mapping: application to normal elderly and Alzheimer's disease participants. NeuroImage. 2009;46:486–499. doi: 10.1016/j.neuroimage.2009.01.002. [DOI] [PMC free article] [PubMed] [Google Scholar]
- 50.Worsley KJ, Marrett AS, Neelin P, Vandal AC, Friston KJ, Evans AC. A unified statistical approach for determining significant signals in images of cerebral activation. Hum Brain Mapp. 1996;4:58–73. doi: 10.1002/(SICI)1097-0193(1996)4:1<58::AID-HBM4>3.0.CO;2-O. [DOI] [PubMed] [Google Scholar]
- 51.Jafri MJ, Pearlson GD, Stevens M, Calhoun VD. A method for functional network connectivity among spatially independent resting-state components in schizophrenia. NeuroImage. 2008;39:1666–1681. doi: 10.1016/j.neuroimage.2007.11.001. [DOI] [PMC free article] [PubMed] [Google Scholar]
- 52.Joel SE, Caffo BS, van Zijl PCM, Pekar JJ. On the relationship between seed-based and ICA-based measures of functional connectivity. Magn Reson Med. 2011;66:644–657. doi: 10.1002/mrm.22818. [DOI] [PMC free article] [PubMed] [Google Scholar]
- 53.Allen EA, Erhardt EB, Damaraju E, Gruner W, Segall JM, Silva RF, et al. A baseline for the multivariate comparison of resting-state networks. Front Syst Neurosci. 2011;5:2. doi: 10.3389/fnsys.2011.00002. [DOI] [PMC free article] [PubMed] [Google Scholar]
- 54.Cisek P, Kalaska JF. Neural mechanisms for interacting with a world full of action choices. Annu Rev Neurosci. 2010;33:269–298. doi: 10.1146/annurev.neuro.051508.135409. [DOI] [PubMed] [Google Scholar]
- 55.Di Martino A, Yan CG, Li Q, Denio E, Castellanos FX, Alaerts K, et al. The autism brain imaging data exchange: towards a large-scale evaluation of the intrinsic brain architecture in autism. Mol Psychiatry. 2014;19:659–667. doi: 10.1038/mp.2013.78. [DOI] [PMC free article] [PubMed] [Google Scholar]
- 56.Nebel MB, Eloyan A, Barber AD, Mostofsky SH. Precentral gyrus functional connectivity signatures of autism. Front Syst Neurosci. 2014;8:80. doi: 10.3389/fnsys.2014.00080. [DOI] [PMC free article] [PubMed] [Google Scholar]
- 57.Gorgolewski KJ, Varoquaux G, Rivera G, Schwartz Y, Sochat VV, Ghosh SS, et al. A repository for sharing unthresholded statistical maps, parcellations, and atlases of the human brain. NeuroImage. doi: 10.1016/j.neuroimage.2015.04.016. (n.d.).: NeuroVault.org. [DOI] [PMC free article] [PubMed]
- 58.Sepulcre J. Integration of visual and motor functional streams in the human brain. Neurosci Lett. 2014;567:68–73. doi: 10.1016/j.neulet.2014.03.050. [DOI] [PubMed] [Google Scholar]
- 59.Astafiev SV, Stanley CM, Shulman GL, Corbetta M. Extrastriate body area in human occipital cortex responds to the performance of motor actions. Nat Neurosci. 2004;7:542–548. doi: 10.1038/nn1241. [DOI] [PubMed] [Google Scholar]
- 60.Deco G, Jirsa VK, McIntosh AR. Emerging concepts for the dynamical organization of resting-state activity in the brain. Nat Rev Neurosci. 2011;12:43–56. doi: 10.1038/nrn2961. [DOI] [PubMed] [Google Scholar]
- 61.Whyatt C, Craig C. Sensory-motor problems in Autism. Front Integr Neurosci. 2013;7:51. doi: 10.3389/fnint.2013.00051. [DOI] [PMC free article] [PubMed] [Google Scholar]
- 62.Nakano T, Ota H, Kato N, Kitazawa S. Deficit in visual temporal integration in autism spectrum disorders. Proc R Soc B Biol Sci. 2010;277:1027–1030. doi: 10.1098/rspb.2009.1713. [DOI] [PMC free article] [PubMed] [Google Scholar]
- 63.Lewis JD, Evans AC, Pruett JR, Botteron K, Zwaigenbaum L, Estes A, et al. Network inefficiencies in autism spectrum disorder at 24 months. Transl Psychiatry. 2014;4:e388. doi: 10.1038/tp.2014.24. [DOI] [PMC free article] [PubMed] [Google Scholar]
- 64.Nebel MB, Joel SE, Muschelli J, Barber AD, Caffo BS, Pekar JJ, Mostofsky SH. Disruption of functional organization within the primary motor cortex in children with autism. Hum Brain Mapp. 2014;35:567–580. doi: 10.1002/hbm.22188. [DOI] [PMC free article] [PubMed] [Google Scholar]
- 65.Ehlers S, Gillberg C, Wing L. A Screening Questionnaire for Asperger Syndrome and Other High-Functioning Autism Spectrum Disorders in School Age Children. J Autism Dev Disord. 1999;29:129–141. doi: 10.1023/a:1023040610384. [DOI] [PubMed] [Google Scholar]
Associated Data
This section collects any data citations, data availability statements, or supplementary materials included in this article.