Abstract
Nanoparticles with combined diagnostic and therapeutic functions are promising tools for cancer diagnosis and treatment. Here, we demonstrate a theranostic nanoparticle that integrates an active gemcitabine metabolite and a gadolinium-based magnetic resonance imaging agent via a facile supramolecular self-assembly synthesis, where the anti-cancer drug gemcitabine-5′-monophosphate (a phosphorylated active metabolite of the anti-cancer drug gemcitabine) was used to coordinate with Gd(III) to self-assemble into theranostic nanoparticles. The formulation exhibits a strong T1 contrast signal for magnetic resonance imaging of tumors in vivo, with enhanced retention time. Furthermore, the nanoparticles did not require other inert nanocarriers or excipients and thus had an exceptionally high drug loading (55 wt%), resulting in the inhibition of MDA-MB-231 tumor growth in mice.
Keywords: Supramolecular nanoparticle, Gemcitabine monophosphate, Drug delivery, Cancer theranostics, Magnetic resonance imaging
Graphical abstract
1. Introduction
Nanoparticles can deliver a wide range of therapeutics and can improve drug circulation times, enhance therapeutic efficacy, and minimize systemic side effects, in many diseases [1–3]. In cancer, the leakiness of the tumor vasculature can enhance nanoparticle accumulation in tumors (the enhanced permeability and retention [EPR] effect) [4–6]. However, the efficacy of therapeutic nanoparticles is highly variable in humans, perhaps due to variability in the EPR effect [7,8]. The ability to image nanoparticle accumulation in tumors of individual patients could enable prediction of therapeutic efficacy [7], including optimization of dosing schedules by real-time tracking of pharmacokinetics. Conversely, accumulation in off-target tissues is also variable; the ability to image biodistribution could help predict toxicity [8], which could be especially important in therapies where toxicity is dose-limiting. This monitoring of efficacy, and distribution of particles within and without tumors could in principle allow for adjustement of a regimen to the patient's specific (“personalized”) needs. Nanotheranostic devices are potentially useful for both clinical and research purposes (e.g. assessing the effectiveness of a targeting strategy).
To address these issues “theranostic” nanoparticles have been developed, which combine therapeutic and diagnostic functionalities in a single formulation [8–14]. Theranostic agents are still at an early stage of development. Since for many of the advantages attributed to nanotheranostics, it is important that the therapeutic and diagnostic agents be co-localized, the design of theranostic nanoparticles focuses on the co-encapsulation or surface attachment of therapeutic compounds and diagnostic agents in nanosized carriers, such as liposomes, polymeric nanoparticles, and inorganic nanomaterials (e.g., quantum dots, iron oxide nanoparticles) [8–15]. These strategies usually require complex and costly preparation of nanoparticles through multiple steps. In addition, since inert excipients account for the majority of the mass of the nanocarriers, the loading of the diagnostic and therapeutic agents is rather low (typically less than 10 wt%) [16–18]. Developing simple and efficient synthetic strategies for the construction of nanotheranostics with high drug loading remains a challenge.
Magnetic resonance imaging (MRI) is a powerful diagnostic tool with high spatial resolution in soft tissue (e.g. cancer) imaging [19]. Small-molecule paramagnetic agents, especially Gd(III) compounds, are often used to improve the contrast of tissues, which enhance the T1-weighted MRI contrast by increasing the longitudinal relaxation rate (R1 = 1/T1) of water protons [19]. Nevertheless, tumor imaging using such clinically available low molecular weight Gd(III) contrast complexes is often limited by their limited accumulation in and rapid clearance from tumors, leading to inadequate MRI sensitivity and specificity [20]. (It bears mentioning, however, that the rate of efflux of contrast agents from tumors can also be of use in differentiating between benign and malignant tumors [21]. In that respect, and others, the design of formulations for tumor diagnosis may differ from that for tracking therapeutic agents.) The integration of Gd(III) complexes with nanoparticles, such as inorganic nanoparticles [22,23], polymeric nanoparticles [24–26], liposomes [27], and lipid nanoparticles [28,29], has the potential to improve the accumulation of contrast agents due to the EPR effect, and thus to enhance the signal intensities for tumor imaging. Theranostic nanoparticles have been developed that combine a cancer therapeutic (e.g., gemcitabine), with Gd(III) based MRI contrast agents [30,31]. However, these systems have relatively low loading of MRI imaging agents and/or drugs. For example, the loading of gemcitabine is reported as less than 10 wt% in liposomes that also contained Gd [30]. Additionally the imaging capabilities and antitumor efficacy of many such Gd-based theranostic nanoparticles have not been studied in vivo [30,31].
Here we report nanoparticles for combined cancer therapy and MRI (both of tumor and particle location), formed by supramolecular self-assembly to have a high loading of active agents to address such problems (Fig. 1). (Supramolecular self-assembly implies that molecular building blocks undergo spontaneously assembly through noncovalent interactions [32,33].) In our design, the anti-cancer drug gemcitabine-5′-monophosphate (GMP, see Fig. 1 for the structure), a phosphorylated active metabolite of the anti-cancer drug gemcitabine [34,35], was used as a bidentate molecular building block that could coordinate with (chelate) Gd(III) to self-assemble into nanoparticles (SNPs). Gd(III) was selected because of its coordination flexibility and its use as an MRI contrast agent [19]. The efficiency of nanoparticle accumulation in tumors is highly dependent on their blood circulation time: the longer the circulation time, the higher the tumor uptake [5,6]. Consequently, to enhance the circulation of SNPs in the blood, the particle surface was PEGylated with methoxy-PEG (molecular weight ∼2 kDa) bearing two phosphate groups at one terminus (PEG-DiP, see Fig. 1 for the structure) that could coordinate with Gd(III) [36]. SNPs did not require other inert nanocarriers or excipients and thus had an exceptionally high drug loading, which has not been achieved in other systems. We applied the SNPs for imaging and cancer therapy in a breast cancer xenograft model using the MDA-MB-231 cell line, which is sensitive to gemcitabine [34].
Fig. 1.
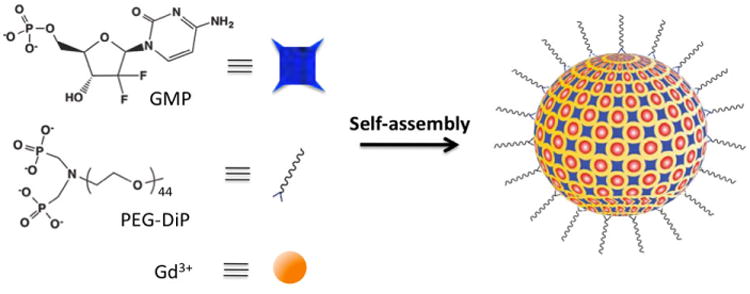
Schematic illustration of the one-step self-assembly of a small-molecule anticancer drug with Gd(III) into a Gd supramolecular nanoparticle (SNP).
2. Materials and methods
2.1. Materials
All of the chemicals used were of analytical grade and were used without further purification. GdCl3•6H2O were purchased from Sigma-Aldrich (St. Louis, MO). Gemcitabine-5′-monophosphate disodium salt were from HDH Pharma (Morrisville, NC) and stored at -20 °C in a freezer prior to use. PEG-DiP was purchased from Beijing Oneder Hightech (Beijing, China). Gemcitabine•HCl was purchased from LC Laboratories (Woburn, MA).
2.2. Preparation of SNPs
GdCl3•6H2O solution (500 μL, 3.7 mg/mL in HEPES buffer solution (100 mM, pH 7.4)) was mixed with gemcitabine-5′-monophosphate disodium salt (500 μL, 4.0 mg/mL in deionized water). PEG-DiP (50 μL, 10.0 mg/mL in deionized water) was added and the resulting mixture solution was sonicated for 2 minutes using a bath sonicator and then shaken at room temperature for 3 h. The resulting SNPs were collected after ultrafiltration and filtered through a 0.22 μm membrane filter to remove large aggregates.
2.3. Characterization
TEM images were taken on a JEOL 2100 advanced high performance microscope with an accelerating voltage of 200 kV. Dynamic light scattering (DLS) experiments were carried out on a ZetaPALS detector (15 mW laser, incident beam = 676 nm, Brookhaven Instruments, Holtsville, NY). Fourier-transform infrared spectra (FTIR) spectra were recorded on a Bruker TENSOR-27 FTIR spectrophotometer. HPLC analysis was performed on a Hewlett Packard/Agilent series 1100 (Agilent, Santa Clara, CA, USA) equipped with an analytical C18 reverse phase column. The concentration of Gd in different systems was determined with a Perkin Elmer 6100 ICP-MS (Norwalk, CT). All MR imaging measurements were performed with a Siemens Magnetom Trio with a 7T magnet field (Erlangen, Germany).
2.4. Magnetic relaxivity measurement
200 μL SNPs or Gd-DTPA with different Gd(III) concentrations was transferred into tubes for longitudinal magnetic relaxivity measurements. T1-weighted MR images were acquired on 7T MRI Varian using a fast spin-echo multi-slice sequence (FSEMS). The parameters were set as follows: 256 × 256 data matrix; 45 × 45 mm field of view; 10 slices; a slice thickness of 0.5 mm; repetition time (TE) = 8.92 ms, echo time (TR) = 5000 ms, and eight inversion recovery times (TI) = 400, 800, 1200, 1600, 2000, 2400, 2800, and 3200 ms. The mean MR signal intensity for each tube was measured over the defined region of interest (ROI). The following standard inversion-recovery formula was used to calculate T1 values of each tube: S(TI) = S0 × (1– 2e−TI/T1) to fit the T1 recovery curve, where S(TI) is the signal measured at a certain TI and S0 is the signal that would be available at full longitudinal magnetization. The resulting mean T1 values over the region of interest were plotted as 1/T1 (R1) vs molar concentration of Gd(III). The molar relaxivity r1 was calculated from the slope of the plotted line
2.5. Cytotoxicity assay
MDA-MB-231 cells were grown in 96-well plates in DMEM medium (Invitrogen, Carlsbad, CA), supplemented with 100 units/mL aqueous penicillin G, 100 μg/mL streptomycin, and 10% FBS at concentrations to allow 70% confluence in 24 h (i.e., 10,000 cells per cm2). On the day of experiments, cells were washed with pre-warmed PBS and incubated with pre-warmed DMEM medium contain SNPs or GMP drugs for 72 h at 37°C. The cytotoxicity was determined by standard MTT assay protocols.
2.6. The MDA-MB-231 tumor model and in vivo MR imaging
Immuno-deficient 6-8 week nu/nu nude female mice were purchased from Charles River Laboratories (Wilmington, MA, USA) and maintained under pathogen-free conditions for all animal studies. The study protocol was reviewed and approved by the MIT Committee on Animal Care. For subcutaneous MDA-MB-231 tumor models, MDA-MB-231 cells were injected in the dorsal aspect of the neck with 1 × 10⁶ cells/100 μL in 1:1 (v/v) PBS and Matrigel (BD Biosciences, Franklin Lake, NJ). Mice with ∼ 200-400 mm3 tumors were used in subsequent imaging experiments. The T1-weighted MR images were acquired in a 7T MRI scanner at designated time points postinjection. The detailed imaging parameters were set as follows: TR/TE 900/10.17ms, 2 averages; 256 × 256 data matrix; 45 × 45 mm field of view; 10 slices; a slice thickness of 0.5 mm, no gap between slices. Mice were anesthetized with isoflurane and imaged at specified time intervals post-injection.
2.7. MDA-MB-231 tumor growth inhibition studies
Animals with tumors that reached ∼100 mm3 were injected by tail-vein with a total volume of 200 μL of test solutions. The body weight and tumor size were measured every 2-3 days. Tumor length and width were measure with calipers, and the tumor volume was calculated using the following equation: tumor volume = length × width × width / 2.
2.8. In vivo toxicity studies
At day 14, mouse blood (∼1mL) was collected by intracardiac puncture under deep anesthesia with isoflurane at time of sacrifice. Blood was immediately separated into Microvette® capillary blood collection tubes (∼0.1 mL, Sarstedt) for complete blood count tests (red blood cell, white blood cell, hematocrit, platelet, red blood cell indices and manual white blood cell diffential with red blood cell morphology evaluation), and Microtainer® serum separator tubes (∼0.8 mL, BD bioscience) for blood chemistry tests. The tubes were then gently inverted 8-10 times and analyzed by the MIT pathology lab. Organs (heart, liver, spleen, lung, kidney) of mice in different treatment groups were fixed and sectioned for H&E staining. At different day post-injection, mice were euthanized and organs were immediately collected for ICP-MS analysis (Trace Metals Laboratory, Harvard University).
2.9. Statistical analysis
In vitro data were described with means and standard deviations and compared with T-tests. In vivo data were presented as median ± quartiles and differences between groups were assessed with Mann-Whitney U-tests. All data analyses were performed using Origin 8 software (Northampton, MA).
3. Results and discussion
3.1. Synthesis and characterization of the SNPs
SNPs were prepared by spontaneous self-assembly of GMP, Gd(III), and mPEG-DiP combined in a mole ratio of 1:1:0.05 in HEPES buffer solution (100 mM, pH 7.4). Transmission electron microscope (TEM) images of SNPs showed well-dispersed nanoparticles (Fig. 2a) with a mean diameter of 50 nm by dynamic light scattering (DLS) (Fig. 2b). Elemental analysis by energy-dispersive X-ray spectroscopy (EDX) confirmed the presence of fluorine and phosphorus (from GMP) and Gd in SNPs (Fig. S1). EDX elemental mapping images (Fig. 2c) obtained from high angle annular dark field (HAADF) scanning transmission electron microscopy (STEM) showed that the distribution of the Gd and P (and therefore of the Gd(III) and GMP) in the SNPs was uniform. SNPs remained monodisperse without obvious aggregation in human serum buffer (human serum : saline = 1:1, v/v, pH 7.4) (Fig. S2; compare to Fig. 2a). The assembly of SNPs through coordination interactions among Gd(III) and GMP molecules was investigated by Fourier transform infrared (FTIR) spectroscopy (Fig. S3). The bands at 1045 and 970 cm−1, which were attributed to the characteristic antisymmetric and symmetric stretching vibrations of the phosphate group in GMP, were shifted to a slightly higher wavelength upon addition of Gd(III) and the consequent formation of nanoparticles, indicating that the phosphate group was involved in the coordination bonds [37]. After the formation of nanoparticles, the band at 1494 cm−1, attributed to the C4–N3 stretching vibration in the cytosine moiety of the GMP molecule, was shifted to a lower wavelength, suggesting it was coordinated with Gd(III) [37]. When gemcitabine molecules were used instead of GMP, nanoparticles were not formed, further suggesting that the phosphate group in GMP played an important chelation role in the self-assembly of SNPs. Such chelation interactions not only reduce the toxicity of Gd(III), but also reduce its relaxivity by slowing the rate of water exchange of Gd(III) relative to that of the free ion [19]. The loadings of GMP and Gd(III) in the SNPs were 55 wt% and 27 wt%, respectively, as determined by HPLC and inductively coupled plasma mass spectrometry (ICP-MS). Thus, the loading of PEG-DiP was estimated to be 18 wt%. The loading efficiencies of GMP and Gd(III) were 84% and 88%, respectively. GMP and Gd(III) had very similar release rates (Fig. S4); approximately 80% of GMP and 72% of Gd (III) were released from SNPs in 48 h.
Fig. 2.
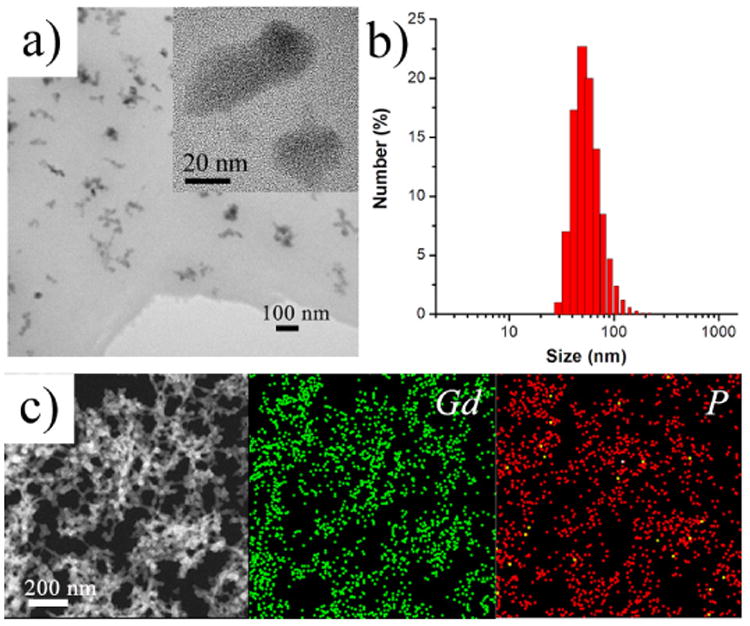
Structural and compositional characterization of SNPs. a) TEM image (Inset: high resolution image) and b) size distribution of SNPs. c) HAADF-STEM image of SNPs and corresponding EDX elemental maps (Gd (green) and P (red)).
3.2. Relaxivity measurement in vitro and MRI in vivo
We measured the T1-weighted MRI signals of aqueous Gd SNPs with a 7T (127.5 MHz) MRI scanner. T1-weighted MR images (Fig. 3a) showed that the T1-weighted MRI signal intensity increased continuously with increasing concentration of SNPs, and was greater than that of Gd-DTPA (Magnevist®) at all Gd concentrations. The molar relaxivity (r1) of aqueous SNP, an important parameter that determines the efficiency of a MRI contrast agent, determined by calculating the slope of the line relating the Gd(III) concentration to the longitudinal relaxation rate (1/T1) of water protons (Fig. 3b), was 8.3 mM−1·s−1, 1.9-fold higher than that of Gd-DTPA. The higher r1 of SNP may result from the reduction of molecular tumbling rates and the additive effect of the Gd(III) paramagnetic centers in the confined space of nanoparticles, which has been reported by others [38,39].
Fig. 3.
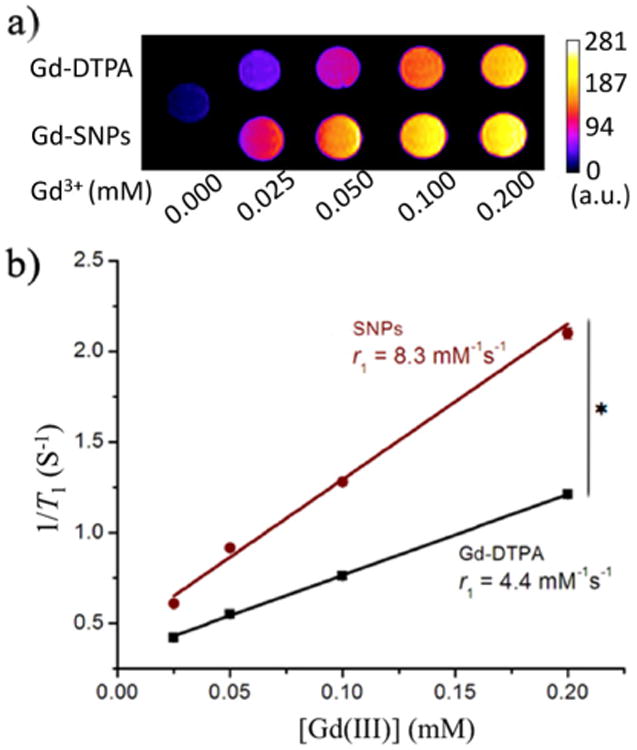
T1-weighted MRI signals of SNPs in aqueous solution. a) Color-coded (by signal intensity) T1-weighted MR images of tubes containing SNPs or Gd-DTPA at different Gd(III) concentrations. b) Plot of longitudinal relaxation rate (1/T1) as a function of Gd(III)-concentration in SNPs and Gd-DTPA. The slope indicates the molar relaxivity (r1). Data are means ± SD (N=4). Asterisks indicate P < 0.01 at all points comparing SNP and Gd-DTPA at the same Gd(III) concentration.
To examine the MRI performance of SNPs in vivo, T1-weighted MR images were acquired on nude mice bearing subcutaneous human breast cancer (MDA-MB-231) tumors before intravenous injection and at different time points afterwards of Gd-DTPA or SNPs (0.1 mmol/kg Gd(III) [40]). The SNPs were delivered systemically to emulate clinical practice, where the location of tumors is often not known, or where site selective therapy may not be possible. In theory, site-selective treatments such as intra-arterial injection into tumor feeder vessels via interventional radiology techniques could further enhance intratumoral accumulation of nanoparticles and minimize the fraction ending up in the reticuloendothelial system.
Gd-DTPA did not enhance the contrast of the tumor region 1 h post-injection (Fig. S5; the 1 h time point was selected because Gd-DTPA is cleared from tumors and blood, with half-lives • 2 hours [41]). In contrast, a significant contrast enhancement of T1-weighted MR signal intensity was seen in the tumor after injection compared with the pre-injection state: 1.27-fold at 1 h, 1.47-fold at 4 h and the enhancement remained at 1.21-fold 24 h post-injection (Fig. 4). This in vivo MR imaging efficacy is comparable with that of other Gd-based nanoparticles reported recently [26,36].
Fig. 4.
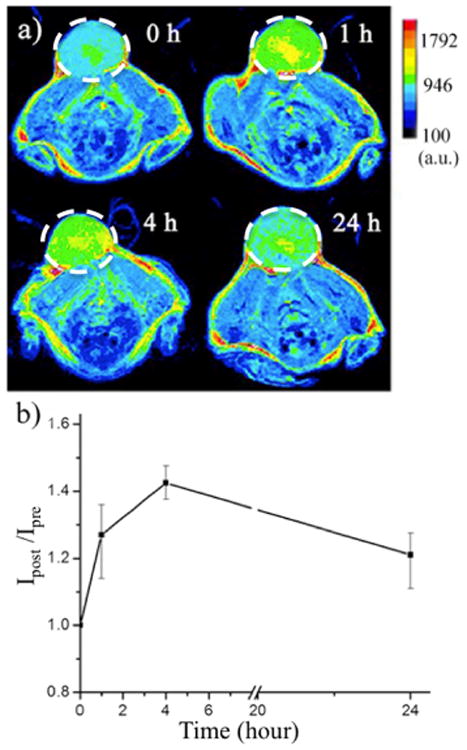
MRI of MDA-MB-231 tumor in vivo. a) In vivo T1-weighted MR images (color-coded by intensity) acquired before and at different time points after i.v. injection of SNPs in MDA-MB-231 tumor-bearing mice. Tumors are indicated by white dashed circles. b) Enhancement of the MRI signal intensity of the tumor sites after injection of SNPs (derived from the quantification of the data in panel (a)). (Ipre = intensity at time = 0, before injection, Ipost = intensity at time points thereafter. Data are medians ± quartiles (N=5).
3.3. Tumor growth inhibition
In vitro testing of the cytotoxicity of GMP and SNPs to MDA-MB-231 cancer cells by the MTT assay (Fig. S6) showed a concentration-dependent reduction in cell viability after 72 h incubation. SNP toxicity was comparable to that from free GMP, although SNPs were slightly less cytotoxic at the highest concentration. The in vivo anticancer efficacy (Fig. 5) of SNPs was investigated in MDA-MB-231 tumor xenografts in female nude mice (nu/nu) by measuring the tumor sizes at time intervals after intravenous injection of free drug and drug-loaded SNPs (GMP dose: 50 mg/kg). Mice treated with saline as the control group exhibited rapid tumor growth, with a median tumor volume of 695 mm3 (tumor diameter ∼ 11 mm) at day 28 (Fig. 5a). Mice treated with free drug showed delayed tumor growth, with a median tumor volume of 394 mm3 at day 28. SNPs at the equivalent GMP dose significantly delayed tumor growth, with a median tumor volume of 188 mm3 at day 28. The tumor growth delay with SNP was also reflected in the lower tumor tissue weight at day 28 (Fig. 5b, S7). SNPs were much more effective at inhibiting tumor growth than was GMP solution, with tumor growth inhibition as high as 72% (compared to 43% for GMP). The body weights of the mice did not change during any course of treatment (Fig. S8).
Fig. 5.
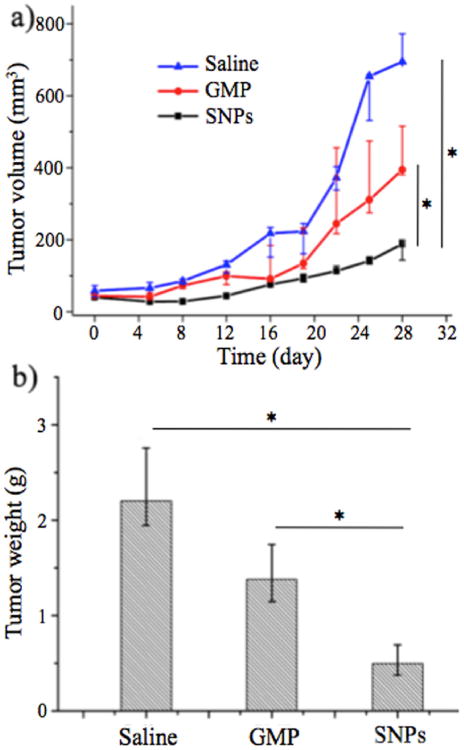
Anti-cancer efficacy of i.v.-injected formulations in animals with subcutaneous MDA-MB-231 tumors. a) Effect of treatment on tumor volume. Groups with GMP contained 50 mg/kg. (b) Final weights of tumor tissues 28 days after i.v. injection. Data are medians ± quartiles (N=5). Asterisks indicate P < 0.05.
3.4. In vivo toxicities
Healthy female nude mice (nu/nu) injected with a single intravenous dose of SNPs (50 mg/kg GMP) were euthanized after 14 days and the major organs were processed into hematoxylin and eosin (H&E) stained sections. Tissue histology was indistinguishable from that of animals administered PBS instead of SNP (Fig. S9). Blood chemistries and cell counts obtained at the same time point suggested that SNPs were benign in vivo (see Table S1 for data and discussion). Study of the Gd content of the organs, as determined by ICP-MS, indicated that most of the Gd(III) accumulated in the liver and spleen (Fig. S10). There was no detectable Gd signal left in any organs 120 days post-injection, indicating that SNPs can be cleared completely.
4. Conclusion
We have demonstrated a novel nanoparticle for cancer imaging and therapy in vivo, based on one-step supramolecular self-assembly of GMP, an active metabolite of gemcitabine, and Gd(III) ion through coordination-driven interactions. The SNPs feature a drug-loading capacity which is much higher than those in many previously reported drug delivery systems [30,31]. Our SNP system will likely be limited to drugs or prodrugs with phosphate groups that can chelate Gd(III) (e.g., etoposide phosphate (ETOPOPHOS®)). Furthermore, the SNPs were better T1 contrast agents than the clinically used Gd-DTPA in vitro and in vivo, having better molar relaxivity and prolonged retention in tumor. Finally, they exhibited enhanced in vivo antitumor activity compared to free drug in a breast cancer xenograft mouse model.
Supplementary Material
Figure S1. EDX characterization of the SNPs.
Figure S2. TEM images of the SNPs in human serum buffer (human serum : saline = 1:1, v/v, pH 7.4).
Figure S3. FTIR spectra of GMP before and after the formation of NPs with Gd(III). The dotted lines show the shift of the corresponding peaks. νx represent the vibration of a specific bond.
Figure S4. Cumulative release of GMP and GdIII) from SNPs in saline. Data are means ± SD, N = 4.
Figure S5. MRI signal intensity at the tumor sites before and 1 h after i.v. injection of Gd-DTPA. Data are medians ± quartiles; N = 5. Ipost/Ipre: The ratio of T1-weighted MR signal intensity in the tumor 1h after injection compared with that pre-injection.
Figure S6. Cytotoxicity of SNP and an equal concentration of gemcitabine-5′-monophosphate (GMP) to MDA-MB-231 cancer cells after 72 h. Data are means ± SD; N = 4, * = P< 0.01.
Figure S7. Images of tumor tissues 28 day post-injection of various treatments.
Figure S8. Body-weight of mice injected with (a) SNPs, (b) GMP and (c) saline (drug dose: 50 mg/kg). Data are medians ± quartiles; N = 5. t = 0 is the time when the tumors reached 100 mm3 and intravenous injections were administered.
Figure S9. Representative histological images of organs from animals receiving different treatments. Hematoxylin and eosin stained sections of tissues of mice treated with SNPs (GMP dose: 50 mg/kg) 14 days after i.v. injection. Scale bar: 100 μm.
Figure S10. Distribution of Gd at different time post-injection of SNPs (GMP dose: 50 mg/kg; Gd dose: 25 mg/kg). Data are medians ± quartiles; N = 5. Asterisks indicate P < 0.005 in the comparison between the data at days 1 and 120.
Table S1. Blood chemistry in mice 14 days after intravenous injection of PBS or SNPs (drug dose: 50 mg/kg). Data are presented in mean (standard deviation), N=4. The normal data range for 8-10 week nu/nu female mice (the same strain, age and gender as used in our experiments) was provided by Charles River (see http://www.criver.com/files/pdfs/rms/nunu/rm_rm_r_nunu_mouse_clinical_pathology_data.aspx).
Statement of Significance.
Recent advances in nanoparticle-based drug delivery systems have spurred the development of “theranostic” multifunctional NPs, which combine therapeutic and diagnostic functionalities in a single formulation. Current approaches to the design of theranostic NPs usually require complex and costly preparation of NPs through multiple steps. In addition, since inert excipients account for the majority of the mass of the nanocarriers, the loading of the diagnostic and therapeutic agents is rather low (typically less than 10%). Developing simple and efficient synthetic strategies for the construction of nanotheranostics with high drug loading remains a challenge. Here, we demonstrate a theranostic nanoparticle that integrates an active gemcitabine metabolite and a gadolinium-based magnetic resonance imaging agent via a facile synthesis. The nanoparticles feature a drug-loading capacity (55 wt%) that is much higher than those in many previously reported drug delivery systems. The SNPs were better T1 contrast agents than the clinically used Gd-DTPA in vitro and in vivo, having better molar relaxivity and prolonged retention in tumor. Moreover they exhibited enhanced in vivo antitumor activity compared to free drug in a breast cancer xenograft mouse model. The strategy provides a scalable way to fabricate nanoparticles that enables enhancement of both therapeutic and diagnostic capabilities. Therefore, we believe this manuscript should be of interest to readers of Acta Biomaterialia.
Acknowledgments
We thank Dr. Scott E. Malstrom (Koch Institute) and Dr. Virginia Spanoudaki (MIT) for their assistance with MRI and data analysis and the histology core facility at Koch Institute for technical support. The work was supported by NIH Grant GM073626.
Footnotes
Appendix A. Supplementary data: Supplementary data related to this article can be found at http://dx.doi.org
Competing interest disclosure: The authors declare no competing financial interest.
Publisher's Disclaimer: This is a PDF file of an unedited manuscript that has been accepted for publication. As a service to our customers we are providing this early version of the manuscript. The manuscript will undergo copyediting, typesetting, and review of the resulting proof before it is published in its final citable form. Please note that during the production process errors may be discovered which could affect the content, and all legal disclaimers that apply to the journal pertain.
References
- 1.Langer R. Polymer-controlled drug delivery systems. Acc Chem Res. 1993;26:537–42. [Google Scholar]
- 2.Tong R, Chiang HH, Kohane DS. Photoswitchable nanoparticles for in vivo cancer chemotherapy. Proc Natl Acad Sci U S A. 2013;110:19048–53. doi: 10.1073/pnas.1315336110. [DOI] [PMC free article] [PubMed] [Google Scholar]
- 3.Cheng L, Wang C, Feng L, Yang K, Liu Z. Functional nanomaterials for phototherapies of cancer. Chem Rev. 2014;114:10869–939. doi: 10.1021/cr400532z. [DOI] [PubMed] [Google Scholar]
- 4.Matsumura Y, Maeda HA. New concept for macromolecular therapeutics in cancer chemotherapy: mechanism of tumoritropic accumulation of proteins and the antitumor agent smancs. Cancer Res. 1986;46:6387–92. [PubMed] [Google Scholar]
- 5.Carmeliet P, Jain RK. Principles and mechanisms of vessel normalization for cancer and other angiogenic diseases. Nat Rev Drug Discov. 2011;10:417–27. doi: 10.1038/nrd3455. [DOI] [PubMed] [Google Scholar]
- 6.Perrault SD, Walkey C, Jennings T, Fischer HC, Chan WCW. Mediating tumor targeting efficiency of nanoparticles through design. Nano Lett. 2009;9:1909–15. doi: 10.1021/nl900031y. [DOI] [PubMed] [Google Scholar]
- 7.Miller MA, Gadde S, Pfirschke C, Engblom C, Sprachman MM, Kohler RH, Yang KS, Laughney AM, Wojtkiewicz G, Kamaly N, Bhonagiri S, Pittet MJ, Farokhzad OC, Weissleder R. Predicting therapeutic nanomedicine efficacy using a companion magnetic resonance imaging nanoparticle. Sci Transl Med. 2015;7:314ra183. doi: 10.1126/scitranslmed.aac6522. [DOI] [PMC free article] [PubMed] [Google Scholar]
- 8.Rizzo LY, Theek B, Storm G, Kiessling F, Lammers T. Recent progress in nanomedicine: therapeutic, diagnostic and theranostic applications. Curr Opin Biotechnol. 2013;24:1159–66. doi: 10.1016/j.copbio.2013.02.020. [DOI] [PMC free article] [PubMed] [Google Scholar]
- 9.Bardhan R, Lal S, Joshi A, Halas NJ. Theranostic nanoshells: from probe design to imaging and treatment of cancer. Acc Chem Res. 2011;44:936–46. doi: 10.1021/ar200023x. [DOI] [PMC free article] [PubMed] [Google Scholar]
- 10.Kim J, Piao Y, Hyeon T. Multifunctional nanostructured materials for multimodal imaging, and simultaneous imaging and therapy. Chem Soc Rev. 2009;38:372–90. doi: 10.1039/b709883a. [DOI] [PubMed] [Google Scholar]
- 11.Tian Q, Hu J, Zhu Y, Zou R, Chen Z, Yang S, Li R, Su Q, Han Y, Liu X. Sub-10 nm Fe3O4@Cu2–xS core–shell nanoparticles for dual-modal imaging and photothermal therapy. J Am Chem Soc. 2013;135:8571–77. doi: 10.1021/ja4013497. [DOI] [PubMed] [Google Scholar]
- 12.Huang P, Rong P, Lin J, Li W, Yan X, Zhang MG, Nie L, Niu G, Lu J, Wang W, Chen X. Triphase interface synthesis of plasmonic gold bellflowers as near-infrared light mediated acoustic and thermal theranostics. J Am Chem Soc. 2014;136:8307–13. doi: 10.1021/ja503115n. [DOI] [PMC free article] [PubMed] [Google Scholar]
- 13.Giljohann DA, Seferos DS, Daniel WL, Massich MD, Patel PC, Mirkin CA. Gold nanoparticles for biology and medicine. Angew Chem Int Ed. 2010;49:3280–94. doi: 10.1002/anie.200904359. [DOI] [PMC free article] [PubMed] [Google Scholar]
- 14.Lee GY, Qian WP, Wang L, Wang YA, Staley CA, Satpathy M, Nie S, Mao H, Yang L. Theranostic nanoparticles with controlled release of gemcitabine for targeted therapy and MRI of pancreatic cancer. ACS Nano. 2013;7:2078–89. doi: 10.1021/nn3043463. [DOI] [PMC free article] [PubMed] [Google Scholar]
- 15.Liu G, Zhang G, Hu J, Wang X, Zhu M, Liu S. Hyperbranched self-immolative polymers (hSIPs) for programmed payload delivery and ultrasensitive detection. J Am Chem Soc. 2015;137:11645–655. doi: 10.1021/jacs.5b05060. [DOI] [PubMed] [Google Scholar]
- 16.Duncan R. Polymer conjugates as anticancer nanomedicines. Nat Rev Cancer. 2006;6:688–701. doi: 10.1038/nrc1958. [DOI] [PubMed] [Google Scholar]
- 17.Cao Z, Tong R, Mishra A, Xu W, Wong GCL, Cheng J, Lu Y. Reversible cell-specific drug delivery with aptamer-functionalized liposomes. Angew Chem Int Ed. 2009;48:6494–98. doi: 10.1002/anie.200901452. [DOI] [PubMed] [Google Scholar]
- 18.Cai K, He X, Song Z, Yin Q, Zhang Y, Uckun FM, Jiang C, Cheng J. Dimeric drug polymeric nanoparticles with exceptionally high drug loading and quantitative loading efficiency. J Am Chem Soc. 2015;137:3458–61. doi: 10.1021/ja513034e. [DOI] [PubMed] [Google Scholar]
- 19.Caravan P, Ellison JJ, McMurry TJ, Lauffer RB. Gadolinium(III) chelates as MRI contrast agents: structure, dynamics, and applications. Chem Rev. 1999;99:2293–352. doi: 10.1021/cr980440x. [DOI] [PubMed] [Google Scholar]
- 20.Mi P, Kokuryo D, Cabral H, Kumagai M, Nomoto T, Aoki I, Terada Y, Kishimura A, Nishiyama N, Kataoka K. Hydrothermally synthesized PEGylated calcium phosphate nanoparticles incorporating Gd-DTPA for contrast enhanced MRI diagnosis of solid tumors. J Control Release. 2014;174:63–71. doi: 10.1016/j.jconrel.2013.10.038. [DOI] [PubMed] [Google Scholar]
- 21.Walker EA, Fenton ME, Salesky JS, Murphey MD. Magnetic resonance imaging of benign soft tissue neoplasms in adults. Radiol Clin N Am. 2011;49:1197–217. doi: 10.1016/j.rcl.2011.07.007. [DOI] [PubMed] [Google Scholar]
- 22.Xia A, Chen M, Gao Y, Wu D, Feng W, Li F. Gd3+ complex-modified NaLuF4-based upconversion nanophosphors for trimodality imaging of NIR-to-NIR upconversion luminescence, X-Ray computed tomography and magnetic resonance. Biomaterials. 2012;33:5394–405. doi: 10.1016/j.biomaterials.2012.04.025. [DOI] [PubMed] [Google Scholar]
- 23.Kircher MF, de la Zerda A, Jokerst JV, Zavaleta CL, Kempen PJ, Mittra E, Pitter K, Huang R, Campos C, Habte F, Sinclair R, Brennan CW, Mellinghoff IK, Holland EC, Gambhir SS. A brain tumor molecular imaging strategy using a new triple-modality MRI-photoacoustic-raman nanoparticle. Nat Med. 2012;18:829–35. doi: 10.1038/nm.2721. [DOI] [PMC free article] [PubMed] [Google Scholar]
- 24.Li X, Qian Y, Liu T, Hu X, Zhang G, You Y, Liu S. Amphiphilic multiarm star block copolymer-based multifunctional unimolecular micelles for cancer targeted drug delivery and MR imaging. Biomaterials. 2011;32:6595–605. doi: 10.1016/j.biomaterials.2011.05.049. [DOI] [PubMed] [Google Scholar]
- 25.Liu T, Li X, Qian Y, Hu X, Liu S. Multifunctional pH-Disintegrable micellar nanoparticles of asymmetrically functionalized β-cyclodextrin-Based star copolymer covalently conjugated with doxorubicin and DOTA-Gd moieties. Biomaterials. 2012;33:2521–31. doi: 10.1016/j.biomaterials.2011.12.013. [DOI] [PubMed] [Google Scholar]
- 26.Mi P, Cabral H, Kokuryo D, Rafi M, Terada Y, Aoki I, Saga T, Takehiko I, Nishiyama N, Kataoka K. Gd-DTPA-loaded polymer-metal complex micelles with high relaxivity for MR cancer imaging. Biomaterials. 2013;34:492–500. doi: 10.1016/j.biomaterials.2012.09.030. [DOI] [PubMed] [Google Scholar]
- 27.Fossheim SL, Fahlvik AK, Klaveness J, Muller RN. Paramagnetic liposomes as MRI contrast agents: influence of liposomal physicochemical properties on the in vitro relaxivity. Magn Reson Imaging. 1999;17:83–9. doi: 10.1016/s0730-725x(98)00141-6. [DOI] [PubMed] [Google Scholar]
- 28.Frias JC, Williams KJ, Fisher EA, Fayad ZA. Recombinant HDL-like nanoparticles: a specific contrast agent for MRI of atherosclerotic plaques. J Am Chem Soc. 2004;126:16316–7. doi: 10.1021/ja044911a. [DOI] [PubMed] [Google Scholar]
- 29.Kielar F, Tei L, Terreno E, Botta M. Large relaxivity enhancement of paramagnetic lipid nanoparticles by restricting the local motions of the GdIII chelates. J Am Chem Soc. 2010;132:7836–7. doi: 10.1021/ja101518v. [DOI] [PubMed] [Google Scholar]
- 30.Lee SM, Song Y, Hong BJ, MacRenaris KW, Mastarone DJ, O'Halloran TV, Meade TJ, Nguyen ST. Modular polymer-caged nanobins as a theranostic platform with enhanced magnetic resonance relaxivity and pH-responsive drug release. Angew Chem Int Ed. 2010;49:9960–4. doi: 10.1002/anie.201004867. [DOI] [PMC free article] [PubMed] [Google Scholar]
- 31.Hu X, Liu G, Li Y, Wang X, Liu S. Cell-penetrating hyperbranched polyprodrug amphiphiles for synergistic reductive milieu-triggered drug release and enhanced magnetic resonance signals. J Am Chem Soc. 2015;137:362–8. doi: 10.1021/ja5105848. [DOI] [PubMed] [Google Scholar]
- 32.Boekhoven J, Stupp SI. 25th anniversary article: supramolecular materials for regenerative medicine. Adv Mater. 2014;26:1642–59. doi: 10.1002/adma.201304606. [DOI] [PMC free article] [PubMed] [Google Scholar]
- 33.Liu D, Poon C, Lu K, He C, Lin W. Self-assembled nanoscale coordination polymers with trigger release properties for effective anticancer therapy. Nat Commun. 2014;5:4182. doi: 10.1038/ncomms5182. [DOI] [PMC free article] [PubMed] [Google Scholar]
- 34.Papa AL, Sidiqui A, Balasubramanian SUA, Sarangi S, Luchette M, Sengupta S, Harfouche R. Cell Oncol. 2013;36:449–57. doi: 10.1007/s13402-013-0146-4. [DOI] [PubMed] [Google Scholar]
- 35.Zhang Y, Peng L, Mumper RJ, Huang L. Combinational delivery of c-myc siRNA and nucleoside analogs in a single, synthetic nanocarrier for targeted cancer therapy. Biomaterials. 2013:8459–68. doi: 10.1016/j.biomaterials.2013.07.050. [DOI] [PMC free article] [PubMed] [Google Scholar]
- 36.Hou Y, Qiao R, Fang F, Wang X, Dong C, Liu K, Liu C, Liu Z, Lei H, Wang F, Gao M. NaGdF4 nanoparticle-based molecular probes for magnetic resonance imaging of intraperitoneal tumor xenografts in vivo. ACS Nano. 2013;7:330–8. doi: 10.1021/nn304837c. [DOI] [PubMed] [Google Scholar]
- 37.Tajmir-Riahi HA. Interaction of La(III) and Tb(III) ions with purine nucleotides: evidence for metal chelation (N-7-M-PO3) and the effect of macrochelate formation on the nucleotide sugar conformation. Biopolymer. 1991;31:1065–75. doi: 10.1002/bip.360310906. [DOI] [PubMed] [Google Scholar]
- 38.Duncan AK, Klemm PJ, Raymond KN, Landry CC. Silica microparticles as a solid support for gadolinium phosphonate magnetic resonance imaging contrast agents. J Am Chem Soc. 2012;134:8046–49. doi: 10.1021/ja302183w. [DOI] [PMC free article] [PubMed] [Google Scholar]
- 39.Kielar F, Tei L, Terreno E, Botta M. Large relaxivity enhancement of paramagnetic lipid nanoparticles by restricting the local motions of the Gd-III chelates. J Am Chem Soc. 2010;132:7836–7. doi: 10.1021/ja101518v. [DOI] [PubMed] [Google Scholar]
- 40.Weinmann HJ, Brasch RC, Press WR, Wesbey GE. Characteristics of gadolinium-DTPA complex: a potential NMR contrast agent. Am J Roentgenol. 1984;142:619–24. doi: 10.2214/ajr.142.3.619. [DOI] [PubMed] [Google Scholar]
- 41.Brix G, Semmler W, Port R, Schad LR, Layer G, Lorenz WJ. Pharmacokinetic parameters in CNS Gd-DTPA enhanced MR imaging. J Comput Assist Tomogr. 1991;15:621–8. doi: 10.1097/00004728-199107000-00018. [DOI] [PubMed] [Google Scholar]
Associated Data
This section collects any data citations, data availability statements, or supplementary materials included in this article.
Supplementary Materials
Figure S1. EDX characterization of the SNPs.
Figure S2. TEM images of the SNPs in human serum buffer (human serum : saline = 1:1, v/v, pH 7.4).
Figure S3. FTIR spectra of GMP before and after the formation of NPs with Gd(III). The dotted lines show the shift of the corresponding peaks. νx represent the vibration of a specific bond.
Figure S4. Cumulative release of GMP and GdIII) from SNPs in saline. Data are means ± SD, N = 4.
Figure S5. MRI signal intensity at the tumor sites before and 1 h after i.v. injection of Gd-DTPA. Data are medians ± quartiles; N = 5. Ipost/Ipre: The ratio of T1-weighted MR signal intensity in the tumor 1h after injection compared with that pre-injection.
Figure S6. Cytotoxicity of SNP and an equal concentration of gemcitabine-5′-monophosphate (GMP) to MDA-MB-231 cancer cells after 72 h. Data are means ± SD; N = 4, * = P< 0.01.
Figure S7. Images of tumor tissues 28 day post-injection of various treatments.
Figure S8. Body-weight of mice injected with (a) SNPs, (b) GMP and (c) saline (drug dose: 50 mg/kg). Data are medians ± quartiles; N = 5. t = 0 is the time when the tumors reached 100 mm3 and intravenous injections were administered.
Figure S9. Representative histological images of organs from animals receiving different treatments. Hematoxylin and eosin stained sections of tissues of mice treated with SNPs (GMP dose: 50 mg/kg) 14 days after i.v. injection. Scale bar: 100 μm.
Figure S10. Distribution of Gd at different time post-injection of SNPs (GMP dose: 50 mg/kg; Gd dose: 25 mg/kg). Data are medians ± quartiles; N = 5. Asterisks indicate P < 0.005 in the comparison between the data at days 1 and 120.
Table S1. Blood chemistry in mice 14 days after intravenous injection of PBS or SNPs (drug dose: 50 mg/kg). Data are presented in mean (standard deviation), N=4. The normal data range for 8-10 week nu/nu female mice (the same strain, age and gender as used in our experiments) was provided by Charles River (see http://www.criver.com/files/pdfs/rms/nunu/rm_rm_r_nunu_mouse_clinical_pathology_data.aspx).


