Abstract
Background
The reproducible evaluation of facial redness is critical to the assessment of Erythematotelangiectatic rosacea. Assessments have typically focused on the use of photography with the use of semi-quantitative grading scales based on evaluator rating. However, few studies have utilized computer-based algorithms to evaluate facial redness.
Aim
The purpose of this clinical study was to assess whether there is correlation between clinical grading of facial redness to the assessment of a quantitative computer-based facial modeling and measurement.
Material and Methods
In this prospective study, a set of high-resolution facial photographs and cross polarized subsurface photographs for erythema detection were obtained for 31 study participants. A computer algorithm was then utilized to detect and quantify facial redness in the photographs and compare this to semi-quantitative evaluator based grading for facial redness.
Results
There was a strong correlation between computer-based cross-polarized subsurface erythema quantification and clinical grading for redness intensity (Clinical Erythema Assessment), redness distribution, and overall redness severity (Modified Clinical Erythema Assessment).
Conclusion
Overall, facial redness measurements by facial imaging and computer analysis correlated well to clinical grading scales for both redness intensity and distribution. Future studies should incorporate facial modeling and analysis tools for assessments in clinical studies to introduce greater objectivity and quantitative analysis in facial erythema based analyses.
Keywords: photography, redness, rosacea, imaging, erythema, facial grading scale
Introduction
Clinical grading scales are critical to the evaluation of facial conditions, especially in clinical research. Rosacea is a chronic skin disorder characterized by facial erythema, flushing, telangiectasia, pustules, papules, and ocular lesions.(1) There are four subtypes of rosacea: erythematotelangiectatic rosacea, papulopustular rosacea, phymatous rosacea, and ocular rosacea.(2) The erythematotelangiectatic subtype involves diffuse erythema of the face to varying degrees.
Currently, practitioners utilize various scales to assess rosacea. The Clinician’s Erythema Assessment (CEA) is one validated semi-quantitative grading scale used to assess the severity of rosacea (Table 1). The CEA has previously been evaluated and demonstrated to be reliable with high inter-rater agreement(3) and has been used in recent studies of interventions for facial erythema.(4–8) However, the role and incorporation of technology in dermatology has increased. Facial imaging technology has advanced to now include high-resolution imaging and quantification. Whereas previous studies have used photography to assist with evaluator based semi-quantitative grading,(4–8) there have been few clinical studies that have evaluated computer-aided image analysis in dermatology to objectively quantify facial features. One previous study showed that computer-based quantification of wrinkles correlated with clinical grading of wrinkle severity.(9) Here we investigate how computer-based facial modeling and analysis of facial redness correlates to clinical grading of erythema in erythematotelangiectatic rosacea. In particular, we evaluate the use of an entirely autonomous computer-based algorithm for quantifying facial erythema, which is unique from previous facial erythema studies that rely on facial photographs paired with evaluator-based semi-quantitative grading. We hypothesized that facial redness quantification would correlate strongly with the CEA for overall redness severity assessments.
Table 1.
Clinician’s Erythema Assessment
| Redness Intensity | |
|---|---|
| Score | Description |
| 0 | Clear with no signs of erythema |
| 1 | Almost clear; slight redness |
| 2 | Mild erythema; definite redness |
| 3 | Moderate erythema; marked redness |
| 4 | Severe erythema; fiery redness |
Methods
Thirty-one subjects were recruited to participate in the study at the UC Davis Department of Dermatology. The average age of the subjects was 49.0 ± 17.9 years and a median age of 49.0 years. There were 20 females and 11 males. Subjects were included if they were diagnosed to have erythematotelangiectatic rosacea by a board-certified dermatologist. The presence of other facial rashes, contact dermatitis, or sunburn excluded them from the study. Each subject acclimatized in a climate-controlled room for 15 minutes prior to proceeding with any study related procedures. The subjects’ faces were cleaned with 70% alcohol and then the BTBP 3D Clarity Pro® Facial Modeling and Analysis System (Brigh-Tex BioPhotonics, San Jose, CA) was utilized to obtain high-resolution facial photographs for all study participants. This clinical study was approved by the Institutional Review Board at the University of California, Davis. All participants provided written informed consent.
Four graders underwent a training session that included sample photographs for erythematotelangiectatic rosacea with grading of redness for each subject using the CEA scale (Table 1).(3) In addition, redness distribution was evaluated using a 7-point scale (0–6) (Table 2). An overall redness severity score was developed by multiplying the CEA scale score with the 7-point score to form a modified CEA grade.
Table 2.
Redness distribution
| Redness Distribution | |
|---|---|
| Score | Description |
| 0 | No redness |
| 1 | 1–10% of facial surface area |
| 2 | 11–20% of facial surface area |
| 3 | 21–30% of facial surface area |
| 4 | 31–40% of facial surface area |
| 5 | 41–50% of facial surface area |
| 6 | >50% of facial surface area |
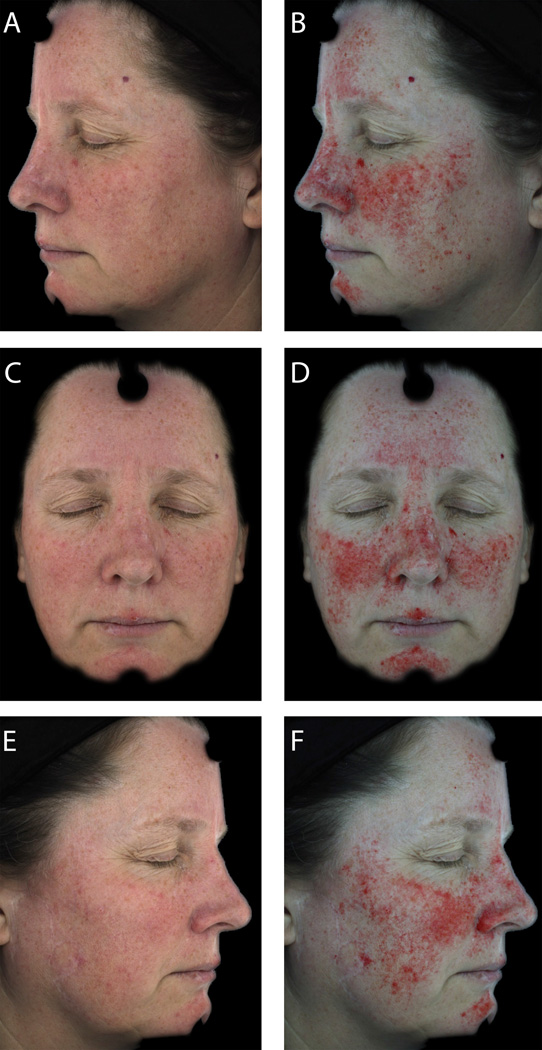
The facial redness intensity and distribution were quantified through computer algorithm based modeling where images of the skin are taken with a cross-polarized lens to provide visualization of subsurface erythema. Photographs were obtained by utilizing a built in chin platform with a stop for the forehead. A set of three cameras simultaneously obtained photographs. The chin platform and the forehead stop allow for maintenance of a set distance from the cameras. In doing so, this allows reproducible positioning of the face for the imaging and analysis. Facial and skin detection methods were combined with erythema recognition and measurement (Figure 1). For redness, the red pixels in the image were selected, respectively, through an algorithm that compared against a reference scale. The degree of red intensities was measured by measuring the redness in the areas of analysis. A weighted redness score was then calculated based on calculating a composite score by multiplying the area of involvement of different intensity levels. The total surface area redness was analyzed by calculating what percent of the analyzed surface area was composed of a minimum threshold of red pixels in comparison the reference color charts. An overall severity score was obtained by multiplying the clinical grade of the intensity with the clinical grade for the distribution for each grader. This was then compared against a severity score that was obtained by multiplying the computerized distribution and intensity scoring. The primary analysis was to assess the correlation of the overall redness severity score to the modified CEA noted by the graders. Secondary analyses included the 1) correlation to the computer based redness intensity to the CEA grades and 2) the computer based redness distribution to the clinically based distribution grading (Table 2), and 3) the concordance of the CEA grades among the graders.
Figure 1.
Facial image of a subject with erythematotelangiectatic rosacea (A) left view (B) left in cross-polarized subsurface photography (C) front view (D) front view in cross-polarized subsurface photography (E) right view (F) right view in cross-polarized subsurface photography.
Because the measures compared a parametric measure (computer based quantification) to a non-parametric measure (CEA grading), non-parametric statistical analyses were utilized. Correlations were conducted through the calculation of Spearman rank correlation coefficients with two-sided tests for the null hypothesis of a correlation coefficient equal to zero. The median scores of the graders were correlated with the facial imaging quantification for the overall redness severity, redness distribution, and the redness intensity. The inter-rater concordance of the overall redness severity score was evaluated by calculating the Kendall’s coefficient of concordance(10) with a test for the null hypothesis of a coefficient of concordance less than or equal to zero. Statistical significance was defined at p<0.05. All analyses were performed with SAS v9.4 (SAS Institute Inc., Cary, NC, USA).
RESULTS
Redness Intensity
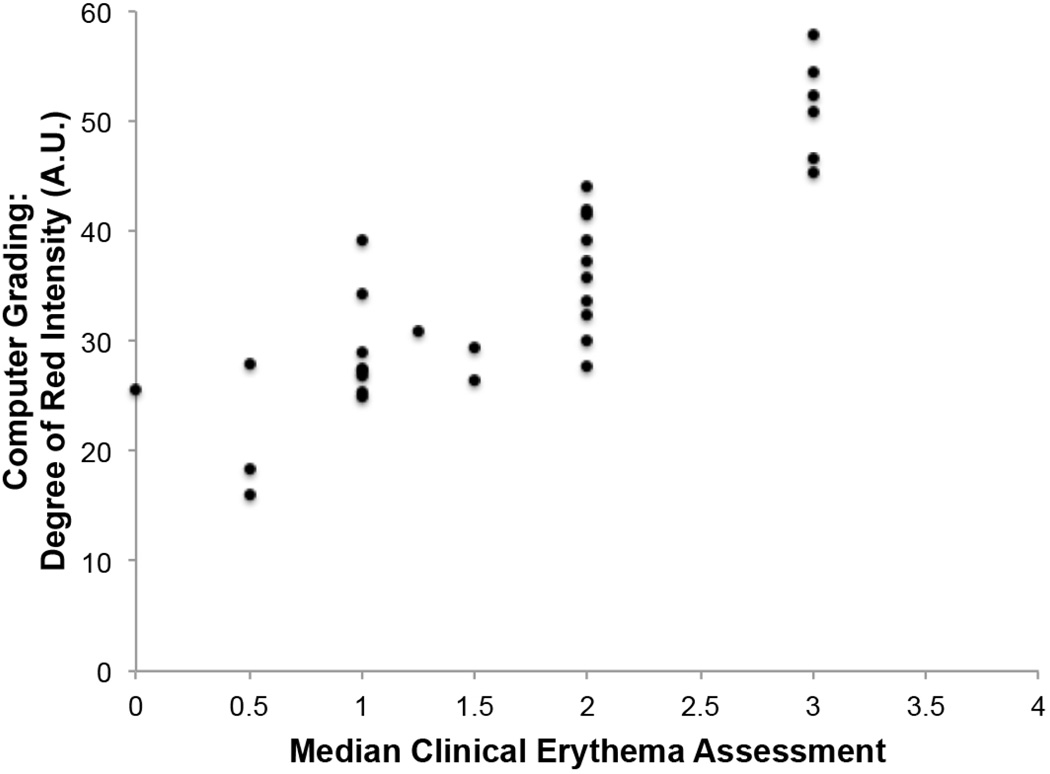
The correlation of the redness intensity to the CEA grading is shown in Figure 2. In comparing the intensity as reported by the physician based graders to that of the computer, the correlation coefficient is 0.84 (p <0.0001).
Figure 2.
Computer based grading of the redness intensity was correlated against the median clinical erythema assessment (CEA) scores of four graders. The spearman-rank correlation showed a correlation of 0.84 (p <0.0001). A.U. = arbitrary units.
Redness Distribution
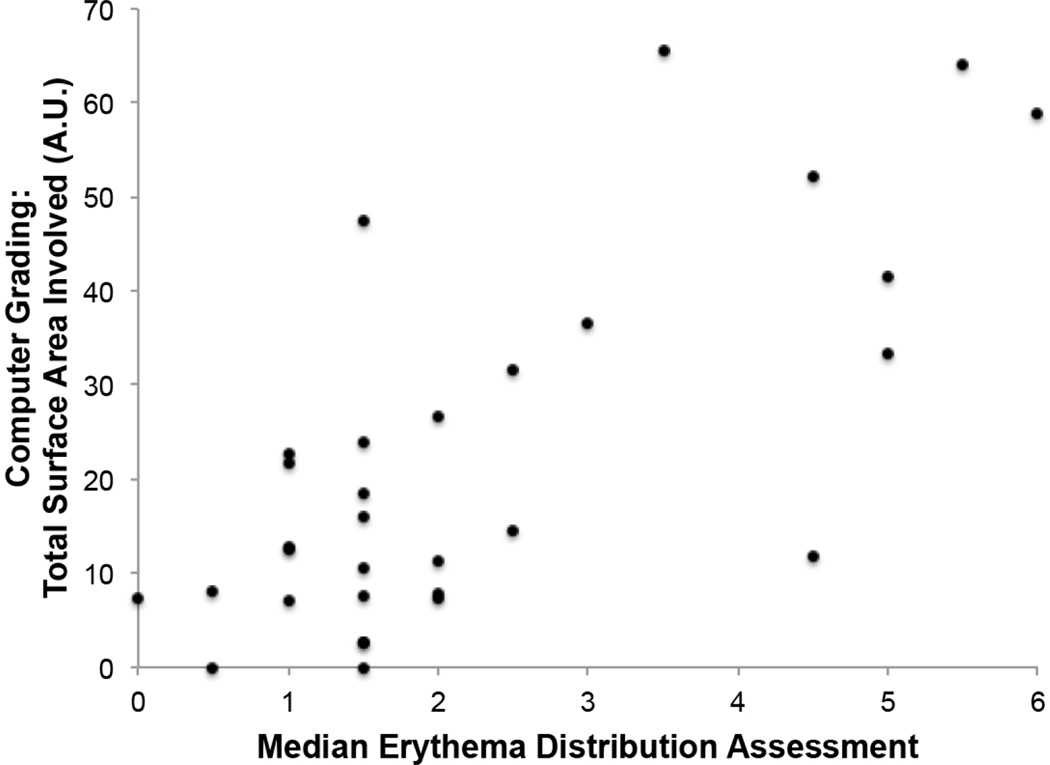
The correlation of the redness distribution to the clinical distribution grading is shown in Figure 3. The correlation coefficient between the redness distribution score of the average of the four graders and the computer generated total surface area score is 0.64 (p = 0.0001).
Figure 3.
Computer based grading of the surface area of redness was correlated against the median erythema distribution assessment scores of four graders. The spearman-rank correlation showed a correlation of 0.64 (p = 0.0001). A.U. = arbitrary units.
Overall Redness Severity
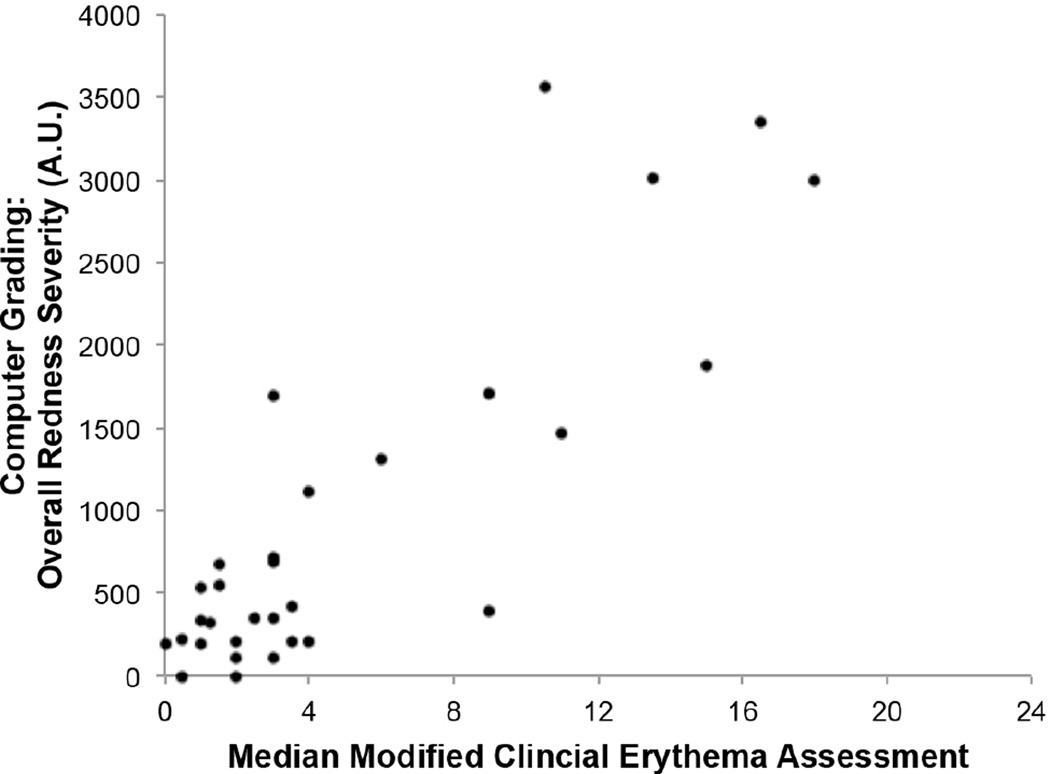
The correlation The Kendall’s coefficient of concordance among the four raters was found to be 0.82 (p < 0.0001), indicating very good inter-rater agreement for the modified CEA grading. The correlation of the computer general overall redness severity to the modified CEA grading is shown in Figure 4. The correlation coefficient between the average weighted score of the four graders and the computer-generated average of the overall redness severity is 0.71 (p<0.0001).
Figure 4.
Computer based grading of the overall redness severity was correlated against the median modified clinical erythema assessment (modified CEA) scores of four graders. The spearman-rank correlation showed a correlation of 0.82 (p <0.0001). A.U. = arbitrary units.
The correlations conducted in this study are outlined in Table 3.
Table 3.
Correlation coefficient for redness intensity, distribution, and overall severity
| Redness Factors | Spearman rank correlation coefficient |
P-value |
|---|---|---|
| Intensity | 0.84 | p <0.0001 |
| Distribution | 0.64 | p = 0.0001 |
| Overall Severity | 0.71 | p<0.0001 |
DISCUSSION
Our study suggests that there is a strong correlation between the clinical grading and computer based objective measurement for redness intensity, redness distribution, and the overall redness severity. Our comparison initially focused on the CEA as a validated scale. One previous study by Choi et al. evaluated redness in female patients with erythematotelangiectatic rosacea with the use of specific computer-aided image analysis.(11) All facial photographs were evaluated by trained evaluators and analyzed by the computer. The researchers found that the computer analysis correlated to subjective assessment. Furthermore, Choi et al, found that the relationship between the computer generated analysis and the dermatologist assessment was statistically significant.(11) Our findings are in agreement and we additionally show that computer based objective measures have strong correlation for both redness intensity and distribution, suggesting that this analytical tool can be a powerful objective tool in erythema assessments.
Although our results are encouraging, the protocol was performed as photographs during one visit for each participant. Future studies will need to assess how redness changes can be tracked within the same individual over time, especially after the use of therapies.
Our clinical study has several limitations. We only included subjects with the erythematotelangiectatic subset of rosacea and the focus was on redness assessments. Therefore, it is not clear if this modeling system can be used to objectively measure disorders involving dark and light pigmentation such as melasma or vitiligo, respectively. Furthermore, it is not clear if this system would be useful in the papulopustular variant of rosacea. Lastly, evaluation of redness on the chin is not fully assessed, as the imaging protocol does not allow for full chin imaging.
Our results are a significantly different from previous erythema assessments since it relies entirely on computer based quantification of facial erythema; even recent previous studies of facial erythema solely utilized the semi-quantitative CEA measure(4–8), rather than utilizing a fully quantitative method. It is our hope that reproducible and objective measures can be utilized for the measurements of cosmetic evaluations to ultimately improve the standardization and objectivity of measures for future studies. Our results show that redness can be reproducibly measured and future studies of evaluation of either pharmacological or device based studies of facial redness should utilize facial modeling and analysis instrumentation. It is our hope that such computer-based quantification of facial erythema will become the preferred objective measure in future studies of facial erythema.
Acknowledgments
The project described was supported by the National Center for Advancing Translational Sciences (NCATS), National Institutes of Health (NIH), through grant #UL1 TR000002.
REFERENCES
- 1.Wilkin JK. Rosacea. Pathophysiology and treatment. Arch Dermatol. 1994;130(3):359–362. doi: 10.1001/archderm.130.3.359. [DOI] [PubMed] [Google Scholar]
- 2.Wilkin J, Dahl M, Detmar M, Drake L, Feinstein A, Odom R, et al. Standard classification of rosacea: Report of the National Rosacea Society Expert Committee on the Classification and Staging of Rosacea. J Am Acad Dermatol. 2002;46(4):584–587. doi: 10.1067/mjd.2002.120625. [DOI] [PubMed] [Google Scholar]
- 3.Tan J, Liu H, Leyden JJ, Leoni MJ. Reliability of Clinician Erythema Assessment grading scale. J Am Acad Dermatol. 2014;71(4):760–763. doi: 10.1016/j.jaad.2014.05.044. [DOI] [PubMed] [Google Scholar]
- 4.Benkali K, Leoni M, Rony F, Bouer R, Fernando A, Graeber M, et al. Comparative pharmacokinetics and bioavailability of brimonidine following ocular and dermal administration of brimonidine tartrate ophthalmic solution and gel in patients with moderate-to-severe facial erythema associated with rosacea. Br J Dermatol. 2014;171(1):162–169. doi: 10.1111/bjd.12881. [DOI] [PubMed] [Google Scholar]
- 5.Fowler J, Jr, Jackson M, Moore A, Jarratt M, Jones T, Meadows K, et al. Efficacy and safety of once-daily topical brimonidine tartrate gel 0.5% for the treatment of moderate to severe facial erythema of rosacea: results of two randomized, double-blind, and vehicle-controlled pivotal studies. J Drugs Dermatol. 2013;12(6):650–656. [PubMed] [Google Scholar]
- 6.Fowler J, Jarratt M, Moore A, Meadows K, Pollack A, Steinhoff M, et al. Once-daily topical brimonidine tartrate gel 0.5% is a novel treatment for moderate to severe facial erythema of rosacea: results of two multicentre, randomized and vehicle-controlled studies. Br J Dermatol. 2012;166(3):633–641. doi: 10.1111/j.1365-2133.2011.10716.x. [DOI] [PMC free article] [PubMed] [Google Scholar]
- 7.Jackson JM, Fowler J, Moore A, Jarratt M, Jones T, Meadows K, et al. Improvement in facial erythema within 30 minutes of initial application of brimonidine tartrate in patients with rosacea. J Drugs Dermatol. 2014;13(6):699–704. [PubMed] [Google Scholar]
- 8.Moore A, Kempers S, Murakawa G, Weiss J, Tauscher A, Swinyer L, et al. Long-term safety and efficacy of once-daily topical brimonidine tartrate gel 0.5% for the treatment of moderate to severe facial erythema of rosacea: results of a 1-year open-label study. J Drugs Dermatol. 2014;13(1):56–61. [PubMed] [Google Scholar]
- 9.Foolad N, Shi V, Prakash N, Kamangar F, Sivamani R. The association of the sebum excretion rate with melasma, erythematotelangiectatic rosacea, and rhytides. Dermatology Online Journal. 2015;21(6) [PubMed] [Google Scholar]
- 10.MG K. Rank Correlation Methods. Second. London: Charles Griffin & Co. Ltd.; 1955. [Google Scholar]
- 11.Choi JW, Kwon SH, Jo SM, Youn SW. Erythema dose--a novel global objective index for facial erythema by computer-aided image analysis. Skin Res Technol. 2014;20(1):8–13. doi: 10.1111/srt.12075. [DOI] [PubMed] [Google Scholar]


