Figure 4.
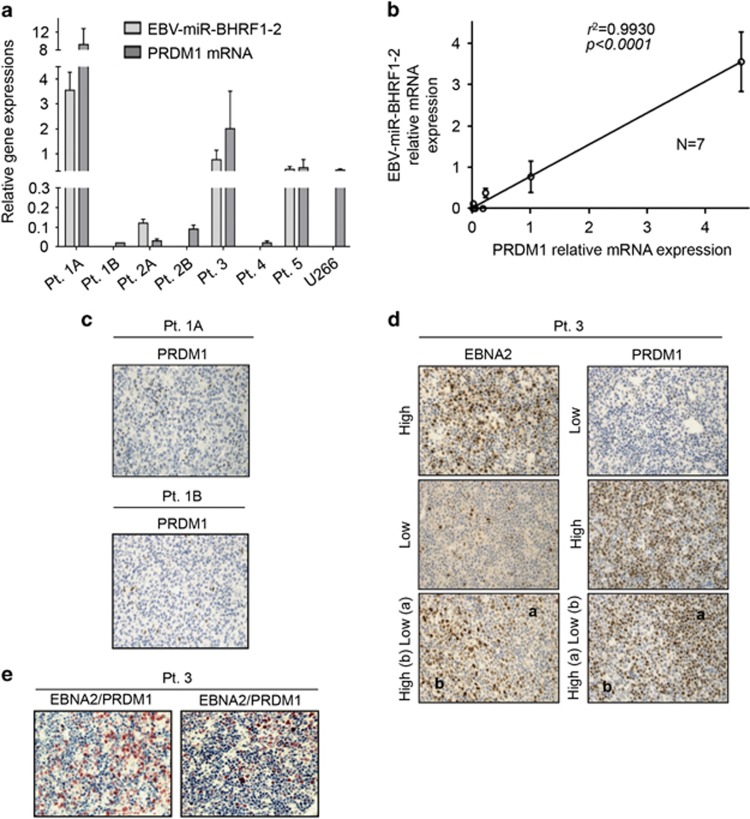
EBV-miR-BHRF1-2 and PRDM1 expressions in EBV+ PTLD patients. Total RNA and miRNA was extracted from seven formalin-fixed and paraffin-embedded patient samples and 1 cell block (U266). EBV-miR-BHRF1-2 and PRDM1 mRNA expressions were determined by qRT-PCR, and PRDM1 protein expression was evaluated using immunohistochemistry. (a) EBV-miR-BHRF1-2 and PRDM1 mRNA expressions in individual cases. U266 cell block was included as a positive control. (b) Linear regression of EBV-miR-BHRF1-2 and PRDM1 mRNA expression in all cases (N=7). (c) Immunostaining of PRDM1 in Pt. 1A, which has high PRDM1 mRNA expression, and in Pt. 1B, which has low PRDM1 mRNA expression. Note the low PRDM1 protein expressions in both cases. (d) Immunostaining of PRDM1 and EBNA2 in Pt. 3. Note the negative correlation between PRDM1 and EBNA2 expressions in different areas. a, EBNA2 low, PRDM1 high; b, EBNA2 high, PRDM1 low. (e) PRDM1 (blue)/EBNA2 (red) double staining in Pt. 3. The vast majority of the cells show either blue (PRDM1 positive) or red (EBNA2 positive) nuclear staining, indicative of the negative relationship between PRDM1 and EBNA2 expressions. Purple staining, indicative of PRDM1 and EBNA2 co-expressions, constitutes <10% of the total nuclei. qRT–PCR, quantitative reverse transcription PCR.

