

Abstract
Hexanucleotide expansions, GGGGCC, in the non-coding regions of the C9orf72 gene were found in major frontotemporal lobar dementia and amyotrophic lateral sclerosis patients (C9FTD/ALS). In addition to possible RNA toxicity, several dipeptide repeats (DPRs) are translated through repeat-associated non-ATG-initiated translation. The DPRs, including poly(GA), poly(GR), poly(GP), poly(PR), and poly(PA), were found in the brains and spinal cords of C9FTD/ALS patients. Among the DPRs, poly(GA) is highly susceptible to form cytoplasmic inclusions, which is a characteristic of C9FTD/ALS. To elucidate DPR aggregation, we used synthetic (GA)15 DPR as a model system to examine the aggregation and structural properties in vitro. We found that (GA)15 with 15 repeats fibrillates rapidly and ultimately forms flat, ribbon-type fibrils evidenced by transmission electron microscopy and atomic force microscopy. The fibrils are capable of amyloid dye binding and contain a characteristic cross-β sheet structure, as revealed by x-ray scattering. Furthermore, using neuroblastoma cells, we demonstrated the neurotoxicity and cell-to-cell transmission property of (GA)15 DPR. Overall, our results show the structural and toxicity properties of GA DPR to facilitate future DPR-related therapeutic development.
Keywords: aggregation, amyloid, amyotrophic lateral sclerosis (ALS) (Lou Gehrig disease), fibril, toxicity, C9orf72, GA, dipeptide repeat, fibril
Introduction
Frontotemporal lobar degeneration (FTLD)2 is a dementia with symptoms of behavioral changes and aphasia. Amyotrophic lateral sclerosis (ALS) progressively affects the motor neurons in the central nervous system and eventually causes death. These two degenerations share some pathological characteristics and are usually discussed together. In 2011, a gene mutation harboring hexanucleotide expansions in C9orf72 was reported to be the most common autosomal dominant mutation in familial FTLD/ALS (1, 2). The hexanucleotide GGGGCC (G4C2) is heavily expanded from tens to thousands of repeats either in the promoter region or in the first intron of C9orf72 in patients, whereas only 2–25 repeats are normally present in healthy people (1, 2). Aside from the nucleotide expansion, p62-positive, transactive response DNA binding protein-negative protein inclusions have been found in the cerebellum and hippocampus of C9orf72-linked patients (3).
The pathological role of C9orf72 expansions in FTLD/ALS pathogenesis remains unclear (4), although several mechanisms have been proposed. First, hexanucleotide expansions cause reduced mRNA expression and protein levels of C9orf72 in the brains of C9orf72-related FTLD/ALS patients (5–7). Second, the transcripts of the G4C2 expansion form RNA foci in the nuclei of human brains and spinal cords that could mediate RNA toxicity (1, 8, 9). G4C2 DNA and RNA form G-quadruplexes and cause nucleolar stress (10), and RNA foci can abolish the normal functions of RNA binding proteins (8, 9). Third, hexanucleotide expansions are translated into proteins through repeat-associated non-ATG-initiated translation (11). Interestingly, translated proteins from both sense and antisense RNA have been identified in the hippocampus, frontal and motor cortices, spinal cord, and cerebellum of patients (12–15). The reading frames of repeat-associated non-ATG-initiated translation from sense sequence G4C2 transcripts generate three DPRs (GA, GR, and GP), whereas antisense G2C4 transcripts generate PR and PA DPRs. The discovery of these protein inclusions in C9 FTLD/ALS highlighted the importance of the DPRs.
Protein inclusions are common pathological hallmarks in many neurodegenerative diseases, such as amyloid β in Alzheimer disease and α-synuclein in Parkinson disease. Here we aimed to characterize DPRs, focusing on the GA peptide. In our study, we used synthetic GA DPRs with 15 repeats to characterize the peptide properties and address the pathology found in FTLD/ALS patients. We found that (GA)15 rapidly forms amyloid fibrils, starting with the formation of short filaments and, later, ribbon-type fibrils. The aggregates are neurotoxic and exhibit transmission properties among cells.
Experimental Procedures
Peptide Synthesis and Preparation
GA peptides were synthesized by solid-phase peptide synthesis in the Genomics Research Center, Academia Sinica, Taiwan. The DPRs were dissolved at 4 mg/ml in hexafluoroisopropanol (Sigma) to eliminate preaggregates and incubated at room temperature for 2 h. Hexafluoroisopropanol was evaporated by vacuum, and peptides were dissolved further in dichloroactic acid (DCA) (Sigma). (GA)15 stock in DCA was then added to 100 mm Na2HPO4 buffer and adjusted to pH 7.4. All samples were prepared freshly prior to the experiments. The final DCA concentration in all experiments was 0.1%.
Turbidity Measurement
Different concentrations of DPR peptides were incubated at room temperature, and the aggregation was examined by turbidity measurement. Turbidity was indicated by absorbance at 450 nm by an UV-visible spectrophotometer (DU800, Beckman Coulter) with a 1-cm light path quartz cuvette (Hellma). The cuvette was sealed with Parafilm to prevent evaporation. The experiment was performed at least three times under each condition (n ≥ 3). Absorbance readings were taken every 5 min, and each experiment was monitored for 90 min.
Thioflavin T (ThT) Assay
ThT was added at 10× dilution to 100 μm (GA)15 samples right before the measurement. The final ThT concentration was 10 μm. ThT fluorescence was excited at 442 nm in a FluoroMax3 spectrometer (Horiba Scientific) with a 3-mm light path 165-QS quartz cuvette (Hellma). Spectra were recorded from 460–550 nm. The fluorescence intensity at 480 nm was plotted against the incubation time.
Dynamic Light Scattering
(GA)15 peptides were prepared using the same method as for the turbidity assay. All samples were prepared freshly, and the buffer was filtered through a 0.2-μm filter membrane. After preparation, 50 μl of the sample was loaded immediately into a 3-mm light path quartz cuvette (Hellma), and the particle size distribution was measured in Zetasizer NanoZA (Malvern). The system temperature was maintained at 25 °C. Each curve was averaged from 12 or more scans.
TEM
The samples were deposited on 400-mesh formvar carbon-coated copper grids (Electron Microscopy Sciences) for 20 min, stained negatively with 2% uranyl acetate, and rinsed. The grids were examined using field emission gun TEM (FEI Tecnai G2 TF20 Super Twin) with an accelerating voltage of 120 kV.
AFM
AFM measurements were carried out on a Bruker AXS Multimode NanoScope V equipped with a commercial fluid cell tip holder. The Peakforce mode was used for imaging. For Peakforce mode, the sample was oscillated in a vertical direction with an amplitude of 35∼100 nm and at a frequency of 2 kHz. The vertical piezo movement results in cycles of approaching and retracting traces in which the tip makes intermittent contact with the sample surface. A force-distance curve was acquired in each cycle. Topography information was obtained from the height correction performed by the feedback loop to keep a constant “peak” of force. The gold-coated backside silicon cantilevers (NanosensorsTM FM-AuD) with a spring constant of 2∼4 N/m were used. The nominal tip radius was ∼10 nm. Prior to the AFM measurements, the AFM probe was cleaned with UV light. In AFM imaging, the scan rate was ∼1 Hz, and the peak force was set at 125∼625 pN. The substrate for sample adsorption was a square piece of highly ordered pyrolytic graphite (lateral sizes of 12 × 12 mm, ZYH; Structure Probe, Inc.) that was glued to a round metal chip fixed magnetically to the AFM stage. To observe the morphology of (GA)15 fibrils, we used highly ordered pyrolytic graphite as the scanning surface. (GA)15 DPR aggregated at 100 μm was diluted to 10 μm in 25 μl of buffer and deposited onto a freshly cleaved highly ordered pyrolytic graphite. When we installed the sample into the fluid cell (60 μl), more buffer was added to fill in the cell. The sample was imaged at three to six different positions to ensure that the observations were consistent and representative. All scans were performed at room temperature under a liquid environment in the fluid cell tip holder.
Fourier Transform Infrared Spectroscopy (FTIR)
FTIR spectroscopy was performed with a Nicolet 6700 FTIR spectrometer (Thermo) equipped with a MIRacle single-reflection attenuated total reflection crystal (Pike Technologies). The samples were prepared as aforementioned preparation but grown in D2O. The samples were then precipitated by centrifugation at 17,000 × g for 30 min. The pellets were washed with D2O and centrifuged again. The pellets were resuspended in D2O and dotted repeatedly on the ZnSe crystal until dried. FTIR spectra were collected in the range of 600–4000 cm−1 with a resolution of 2 cm−1 at room temperature. More than 100 scans were averaged and normalized.
Congo Red Birefringence
Congo red stock solution was prepared as 100 μm in PBS/EtOH buffer containing 137 mm NaCl, 2.7 mm KCl, 10 mm Na2HPO4, 1.8 mm KH2PO4, and 10% ethanol. The (GA)15 end point product (5 μl, 100 μm) was diluted in 80 μl of PBS/EtOH and mixed with 15 μl of Congo red stock. The final concentration of Congo red was 15 μm, and the final concentration of (GA)15 was 5 μm. (GA)15 fibrils were stained for 12 h and pelleted at 17,000 × g for 20 min. Pellets were then resuspended in 10 μl of Milli-Q water and blotted on a glass slide. Birefringence images were captured with a Leica upright microscope (DM6000B) with a polarizer.
ThT Fluorescence Images
ThT stock (0.5 μl, 1 mm) was added to the (GA)15 end point product (10 μl, 100 μm). The final concentration of ThT was 50 μm. The solution was dotted on glass slides and observed under an Olympus IX81 fluorescence microscope with a DP80 camera.
SAXS and WAXS
The (GA)15 end point product was collected from a sample solution centrifuged at 17,000 × g for 20 min. The concentrated product was then washed repeatedly with Milli-Q water, centrifuged, and recollected to eliminate salts. The final purified product was resuspended in water and then dropped on a Kapton thin film substrate for SAXS/WAXS with the 23A SWAXS instrument of the National Synchrotron Radiation Research Center, Taiwan (16). SAXS data were collected with a two-dimensional Pilatus-1MF detector, and WAXS data were collected with either a two-dimensional complementary metal-oxide semiconductor detector (C9728DK) or a linear pixel detector (Mythen-3k) for improved resolution. The scattering wave vector q = 4πλ−1sinθ, defined by the wavelength λ (1.24 Å) and scattering angle 2θ, was calibrated using the diffraction peaks from mixture powders of silicon and silver behenate. Background scattering from a similar Kapton film was subtracted from the SAXS/WAXS data measured for the sample.
Reactive Oxygen Species (ROS) and Cytotoxicity Assay
Human neuroblastoma BE(2)-C cells (ATCC, catalog no. CRL-2268) were incubated at 37 °C under 5% CO2 and cultured in RPMI medium with 10% FBS. For the ROS test, 40,000 BE(2)-C cells were seeded, and the medium was replaced on the second day with 40 μl of DMEM/F12 (Life Technologies) phenol red-free medium containing 15 μm of CM-H2DCFDA (Life Technologies). After 1 h of incubation with CM-H2DCFDA, 20 μl of the samples was added to the wells. Cells were incubated at 37 °C for another 3 h, and the fluorescence was monitored in a microplate reader (SpectraMax M5, Molecular Devices) with excitation and emission wavelengths of 480 and 535 nm, respectively. Data were normalized to the buffer control (n = 4). For the MTT assay, cells were seeded in RPMI medium in a 96-well plate with 40,000 cells/well 1 day before the experiment. The medium was discarded, and the cells were washed with RPMI medium without FBS. RPMI medium (40 μl) was added to each well, followed by addition of 20 μl of 100 μm (GA)15, and the cells were incubated for an additional 24 h. Afterward, 7 μl of 5 mg/ml MTT solution was added and incubated for 3 h. The medium was discarded, and dimethyl sulfoxide was used to lyse the formazan crystals. Absorbance at 570 and 690 nm was measured by an ELISA microplate reader (SpectraMax M5). The absorbance differences between 570 and 690 nm were calculated, averaged (n = 4), and obtained by subtracting the background without cells. Each data set was normalized using the buffer control.
(GA)15 Propagation
Sterilized glass coverslips were placed on 6-cm plates. A total of 150,000 mouse neuroblastoma Neuro-2a cells (N2a, ATCC, catalog no. CCL-131) were seeded in each plate and incubated with 2 μm (GA)15 samples as indicated for 1 h. The FLAG-(GA)80 plasmid (a gift from Dr. Fen-Biao Gao, University of Massachusetts Medical School, Worcester, MA) was transfected in the cells using Xtreme HP reagent (Roche) according to the protocol of the manufacturer. For immunocytochemistry, cells on glass slides were obtained at the indicated times, fixed with 4% paraformaldehyde for 30 min, washed with PBS, treated with 0.3% Triton X-100 for another 30 min, and washed again. Blocking buffer containing 5% bovine serum albumin was used, and the cells were stained by anti-FLAG mouse IgG (Sigma, catalog no. F3165, lot no. SLBH1191V), followed by Alexa Fluor 594-labeled secondary antibody (Life Technologies). Finally, the coverslips were mounted with ProlongGold with DAPI staining (Life Technologies). Images were captured with a Leica upright microscope (DM6000B).
Filter Retardation Assay
Cells from the above experiment were lysed in lysis buffer containing 5 mm Tris-HCl (pH 8.8), 1 mm EDTA, 100 mm NaCl, 5 mm MgCl2, 0.5% IGEPAL CA-630, and cOmpleteTM EDTA-free protease inhibitor mixtures (Roche) on ice at the concentration provided by the manufacturer. The cell lysates were centrifuged at 2000 × g for 2 min at 4 °C to spin down the cell debris. Afterward, the supernatants were collected. Protein concentration was quantified by BCA assay kit (Pierce), and 50 μg of protein was loaded into the well of a Bio-Dot SF microfiltration apparatus (Bio-Rad) containing a cellulose acetate membrane with a pore size of 0.8 μm. Anti-FLAG mouse IgG followed by horseradish peroxidase-conjugated secondary antibody were used for immunoblotting. The image was then quantified using ImageJ (http://imagej.nih.gov/ij/).
(GA)15 Transmission among Cells
N2a cells were transfected separately with FLAG-(GA)80 and enhanced GFP (EGFP) plasmids using Xtreme HP reagent (Roche). After transfection, cells were washed with Dulbecco's PBS (Life Technologies) twice and detached from the culture dish. FLAG-(GA)80-transfected cells were mixed with an equal amount of EGFP-transfected N2a cells. A total number of 100,000 cells were seeded on a 6-cm plate with glass coverslips. Cells were fixed 5, 24, 48, and 72 h after seeding. The immunocytochemistry procedure was the same as the aforementioned method.
Results
(GA)15 Rapidly Forms Amyloid Fibrils
To study the role of DPRs in the pathology of FTLD/ALS patients, we first synthesized three forward-translated frames with 15 DPRs, referred to as (GA)15, (GR)15, and (GP)15. The solubility of (GA)15 is very low, and it cannot be fully dissolved in dimethyl sulfoxide, urea, or guanidine hydrochloride but can be dissolved in hexafluoroisopropanol or DCA. We employed DCA to dissolve (GA)15 and other DPRs. The peptide stock was diluted further into 100 mm sodium phosphate buffer to bring the pH back to neutral. After 90-min incubation, (GA)15 exhibited the highest turbidity, whereas (GR)15 and (GP)15 showed only less than 5% of that of (GA)15 (Fig. 1A). When comparing GA DPR with 5, 10, and 15 repeats, i.e. (GA)5, (GA)10, and (GA)15, we found that only (GA)15 aggregated significantly but not (GA)10 and (GA)5 (Fig. 1B). Therefore, we focused on the characterization of (GA)15 aggregation. First, we monitored the aggregation of (GA)15 in 100, 75, 50, 25, and 10 μm in quiescence by absorbance at 450 nm to determine the sample turbidity (Fig. 1C). The absorbance at 450 nm was plotted against the incubation time. We found that absorbance of (GA)15 at 100, 75, 50, and 25 μm, but not 10 μm, increased exponentially right after the measurement. Although several neuropathology studies have identified DPRs in disease lesions, no literature describes whether the DPR inclusions belong to amyloids and whether they react with classic amyloid dyes such as ThT. Therefore, we measured the aggregation kinetics of (GA)15 at 100 μm by ThT fluorescence (Fig. 1D). The ThT result showed that (GA)15 aggregates react with ThT and that the aggregation exhibits a classic amyloid nucleation-dependent pathway with a lag time of around 3 h. The kinetics reached a steady stage around 30 h. In addition, we examined (GA)15 aggregation at 100, 75, 50, 25, and 10 μm by dynamic light scattering (Fig. 2). The result was consistent with our turbidity data, showing that the particle size of (GA)15 at 10 μm did not increase through incubation time but that those of all other (GA)15 with higher concentrations increased significantly up to several micrometers. The dynamic light scattering peak of (GA)15 at 10 μm was retained around 200 nm. The peak is likely due to an artifact because we found a similar peak in the DCA-containing buffer control obtained from an Eppendorf tube.
FIGURE 1.

Aggregation of DPRs. A and B, (GA)15, (GR)15, and (GP)15 (A) and (GA)5, (GA)10, and (GA)15 (B) DPRs at 100 μm were incubated in quiescence for 90 min at room temperature. The final absorption at 450 nm was averaged (n = 4) and plotted with standard deviation. The buffer control was subtracted. C, the aggregation of (GA)15 peptides in various concentrations, including 100 (black), 75 (red), 50 (blue), 25 (green), and 10 μm (magenta), was measured by absorbance at 450 nm. More than three independent experiments were averaged and plotted with standard deviation. D, ThT fluorescence was monitored for 72 h. More than three independent experiments were averaged and plotted with standard deviation. The solid line is a trace line of the data.
FIGURE 2.

Dynamic light scattering of (GA)15 aggregation at different incubation times. Dynamic light scattering was used to monitor the particle size distribution during (GA)15 aggregation. A and B, for 100 μm (A) and 75 μm (GA)15 (B), signals colored red, orange, green, olive, cyan, blue, and magenta represent 0, 2.5, 10, 15, 20, 30, and 40 min of incubation, respectively. C, for 50 μm (GA)15, signals colored red, orange, green, olive, cyan, blue, and magenta represent 0, 2.5, 15, 25, 30, 40, and 60 min of incubation, respectively. D and E, for 25 μm (D) and 10 μm (E) of (GA)15, signals colored red, orange, green, olive, cyan, blue, magenta, and purple represent 0, 2.5, 10, 30, 50, 75, 110, and 140 min of incubation, respectively. The buffer peak is indicated as a black dashed line in E.
We further examined the morphological changes of 100 μm (GA)15 during incubation by TEM (Fig. 3). Within 1 h of incubation, (GA)15 had condensed protofibrils, and, at 3 h, (GA)15 had rod-like fibrils. Interestingly, at 24 h of incubation, the fibrils associated laterally into flat sheets and ribbon-type fibrils. At the end of incubation (≥72 h), most (GA)15 exhibited ribbon-type fibrils. In addition, we employed AFM to observe the height of (GA)15 fibrils. The samples were scanned in solution to observe its native hydrated state. In the AFM images, we found many short fibrils (Fig. 4, A and B) that were consistent with our TEM result. Scanning into smaller areas showed that the fibrils were curvy and flat. The height of a fibril indicated in Fig. 4B was around 5 Å (Fig. 4C). We further analyzed 51 fibrils from several AFM images and plotted the height distribution (Fig. 4D). The average height was 4.5 ± 0.7 Å. Overall, the average height of fibrils calculated from AFM images demonstrates the flat ribbon-like fibril structure of (GA)15.
FIGURE 3.

TEM images of (GA)15 aggregates. The morphological changes of aggregates after the indicated incubation time are shown. Scale bars = 100 nm.
FIGURE 4.
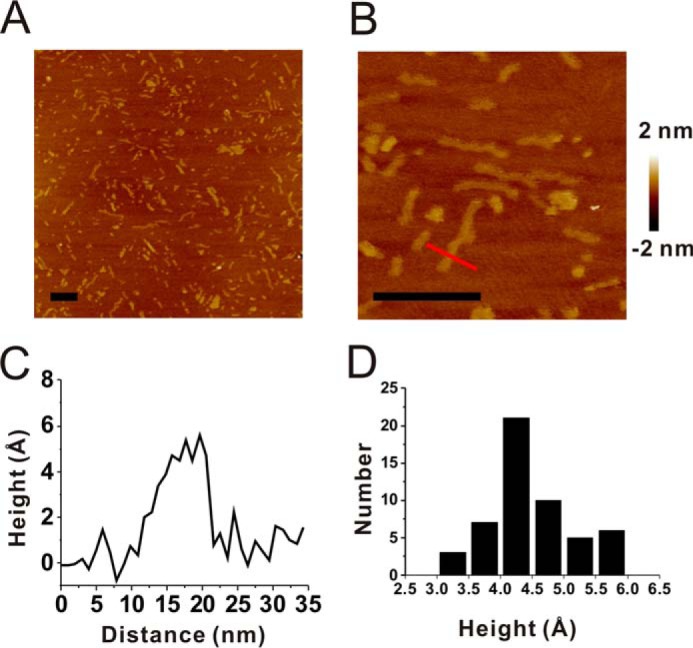
AFM images of (GA)15 fibrils. A and B, AFM images of (GA)15 fibrils in a 1-μm square (A) or a 250-nm square (B). Scale bars = 100 nm. C, the height of the cross section of (GA)15 fibrils as indicated by a red line in B. D, height distribution of (GA)15 fibrils (n = 51). The average height is 4.49 ± 0.66 Å.
(GA)15 Fibrils Are Rich in β Structures
To determine the secondary structural changes of (GA)15 fibrils, we first employed far-UV CD to examine (GA)15 at various incubation times. At time 0, (GA)15 DPR exhibited a randomly coiled spectrum. During the incubation, surprisingly, the CD spectra showed no conformational transformation; only a diminishing signal was detected (data not shown). The result could be due to no or little CD signal of glycine and alanine, respectively. FTIR was then performed to study the secondary structure of (GA)15 fibrils (Fig. 5A). The FTIR spectra of (GA)15 fibrils after 3, 6, 9, 24, and 48 h of incubation showed two major peaks at 1620 and 1642/1645 cm−1. The wave number of 1620 cm−1 represents a β sheet structure, whereas the peak around 1645 cm−1 represents a randomly coiled structure (17). After longer incubation, the peak at 1620 cm−1 increased, and the 1645 cm−1 peak shifted to 1642 cm−1. We plotted the normalized intensity of the 1620 cm−1 peak with incubation time, and the result showed that β structure content increased after 3 h of incubation and gradually reached a steady stage at ∼30 h. The result is consistent with our ThT assay.
FIGURE 5.
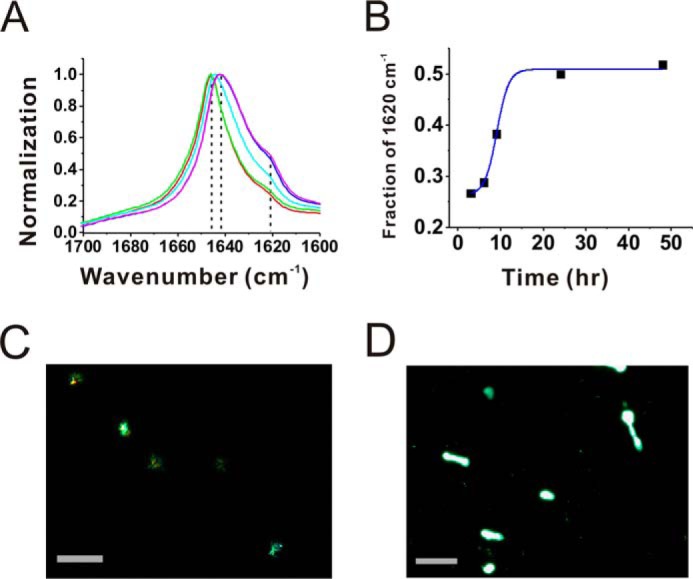
FTIR spectra and amyloid dye staining of GA peptides. A, FTIR spectra of aggregates formed from (GA)15 DPR after 3 (red), 6 (green), 9 (cyan), 24 (blue), and 48 (magenta) h of incubation. The background was subtracted. The peak positions are indicated. B, the relative intensities of 1620 cm−1 from A were plotted against the incubation time. The solid line is a trace line of the data. C and D, images of Congo red birefringence (C) and ThT (D) under fluorescence microscopy. Scale bars = 100 μm.
We further imaged (GA)15 aggregates in the presence of amyloid-specific dyes, namely, Congo red and ThT. Under a fluorescence microscope coupled with a polarizer (Fig. 5C), we clearly observed the apple-green birefringence of Congo red on (GA)15 fibrils. ThT fluorescence was also observed under a fluorescence microscope (Fig. 5D). Overall, our data support the hypothesis that the GA DPRs are capable of forming amyloid fibrils containing β structures.
Cross-β Sheet Structure of (GA)15 Fibrils Revealed with Wide Angle X-ray Scattering
To determine the detailed core structure of (GA)15 fibrils, we subjected the end point product of (GA)15 to small and wide angle x-ray scattering measurement in synchrotron radiation. The WAXS profile (Fig. 6) collected for the end point product of (GA)15 exhibited the two characteristic peaks of a typical cross-β sheet structure (18). The corresponding intersheet and interstrand packing extracted from the peak positions located at q = 0.880 and 1.408 Å−1 were 7.1 and 4.5 Å, respectively, on the basis of Bragg's law. Moreover, the β sheet domain dimensions estimated from the two peak widths (Δ: full-width half-maximum) using the Sherrer equation (∼2π/Δ, with Δ for the full-width half-maximum) were ∼21 and 16 nm along the intersheet (∼30 sheets) and interstrand (∼36 strands) packing directions. By contrast, the SAXS data exhibited a monotonic decrease in intensity of no observable interference peak (data not shown), suggesting that no ordered arrangement of these cross-β sheets was present in (GA)15 fibrils (18).
FIGURE 6.

WAXS profile of (GA)15 fibrils. The peaks of β sheets fitted with Gaussian functions are marked by the corresponding d spacings extracted from the peak positions.
(GA)15 Is Neurotoxic
To examine whether (GA)15 aggregates cause cell damage, we first performed a ROS assay on human neuroblastoma BE-(2)C cells treated with (GA)15 or left untreated after various incubation times (Fig. 7A). The result showed that the ROS level of cells treated with buffer control and freshly prepared (GA)15 (0 h) were similar. However, cells treated with (GA)15 for more than 3 h of incubation showed significantly more ROS. We further performed an MTT assay to test (GA)15-induced cytotoxicity (Fig. 7B). Freshly prepared (GA)15 peptide or aggregates after 3, 24, and >72 h incubation were treated in five concentrations ranging from 0.66–33 μm for 24 h, and then the cells were subjected to the MTT assay. We found that treatment of human neuroblastoma cells with 33 μm (GA)15 significantly reduced cell viability. The toxicity followed a dose-dependent manner. Interestingly, the toxicity level was significantly higher with treatment of the freshly prepared (GA)15 and (GA)15 after 3 h of incubation (∼45% toxicity) than of the (GA)15 fibril after 24 h and >72 h incubation (∼15% toxicity). Our results demonstrated that the non-ATG-induced GA DPRs were cytotoxic.
FIGURE 7.

The cytotoxicity of (GA)15 aggregates. A, a ROS assay was used to test the immediate toxicity of (GA)15 after incubation for 0, 3, 9, and 24 h. CM-H2DCFDA was used to detect ROS generation. The data were averaged (n = 4) and plotted with standard deviation. B, an MTT assay was used to evaluated the toxicity of (GA)15 after incubation for 0, 3, 24, and 72 h. At each time point, final concentrations of 33 (black), 6.6 (dark gray), 3.3 (gray), 1.32 (light gray), and 0.66 (striped) μm (GA)15 were treated. The data were averaged (n = 4) and plotted with standard deviation. The statistical analyses were performed by one-way analysis of variance. *, p < 0.05; **, p < 0.01; ***, p < 0.001.
(GA)15 Fibrils Are Capable of Cell-to-Cell Transmission
To ask whether extracellular treatment of (GA)15 is capable to induce aggregation in cells, we added a buffer control or 2 μm freshly prepared (GA)15 peptide at time 0 and end point product as seeds to N2a neuroblastoma cells 1 h prior to transfection with FLAG-(GA)80 plasmid. Inclusions were detected by anti-FLAG antibody to specifically recognize transfected FLAG-(GA)80. After transfection for 5 h, no inclusion was observed in cells treated with buffer (Fig. 8A) or freshly prepared (GA)15 (Fig. 8B), whereas some small inclusions were observed in end product-treated cells (Fig. 8C). After transfection for 10–15 h, cells treated with freshly prepared (GA)15 started to form cytoplasmic inclusions (Fig. 8, E and H), but those treated with buffer had no inclusions at 10 h (Fig. 8D) until a small amount of aggregates were observed 15 h after transfection (Fig. 8G). On the other hand, cells treated with (GA)15 end point product had prominent and larger inclusions 10 and 15 h after transfection (Fig. 8, F and I). We performed a filter retardation assay to quantify the induced inclusions (Fig. 8J). Inclusions larger than the pore size of the membrane would be trapped on the membrane. The trapped species were detected by anti-FLAG antibody. (GA)15 end products induced a more profound aggregation of transfected FLAG-(GA)80. The result was consistent with the fluorescence images. We quantified the trapped FLAG-(GA)80 from three independent experiments (Fig. 8K). Overall, we found that extracellular (GA)15 accelerated the formation of intracellular inclusions and that the end point product of (GA)15 induced significantly more inclusions than the fresh sample. These data demonstrated that extracellular synthetic (GA)15 aggregates can be taken up by cells as seeds and drive intracellular aggregation. In addition, to find out whether GA inclusion could be transmitted from cell to cell, we co-cultured equal amounts of FLAG-(GA)80-transfected and EGFP-transfected N2a cells on glass coverslips. After 24 h of co-incubation, we found several co-localization signals of EGFP and FLAG-(GA)80 in cells (Fig. 8L). These assays demonstrated that GA has cell-to-cell transmission properties in which inclusions can be taken from the extracellular space and transmitted among cells.
FIGURE 8.

Extracellular (GA)15 fibrils induce formation of intracellular GA inclusions. A–I, immunofluorescence images of GA inclusions. Mouse neuroblastoma N2a cells were treated with buffer (A, D, and G), freshly prepared (GA)15 (B, E, and H), and end product of (GA)15 (C, F, and I), respectively. Images were taken 5 (A, B, and C), 10 (D, E, and F), and 15 h (G, H, and I) after transfection with FLAG-(GA)80. Images from DAPI staining (blue) and anti-FLAG staining (red) were merged. Scale bars = 100 μm. J and K, filter retardation assay of GA inclusions. The cell lysates were trapped on a cellulose acetate membrane with 0.8-μm pore size and blotted by anti-FLAG IgG (J). The intensities of the bands were quantified, averaged from three independent experiments, and plotted with standard deviations (K). Arbitrary unit (a.u.) for intensity are shown. The statistical analysis were performed by one-way analysis of variance. *, p < 0.05; **, p < 0.01; ***, p < 0.001. L, co-incubation of EGFP-transfected and FLAG-(GA)80-transfected cells. Images from EGFP expression (green), DAPI staining (blue), and anti-FLAG staining (red) were merged. Scale bars = 10 μm.
Discussion
The GA DPR has been found to be one of the translated proteins in C9orf72 expansions in FTLD/ALS. The role and structure of DPRs are currently unknown. Here we used (GA)15, with 15 DPRs, as a model system to study its aggregation. We showed that (GA)15 is a more aggregated species than (GR)15 and (GP)15 DPRs. The species first formed short filaments and continued to grow into ribbon-type fibrils after a longer incubation time. The fibrils were amyloid fibrils, as evidenced by ThT and Congo red staining. The fibrils have cross-β structures with two major x-ray diffraction peaks at 7.1 and 4.5 Å. The aggregates were neurotoxic and could be transmitted among cells.
Recently, several aggregated forms of α-synuclein, the main constituent in Lewy bodies of Parkinson disease, were examined in vivo for their cell-to-cell transmission properties, and the ribbon type of α-synuclein fibril was found to be less toxic than regular fibrils (19). This result reflects the polymorphism of the amyloid species even in the fibril form. We also observed flat ribbons of (GA)15 DPR starting at 24 h to the end of incubation. The ROS level was increased in the samples after 3-h incubation but not in the freshly prepared one. The MTT assay showed that the samples after 24 h incubation were significantly less toxic than the freshly prepared ones and those with a shorter incubation time, e.g. 3 h. Given that the MTT assay was performed after an additional day of incubation with the cells, (GA)15 aggregation proceeded further in the culture medium. Therefore, our result suggested that fibrils formed in an intermediate time, likely between 3–24 h, are more detrimental. These results facilitate the identification of toxic species for future therapeutic development. Although previous literature has shown that amyloid oligomers in other amyloidogenic proteins, such as amyloid β and α-synuclein, are more toxic than their fibril forms (20, 21), in this study we did not observe (GA)15 DPR forming oligomers. Also, we did not observe increased ROS levels in the freshly prepared samples. One possibility is that (GA)15 oligomers, if any, appear very transiently under our experimental conditions. To address the oligomer toxicity, further experiments to stabilize (GA)15 oligomers will need to be conducted.
The cross-β structure of (GA)15 fibrils is evidenced by WAXS with an interstrand spacing of ∼4.5 Å and an intersheet spacing of ∼7.1 Å. The intersheet spacing of (GA)15 is much more compact in comparison with that of amyloid β fibrils (10 Å). It may be due to the smaller side chains of (GA)15 and, consequently, a better packing with larger β sheet domain sizes than the often observed diameter of amyloid β fibrils (22, 23). The β structure peak was examined further with FTIR, essentially revealing absorption peaks for a parallel β sheets structure but no observable intensity for anti-parallel β sheets (24), i.e. a peak at ∼1630 cm−1 and a weaker peak at 1,695 cm−1, suggesting that the β sheets are parallel. Interestingly, GA DPR resembles the sequence found in silk peptides. Three conformations, including silk I (α-helix/random coil), silk II (β sheet), and silk III (three-fold polyglycine II-like helix) have been reported in silk peptide fibroin C with the amino acid sequence GAGAGS (25). Our (GA)15 also has a strong peak at 1645 cm−1 in FTIR, similar to the silk I structure in silk fibroin. A previous WAXS study has suggested that the fibroin protein harboring 13 blocks rich in GAGA repeats contains characteristic spacing with 4.4 and 3.6 Å for the silk II structure (26). Our WAXS data also revealed the additional 3.6-Å peak (Fig. 4) in addition to the major interstrand 4.5-Å peak of (GA)15 DPR.
Although all five types of DPRs have been found in cytoplasmic inclusions in the cerebellum and hippocampus areas of patients with C9orf72 expansions (3, 14), only poly(GA) overexpression in primary neurons mimicked the p62-positive neuronal cytoplasmic inclusions (27). In a Drosophila model, arginine-rich DPRs, GRs, and PRs caused neurodegeneration (28), and PR DPR has been reported to form toxic nuclear aggregates (29). Co-expression of (GA)80 and (GR)80 in fly and HeLa cells showed that (GA)80 recruits (GR)80 to form cytoplasmic inclusions and suppresses (GR)80 toxicity (30). Although GA DPR does not cause neurodegeneration in fly models, here we showed direct evidence that (GA)15 aggregates are cytotoxic, with cell-to-cell transmission properties, even if it may not be the most toxic species. Indeed, other studies have shown that expression of (GA)50 DPR in HEK293T and primary neurons caused caspase-3 activation, neurite impairment, inhibition of proteasome activity, and endoplasmic reticulum stress (31). These reports addressed the importance of aggregation-prone DPRs and the urgent need to understand their aggregation mechanism and the correlation to toxicity.
Author Contributions
Y. J. C. performed all experiments except for WAXS/SAXS and AFM. U. S. J. conducted the WAXS/SAXS study. Y. L. C. and I. S. H. conducted the AFM study. Y. J. C. and Y. R. C. analyzed the data and wrote the manuscript. Y. R. C. conducted the research.
Acknowledgments
We thank Dr. Hui-Ming Yu (Genomics Research Center, Academia Sinica, Taiwan) for peptide synthesis and the confocal microscope facility in the Genomics Research Center (Academia Sinica). We also thank Dr. Chun-Jen Su and Dr. Yi-Qi Yeh (National Synchrotron Radiation Research Center, Taiwan) for performing the WAXS/SAXS study and Dr. Chung-Kai Fang (Institute of Physics, Academia Sinica, Taiwan) for assisting with the AFM study.
This work was supported by Ministry of Science and Technology, Taiwan Grants MOST 103-2113-M-001-015 and MOST 104-2627-M-001-005). The authors declare that they have no conflicts of interest with the contents of this article.
- FTLD
- frontotemporal lobar degeneration
- ALS
- amyotrophic lateral sclerosis
- DPR
- dipeptide repeat
- ThT
- thioflavin T
- TEM
- transmission electron microscopy
- AFM
- atomic force microscopy
- WAXS
- wide angle x-ray scattering
- SAXS
- small angle x-ray scattering
- ROS
- reactive oxygen species
- MTT
- 3-(4,5-dimethylthiazol-2-yl)-2,5-diphenyltetrazolium bromide
- N2a
- Neuro-2a
- EGFP
- enhanced GFP.
References
- 1. DeJesus-Hernandez M., Mackenzie I. R., Boeve B. F., Boxer A. L., Baker M., Rutherford N. J., Nicholson A. M., Finch N. A., Flynn H., Adamson J., Kouri N., Wojtas A., Sengdy P., Hsiung G. Y., Karydas A., Seeley W. W., Josephs K. A., Coppola G., Geschwind D. H., Wszolek Z. K., Feldman H., Knopman D. S., Petersen R. C., Miller B. L., Dickson D. W., Boylan K. B., Graff-Radford N. R., and Rademakers R. (2011) Expanded GGGGCC hexanucleotide repeat in noncoding region of C9ORF72 causes chromosome 9p-linked FTD and ALS. Neuron 72, 245–256 [DOI] [PMC free article] [PubMed] [Google Scholar]
- 2. Renton A. E., Majounie E., Waite A., Simón-Sánchez J., Rollinson S., Gibbs J. R., Schymick J. C., Laaksovirta H., van Swieten J. C., Myllykangas L., Kalimo H., Paetau A., Abramzon Y., Remes A. M., Kaganovich A., Scholz S. W., Duckworth J., Ding J., Harmer D. W., Hernandez D. G., Johnson J. O., Mok K., Ryten M., Trabzuni D., Guerreiro R. J., Orrell R. W., Neal J., Murray A., Pearson J., Jansen I. E., Sondervan D., Seelaar H., Blake D., Young K., Halliwell N., Callister J. B., Toulson G., Richardson A., Gerhard A., Snowden J., Mann D., Neary D., Nalls M. A., Peuralinna T., Jansson L., Isoviita V.-M., Kaivorinne A.-L., Hölttä-Vuori M., Ikonen E., Sulkava R., Benatar M., Wuu J., Chiò A., Restagno G., Borghero G., Sabatelli M., Heckerman D., Rogaeva E., Zinman L., Rothstein J. D., Sendtner M., Drepper C., Eichler E. E., Alkan C., Abdullaev Z., Pack S. D., Dutra A., Pak E., Hardy J., Singleton A., Williams N. M., Heutink P., Pickering-Brown S., Morris, Huw R., Tienari P. J., and Traynor B. J. (2011) A hexanucleotide repeat expansion in C9ORF72 is the cause of chromosome 9p21-linked ALS-FTD. Neuron 72, 257–268 [DOI] [PMC free article] [PubMed] [Google Scholar]
- 3. Al-Sarraj S., King A., Troakes C., Smith B., Maekawa S., Bodi I., Rogelj B., Al-Chalabi A., Hortobágyi T., and Shaw C. (2011) p62 positive, TDP-43 negative, neuronal cytoplasmic and intranuclear inclusions in the cerebellum and hippocampus define the pathology of C9orf72-linked FTLD and MND/ALS. Acta Neuropathol. 122, 691–702 [DOI] [PubMed] [Google Scholar]
- 4. Rohrer J. D., Isaacs A. M., Mizielinska S., Mead S., Lashley T., Wray S., Sidle K., Fratta P., Orrell R. W., Hardy J., Holton J., Revesz T., Rossor M. N., and Warren J. D. (2015) C9orf72 expansions in frontotemporal dementia and amyotrophic lateral sclerosis. Lancet Neurol. 14, 291–301 [DOI] [PubMed] [Google Scholar]
- 5. Belzil V. V., Bauer P. O., Prudencio M., Gendron T. F., Stetler C. T., Yan I. K., Pregent L., Daughrity L., Baker M. C., Rademakers R., Boylan K., Patel T. C., Dickson D. W., and Petrucelli L. (2013) Reduced C9orf72 gene expression in c9FTD/ALS is caused by histone trimethylation, an epigenetic event detectable in blood. Acta Neuropathol. 126, 895–905 [DOI] [PMC free article] [PubMed] [Google Scholar]
- 6. Fratta P., Poulter M., Lashley T., Rohrer J. D., Polke J. M., Beck J., Ryan N., Hensman D., Mizielinska S., Waite A. J., Lai M.-C., Gendron T. F., Petrucelli L., Fisher E. M., Revesz T., Warren J. D., Collinge J., Isaacs A. M., and Mead S. (2013) Homozygosity for the C9orf72 GGGGCC repeat expansion in frontotemporal dementia. Acta Neuropathol. 126, 401–409 [DOI] [PMC free article] [PubMed] [Google Scholar]
- 7. Waite A. J., Baumer D., East S., Neal J., Morris H. R., Ansorge O., and Blake D. J. (2014) Reduced C9orf72 protein levels in frontal cortex of amyotrophic lateral sclerosis and frontotemporal degeneration brain with the C9ORF72 hexanucleotide repeat expansion. Neurobiol. Aging 35, 1779.e5–1779.e13 [DOI] [PMC free article] [PubMed] [Google Scholar]
- 8. Donnelly C. J., Zhang P.-W., Pham J. T., Haeusler A. R., Heusler A. R., Mistry N. A., Vidensky S., Daley E. L., Poth E. M., Hoover B., Fines D. M., Maragakis N., Tienari P. J., Petrucelli L., Traynor B. J., Wang J., Rigo F., Bennett C. F., Blackshaw S., Sattler R., and Rothstein J. D. (2013) RNA toxicity from the ALS/FTD C9ORF72 expansion is mitigated by antisense intervention. Neuron 80, 415–428 [DOI] [PMC free article] [PubMed] [Google Scholar]
- 9. Lee Y.-B., Chen H.-J., Peres J. N., Gomez-Deza J., Attig J., Stalekar M., Troakes C., Nishimura A. L., Scotter E. L., Vance C., Adachi Y., Sardone V., Miller J. W., Smith B. N., Gallo J.-M., Ule J., Hirth F., Rogelj B., Houart C., and Shaw C. E. (2013) Hexanucleotide repeats in ALS/FTD form length-dependent RNA foci, sequester RNA binding proteins, and are neurotoxic. Cell Rep. 5, 1178–1186 [DOI] [PMC free article] [PubMed] [Google Scholar]
- 10. Haeusler A. R., Donnelly C. J., Periz G., Simko E. A., Shaw P. G., Kim M. S., Maragakis N. J., Troncoso J. C., Pandey A., Sattler R., Rothstein J. D., and Wang J. (2014) C9orf72 nucleotide repeat structures initiate molecular cascades of disease. Nature 507, 195–200 [DOI] [PMC free article] [PubMed] [Google Scholar]
- 11. Zu T., Gibbens B., Doty N. S., Gomes-Pereira M., Huguet A., Stone M. D., Margolis J., Peterson M., Markowski T. W., Ingram M. A., Nan Z., Forster C., Low W. C., Schoser B., Somia N. V., Clark H. B., Schmechel S., Bitterman P. B., Gourdon G., Swanson M. S., Moseley M., and Ranum L. P. (2011) Non-ATG-initiated translation directed by microsatellite expansions. Proc. Natl. Acad. Sci. U.S.A. 108, 260–265 [DOI] [PMC free article] [PubMed] [Google Scholar]
- 12. Zu T., Liu Y., Bañez-Coronel M., Reid T., Pletnikova O., Lewis J., Miller T. M., Harms M. B., Falchook A. E., Subramony S. H., Ostrow L. W., Rothstein J. D., Troncoso J. C., and Ranum L. P. (2013) RAN proteins and RNA foci from antisense transcripts in C9ORF72 ALS and frontotemporal dementia. Proc. Natl. Acad. Sci. 110, E4968–E4977 [DOI] [PMC free article] [PubMed] [Google Scholar]
- 13. Mann D. M., Rollinson S., Robinson A., Bennion Callister J., Thompson J. C., Snowden J. S., Gendron T., Petrucelli L., Masuda-Suzukake M., Hasegawa M., Davidson Y., and Pickering-Brown S. (2013) Dipeptide repeat proteins are present in the p62 positive inclusions in patients with frontotemporal lobar degeneration and motor neurone disease associated with expansions in C9ORF72. Acta Neuropathol. Commun. 1, 68. [DOI] [PMC free article] [PubMed] [Google Scholar]
- 14. Mori K., Arzberger T., Grässer F. A., Gijselinck I., May S., Rentzsch K., Weng S.-M., Schludi M. H., van der Zee J., Cruts M., Van Broeckhoven C., Kremmer E., Kretzschmar H. A., Haass C., and Edbauer D. (2013) Bidirectional transcripts of the expanded C9orf72 hexanucleotide repeat are translated into aggregating dipeptide repeat proteins. Acta Neuropathol. 126, 881–893 [DOI] [PubMed] [Google Scholar]
- 15. Mori K., Weng S.-M., Arzberger T., May S., Rentzsch K., Kremmer E., Schmid B., Kretzschmar H. A., Cruts M., Van Broeckhoven C., Haass C., and Edbauer D. (2013) The C9orf72 GGGGCC repeat is translated into aggregating dipeptide-repeat proteins in FTLD/ALS. Science 339, 1335–1338 [DOI] [PubMed] [Google Scholar]
- 16. Xu C. F., Gu Z. F., Cheng G., Zhou H. Y., Wang Z. M., Liu X. M., Han Q. Y., and Jiang M. H. (2010) Revised phase diagram for the Nd-Pt system from 35 to 85 at% platinum. J. Appl. Crystallogr. 43, 33–37 [Google Scholar]
- 17. Nilsson M. R. (2004) Techniques to study amyloid fibril formation in vitro. Methods 34, 151–160 [DOI] [PubMed] [Google Scholar]
- 18. Bongiovanni M. N., Caruso F., and Gras S. L. (2013) Lysine functionalised amyloid fibrils: the design and assembly of a TTR1-based peptide. Soft Matter 9, 3315–3330 [Google Scholar]
- 19. Peelaerts W., Bousset L., Van der Perren A., Moskalyuk A., Pulizzi R., Giugliano M., Van den Haute C., Melki R., and Baekelandt V. (2015) α-Synuclein strains cause distinct synucleinopathies after local and systemic administration. Nature 522, 340–344 [DOI] [PubMed] [Google Scholar]
- 20. Kayed R., Head E., Thompson J. L., McIntire T. M., Milton S. C., Cotman C. W., and Glabe C. G. (2003) Common structure of soluble amyloid oligomers implies common mechanism of pathogenesis. Science 300, 486–489 [DOI] [PubMed] [Google Scholar]
- 21. Dahlgren K. N., Manelli A. M., Stine W. B. Jr., Baker L. K., Krafft G. A., and LaDu M. J. (2002) Oligomeric and fibrillar species of amyloid-β peptides differentially affect neuronal viability. J. Biol. Chem. 277, 32046–32053 [DOI] [PubMed] [Google Scholar]
- 22. Hane F., and Leonenko Z. (2014) Effect of metals on kinetic pathways of amyloid-β aggregation. Biomolecules 4, 101–116 [DOI] [PMC free article] [PubMed] [Google Scholar]
- 23. Lin J. M., Lin T. L., Jeng U. S., Huang Z. H., and Huang Y. S. (2009) Aggregation structure of Alzheimer amyloid-β(1–40) peptide with sodium dodecyl sulfate as revealed by small-angle X-ray and neutron scattering. Soft Matter 5, 3913–3919 [Google Scholar]
- 24. Cerf E., Sarroukh R., Tamamizu-Kato S., Breydo L., Derclaye S., Dufrêne Y. F., Narayanaswami V., Goormaghtigh E., Ruysschaert J. M., and Raussens V. (2009) Antiparallel β-sheet: a signature structure of the oligomeric amyloid β-peptide. Biochem. J. 421, 415–423 [DOI] [PubMed] [Google Scholar]
- 25. Wilson D., Valluzzi R., and Kaplan D. (2000) Conformational transitions in model silk peptides. Biophys. J. 78, 2690–2701 [DOI] [PMC free article] [PubMed] [Google Scholar]
- 26. Martel A., Burghammer M., Davies R. J., Di Cola E., Vendrely C., and Riekel C. (2008) Silk fiber assembly studied by synchrotron radiation SAXS/WAXS and Raman spectroscopy. J. Am. Chem. Soc. 130, 17070–17074 [DOI] [PubMed] [Google Scholar]
- 27. Schludi M. H., May S., Grässer F. A., Rentzsch K., Kremmer E., Küpper C., Klopstock T., German Consortium for Frontotemporal Lobar Degeneration, Bavarian Brain Banking Alliance, Arzberger T., and Edbauer D. (2015) Distribution of dipeptide repeat proteins in cellular models and C9orf72 mutation cases suggests link to transcriptional silencing. Acta Neuropathol. 130, 537–555 [DOI] [PMC free article] [PubMed] [Google Scholar]
- 28. Mizielinska S., Grönke S., Niccoli T., Ridler C. E., Clayton E. L., Devoy A., Moens T., Norona F. E., Woollacott I. O., Pietrzyk J., Cleverley K., Nicoll A. J., Pickering-Brown S., Dols J., Cabecinha M., Hendrich O., Fratta P., Fisher E. M., Partridge L., and Isaacs A. M. (2014) C9orf72 repeat expansions cause neurodegeneration in Drosophila through arginine-rich proteins. Science 345, 1192–1194 [DOI] [PMC free article] [PubMed] [Google Scholar]
- 29. Wen X., Tan W., Westergard T., Krishnamurthy K., Markandaiah S. S., Shi Y., Lin S., Shneider N. A., Monaghan J., Pandey U. B., Pasinelli P., Ichida J. K., and Trotti D. (2014) Antisense proline-arginine RAN dipeptides linked to C9ORF72-ALS/FTD form toxic nuclear aggregates that initiate in vitro and in vivo neuronal death. Neuron 84, 1213–1225 [DOI] [PMC free article] [PubMed] [Google Scholar]
- 30. Yang D., Abdallah A., Li Z., Lu Y., Almeida S., and Gao F.-B. (2015) FTD/ALS-associated poly(GR) protein impairs the Notch pathway and is recruited by poly(GA) into cytoplasmic inclusions. Acta Neuropathol. 130, 525–535 [DOI] [PMC free article] [PubMed] [Google Scholar]
- 31. Zhang Y.-J., Jansen-West K., Xu Y.-F., Gendron T. F., Bieniek K. F., Lin W.-L., Sasaguri H., Caulfield T., Hubbard J., Daughrity L., Chew J., Belzil V. V., Prudencio M., Stankowski J. N., Castanedes-Casey M., Whitelaw E., Ash P. E., DeTure M., Rademakers R., Boylan K. B., Dickson D. W., and Petrucelli L. (2014) Aggregation-prone c9FTD/ALS poly(GA) RAN-translated proteins cause neurotoxicity by inducing ER stress. Acta Neuropathol. 128, 505–524 [DOI] [PMC free article] [PubMed] [Google Scholar]