

Abstract
A network model for the determination of tumor metabolic fluxes from 13C NMR kinetic isotopomer data has been developed and validated with perfused human DB-1 melanoma cells carrying the BRAF V600E mutation, which promotes oxidative metabolism. The model generated in the bonded cumomer formalism describes key pathways of tumor intermediary metabolism and yields dynamic curves for positional isotopic enrichment and spin-spin multiplets. Cells attached to microcarrier beads were perfused with 26 mm [1,6-13C2]glucose under normoxic conditions at 37 °C and monitored by 13C NMR spectroscopy. Excellent agreement between model-predicted and experimentally measured values of the rates of oxygen and glucose consumption, lactate production, and glutamate pool size validated the model. ATP production by glycolytic and oxidative metabolism were compared under hyperglycemic normoxic conditions; 51% of the energy came from oxidative phosphorylation and 49% came from glycolysis. Even though the rate of glutamine uptake was ∼50% of the tricarboxylic acid cycle flux, the rate of ATP production from glutamine was essentially zero (no glutaminolysis). De novo fatty acid production was ∼6% of the tricarboxylic acid cycle flux. The oxidative pentose phosphate pathway flux was 3.6% of glycolysis, and three non-oxidative pentose phosphate pathway exchange fluxes were calculated. Mass spectrometry was then used to compare fluxes through various pathways under hyperglycemic (26 mm) and euglycemic (5 mm) conditions. Under euglycemic conditions glutamine uptake doubled, but ATP production from glutamine did not significantly change. A new parameter measuring the Warburg effect (the ratio of lactate production flux to pyruvate influx through the mitochondrial pyruvate carrier) was calculated to be 21, close to upper limit of oxidative metabolism.
Keywords: bioenergy, cancer biology, glucose metabolism, glutaminase, isotopic tracer, mathematical modeling, metabolism, mitochondrial metabolism, nuclear magnetic resonance (NMR), transport
Introduction
Cancer cells exhibit metabolic patterns that differ significantly from those of terminally differentiated adult tissues. They require rapid production of both energy and biosynthetic precursors to sustain a high rate of proliferation. The network of biochemical pathways underlying these processes is complex. Most of the individual enzymatic conversions involved in this network have probably already been identified, but a comprehensive and quantitative description of the fluxes involved is lacking. Methods to produce such descriptions will likely be very useful in the design of new therapeutics that specifically target the metabolic abnormalities of cancer as well as in clinical implementation of non-invasive methods for detection of cancer and its therapeutic response.
The kinetics of 13C isotope labeling as monitored by NMR spectroscopy has been used to measure flux through various metabolic pathways of perfused isolated cells and organs and in vivo (1–4). Kinetic data provide estimates of absolute flux, whereas steady-state data measure relative flux. Both types of analysis require validated mathematical models, which have been formulated for the heart (5–10), liver (11–13), brain (14–16), and tumors (17). Only the heart model has been validated by comparison between model-derived and experimental parameters (6, 7). Modeling of tumor metabolic fluxes has been limited to steady-state analysis with dynamic measurements of glucose uptake and lactate production subsequently added to convert to absolute fluxes; none of these models has been validated. To the best of our knowledge, this is the first validated dynamic flux model of tumor intermediary metabolism based on 13C NMR isotope kinetic data.
Mathematical models of 13C magnetic resonance spectroscopy data are based on measurement of positional isotopic enrichment and/or on isotopomer analysis, which takes into account spin-spin coupling of covalently bonded labeled carbon atoms. Bonded cumomer analysis includes both positional enrichment and isotopomer modeling and facilitates the formulation of kinetic differential equations. This method requires fewer equations than classical isotopomer analysis and is based on internal symmetry properties of metabolite isotopomers.
Our laboratories have developed a Continuous Stirred Tank Bioreactor suitable for high resolution 13C NMR spectroscopy of cultured cancer cells that can produce detailed spectra with good temporal resolution while simultaneously monitoring the oxygen consumption rate (18–21). Specifically, we measured the time course for labeling of key intermediates such as glutamate, aspartate, alanine, lactate, and fatty acyl groups in real time during growth with 13C-labeled glucose and unlabeled glutamine as substrates.
Here, we demonstrate that absolute flux measurements of perfused tumor cells can be obtained in several hours from ∼5 × 10⁸ tumor cells in this bioreactor system, and the data can be analyzed using a refined isotopomer analysis method called bonded cumomer (BC)3 analysis (22) that utilizes only ∼210 differential equations to describe most of tumor intermediary metabolism, whereas the heart model of Chance et al. (5) required ∼325 differential equations to describe just TCA cycle activity in terms of positional enrichment. To validate the BC model, we compared model-derived and experimental values of the following parameters: O2 consumption rate (MRO2), glutamate pool sizes, as well as rates of glucose consumption and lactate release. This study permits direct measurements of energy production by glycolytic and mitochondrial pathways and quantitative evaluation of the Warburg effect. It also provides a basis for future studies of the effects of various therapeutic interventions on tumor metabolism. Whereas studies of perfused tumor cells in a bioreactor facilitate accurate and reproducible measurements, this model is also applicable to in vivo studies in animal models and humans. Recent studies of ex vivo surgically resected human brain (23) and lung (24) tumors point to the potential utility of in vivo 13C MRS clinical applications.
Experimental Procedures
Cell Culture
DB-1 human melanoma cells were derived from a lymph node metastasis (Thomas Jefferson University Hospital, Philadelphia, PA). The cells were obtained before administration of any treatment. Cells were cultured from the tumor and cryopreserved after the 16th passage. The presence of melanoma cell surface antigens was confirmed with monoclonal antibodies (25). For routine culture, DB-1 cells were grown as monolayers at 37 °C in 5% CO2 in α-minimal essential medium supplemented with 10% fetal bovine serum, 2 mm glutamine, 26 mm glucose, and 1% (v/v) non-essential amino acids and 10 mm HEPES buffer. The doubling time in tissue culture flasks was 48 h (26).
Cell Perfusion and NMR Spectroscopy
For cell perfusion studies, DB-1 cells were cultured in DMEM with 1% (v/v) non-essential amino acids (Invitrogen), 10% fetal bovine serum, 10 mm HEPES, 4 mm glutamine, and 26 mm glucose (complete DMEM). During NMR experiments, ∼5 × 10⁸ cells were grown on the surface of non-porous microcarriers that had a mean diameter of 170 μm (SoloHill, Ann Arbor, MI). The surface of the microcarriers was coated with either collagen or ProNectinF® to enhance cell attachment and proliferation. The microcarriers were tightly packed inside a 20-mm NMR tube. They were perfused continuously with the system shown in Fig. 1A. A detailed description of the perfusion system, including flow rates, cell adhesion procedures, etc., has been presented previously (20).
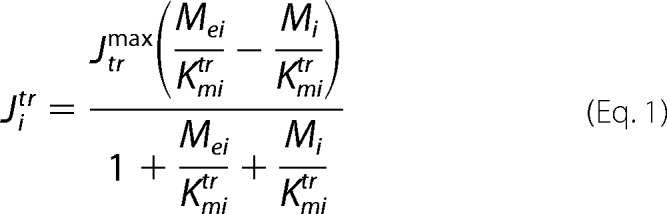
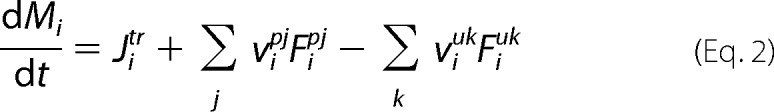
FIGURE 1.
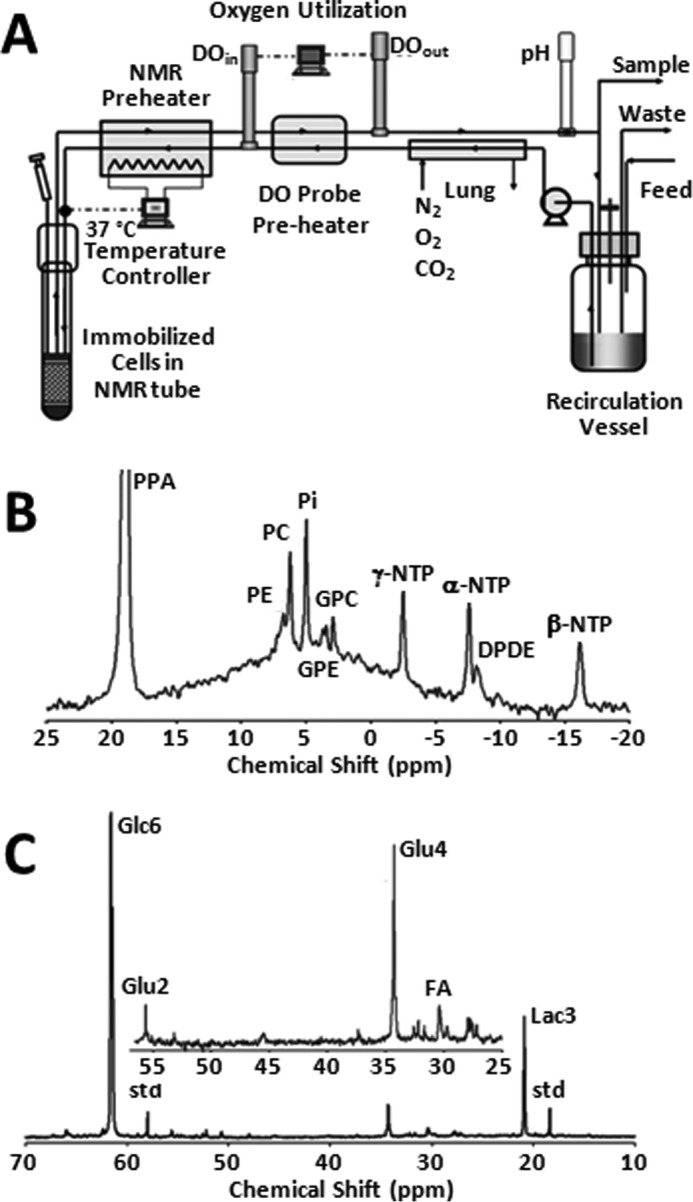
Bioreactor design and NMR spectra of DB-1 melanoma cells. A, schematic drawing of the apparatus used to perfuse cells inside the NMR spectrometer. Two polarographic oxygen probes are used to continually measure the oxygen consumption rate of the perfused culture. An electrical resistant heater is used to maintain the culture at a constant temperature of 37 °C. The probes and the recirculated medium are housed in a small incubator (not shown) to maintain the probes at a constant temperature. A peristaltic pump is used to circulate the medium. Additional details are available in Ref. 20. B, 31P NMR spectrum of metabolically active DB-1 cells. The spectrum was obtained in 20 min. C, 13C NMR spectrum of metabolically active DB-1 cells during perfusion with medium containing 26 mm [1,6-13C2]glucose at the end of experiment. Glu, glutamate; Lac, lactate; Glc, glucose; std, ethanol in capillary; FA, –CH2– groups in long chain fatty acids.
A peristaltic pump (Masterflex, Cole Parmer, Chicago) was used to circulate medium through the microcarriers at a flow rate of 12 ml/min. Before entering the cell mass, the medium flowed through a gas exchange module where carbon dioxide was removed, and oxygen was added across a silicone membrane (thin-wall silicone tubing). Subsequently, the medium was warmed to 40 °C, and the oxygen level was measured continuously with a polarographic oxygen probe (Mettler-Toledo, Columbus, OH). The steady-state oxygen level of the medium at the inlet of the cell mass was maintained near air saturation. A second polarographic oxygen probe was used to detect the oxygen level of the medium coming out of the NMR tube so that the oxygen consumption rate of the culture could be determined continuously. A pH probe (Mettler-Toledo, Columbus, OH) was also used downstream of the outlet oxygen probe. The pH of the medium was controlled by adjusting the level of CO2 in the gas exchange module. The temperature of the medium entering the NMR tube was fine-tuned with a microstat-controller and an electrical resistance heater to 37 ± 0.2 °C. The glucose concentration in the recirculating medium was maintained at a constant level (clamped) by continuously feeding fresh medium and removing depleted medium from a recirculation bottle. The flow rate of fresh medium to the system was typically 24 ml/h, and the volume of recirculating medium was 120 ml. During the 13C experiments, 32 mm [1,6-13C2]glucose was introduced into the feed to the system, and the recirculating glucose level was clamped at 26 mm by adjusting the feed rate.
13C NMR spectra were acquired with standard 1H decoupled NOE 13C acquisition on a 9.4 tesla/89 mm vertical bore Varian spectrometer (Varian Inc., Palo Alto, CA). The acquisition parameters were as follows: 60° pulse angle, 1.2-s repetition rate, 25,000 Hz spectral width, 16,384 points, and 750 transients per spectrum. To ensure that 1H decoupling did not raise the temperature of the perfusate above 37.5 °C, the temperature of the medium leaving the NMR tube was continuously monitored with a thermocouple. Free induction decays were apodized by exponential multiplication (2 Hz) for signal to noise enhancement. Nuts NMR (Acorn NMR, Fremont, CA) was used to determine resonance peak areas. The cell number in the NMR tube was determined from the total NTP level as described previously (27). 31P spectral parameters were 60° pulse angle, 1-s repetition rate, 15,000 Hz, and 1200 transients.
In this work, melanoma cells were initially studied under normoxic hyperglycemic conditions to enhance lactic acidosis (28, 29) and subsequently under euglycemic conditions to more closely simulate in vivo conditions. The effects of glucose concentration on flux through various pathways of tumor metabolism were evaluated. In the initial studies, the concentration of glucose in the perfusate was maintained at 26 mm, a value that we believe would be the upper limit for a therapeutic procedure. In subsequent studies, the glucose concentration was 5 mm. The kinetics of labeling in lactate, glutamate, and other metabolites was monitored over an ∼6-h time course. The results were used to estimate intracellular fluxes. The estimated TCA cycle flux was compared with the oxygen consumption flux to test the accuracy of the calculations.
Pentose Phosphate Pathway (PPP) Labeling
DB-1 cells were grown in T-150 flasks in α-minimal essential medium. At about 70% confluency of cells in the flask, the medium was replaced with DMEM with 5 mm [1,2-13C]glucose (Cambridge Isotope Laboratories, Inc., Cambridge, MA) and incubated for 8 h at 37 °C and 5% CO2. The cells were harvested by using 0.05% trypsin/EDTA (Invitrogen), rinsed twice with phosphate-buffered saline (PBS) at 4 °C, and frozen. The cells were homogenized after adding 4 ml of 12 m perchloric acid and were spun at 13,000 × g for 30 min. The supernatant was neutralized with 3 m KOH, lyophilized, and dissolved in 0.6 ml of D2O. High resolution NMR spectra of the metabolites were generated using a 9.4-tesla spectrometer (Agilent, Palo Alto, CA) equipped with a 5-mm broadband probe. Proton-decoupled 13C spectra were acquired with the following parameters: sweep width = 20 kHz, number of points = 128,000, flip angle 30°, repetition time = 7.3 s, and number of average = 7000. The proton-observed carbon-edited NMR technique (30) was employed to differentiate between the 13C-labeled and -unlabeled lactate signals in the proton spectra with the following parameters: sweep width = 5 kHz, number of points = 32,000, repetition time = 12 s, echo time = 1/J = 7.8 ms, and number of average = 64. Experiments were run in duplicate. iNMR software (Mestrelab Research, Spain) was used for spectral fitting and integration.
Glutaminolysis and Fatty Acids Labeling
DB-1 cells were grown on C104-1521 microcarriers (SoloHill) in uncoated T-75 flasks with α-minimal essential medium. At about 70% confluency of cells on the microcarrier beads, the medium was replaced with DMEM with 2 mm l-glutamine (U-13C5, 99%) (Cambridge Isotope Laboratories, Inc.). Two concentrations of glucose were used in the medium, 5 and 25 mm. After 8 h of incubation, the cells were carefully stripped from the microcarriers using mechanical agitation. Microcarriers were allowed to settle, and suspension containing cells was collected. Cells were rinsed twice with PBS at 4 °C and frozen until metabolite extraction. For fatty acid labeling, cells were grown, incubated, and harvested as above with the exception that the incubation was performed for 24 h and the label used was l-glutamine (13C5, 99%; 15N2, 99%) (Cambridge Isotope Laboratories, Inc.).
LC/MS
The isotope-enriched cells were washed twice with PBS and resuspended in 700 μl of ice-cold methanol. Samples were pulse-sonicated for 30 s and centrifuged at 16,000 × g for 10 min. The supernatant was then transferred to another tube and evaporated to dryness under nitrogen. Samples were resuspended in 100 μl of water and analyzed using an Agilent 1200 series HPLC system coupled to an Agilent 6460 triple quadrupole mass spectrometer equipped with an ESI source operated in the negative ion mode. The injection volume was 10 μl. Analytes were separated by reverse-phase ion-pairing chromatography utilizing a Phenomenex Luna C18 column (150 × 2.00 mm, 3 μm particle size) at a flow rate of 200 μl/min and maintained at 45 °C. A two-gradient solvent system was used, with solvent A as 400 mm 1,1,1,3,3,3-hexafluoro-2-propanol and 10 mm diisopropylethylamine in water, and solvent B as 400 mm 1,1,1,3,3,3-hexafluoro-2-propanol and 10 mm diisopropylethylamine in methanol. The linear gradient conditions were as follows: 2% B at 0 min; 2% B at 4 min; 95% B at 9 min; 95% B at 11 min; and 2% B at 11.5 min, followed by a 3.5-min equilibration. The Agilent 6460 mass spectrometer operating conditions were as follows: gas temperature was set at 320 °C, and the gas flow was set to 8 liters/min. The sheath gas temperature was 400 °C, and the sheath gas flow was set to 10 liters/min. The capillary voltage was set to 3000 V, and the nozzle voltage was set to 1000 V.
Bonded Cumomer Metabolic Network Model
To calculate fluxes through key pathways of tumor energy metabolism from 13C isotopic labeling data, we have utilized a novel three-compartment metabolic network model with the bionetwork schematically depicted in Fig. 2 and applicable to Continuous Stirred Tank Bioreactor systems. The model includes medium, cytosolic and mitochondrial compartments interconnected with various transporters. The cytosolic membrane contains glucose (GLUT), monocarboxylic acid (MCT), and glutamine (GLN) transporters to the cytosolic compartment. Tumors generally express GLUT1 and GLUT3, but only GLUT1 is currently included in the model; similarly DB-1 contains MCT1 and MCT4 in approximately equal proportions (26), but because the Km value of MCT1 is ∼1/10th that of MCT4, we have only included MCT1 in the current model. We have included the GLN transporter (alanine-serine-cysteine (GLN) transporter 2) because of the critical role of glutamine in tumor energetics and metabolism. The BC model can readily be extended to incorporate other isoforms of MCT and GLUT as well as transporters for other amino acids and metabolites.
FIGURE 2.

Melanoma bionetwork: glycolysis, PPP, TCA cycle, α-ketoglutarate-glutamate, and oxaloacetate-aspartate exchange through the malate-aspartate shuttle, anaplerosis through (a) pyruvate carboxylase activity, (b)succinyl-CoA, and (c) glutaminolysis through mitochondrial glutaminase (GLS and GLS2); pyruvate recycling through cytosolic (ME1) and mitochondrial malic enzymes (ME2 and ME3), lactate dehydrogenase activity, de novo fatty acid synthesis, and transport processes. The following abbreviations were used for the metabolites of glycolysis: G6P, glucose 6-phosphate; F6P, fructose 6-phosphate; F16BP, fructose 1,6-bisphosphate; G3P, glyceraldehyde 3-phosphate; PEP, phosphoenolpyruvate. Abbreviations for the oxidative branch of PPP are as follows: 6PG, d-6-phosphogluconate; Ru5P, d-ribulose 5-phosphate. Abbreviations for the non-oxidative PPP branch are as follows: R5P, d-ribose 5-phosphate; X5P, d-xylulose 5-phosphate; S7P, d-sedoheptulose 7-phosphate; E4P, d-erythrose 4-phosphate.
The mitochondrial pyruvate carrier, which was recently identified in all mammalian cells (31–33), was included to permit access of pyruvate to the PDH complex for conversion to acetyl-CoA and incorporation into the TCA cycle. Pyruvate is also linked to the TCA cycle via pyruvate carboxylase. Citrate, glutamate, and malate are included in the cytosolic compartment with direct links through the mitochondria to the TCA cycle. As already noted, the mitochondrial compartment contains the complete TCA cycle with links to the cytosol for citrate and malate. α-Ketoglutarate is linked to glutamate via glutamate dehydrogenase (GLUD) and two aminotransferases, aspartate aminotransferase (GOT) and alanine aminotransferase (GPT).
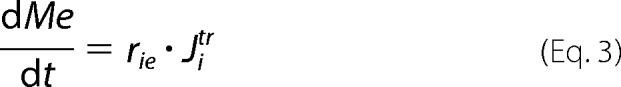
A constructed BC dynamic model adapted to perfusion bioreactor experiments was used to fit the 13C time courses of labeled lactate, glutamate, and fatty acids to determine the corresponding metabolic fluxes and the transport parameter for bidirectional lactate transport through the cell membrane. In the model, the perfused [1,6-13C2]glucose and glutamine (labeled in some experiments, see below) are transported from the extracellular medium to the DB-1 cells assuming that reversible non-steady-state Michaelis-Menten facilitative transport kinetics occurs through glucose (GLUT family) or glutamine (alanine-serine-cysteine (GLN) transporter 2) transporters as shown in Equation 1,
 |
where Jitr is the net transport flux for boundary species i between media and cytosol or cytosol and mitochondria; Mei is the extracellular concentration for species i; Jtrmax is the maximal transport rate; Kmirtr is the Michaelis-Menten constant for transport. The labeled lactate from the cell is transported into the medium and obeys the same Michaelis-Menten kinetics through the mono-carboxylic acid transporter (MCT family). In this study, facilitated media-cell transport is assumed for glucose, lactate, and glutamine.
The metabolic network includes glycolysis, TCA cycle, α-ketoglutarate-glutamate, and oxaloacetate-aspartate exchange through the following: malate-aspartate shuttle; anaplerosis through (a) pyruvate carboxylase activity, (b) at the succinyl-CoA level, and (c) glutaminolysis through mitochondrial glutaminases (GLS and GLS2); pyruvate recycling through cytosolic (NADP+-dependent ME1) and mitochondrial malic enzymes (NAD+-dependent ME2 and NADP+-dependent ME3); lactate dehydrogenase activity; and transport processes. In this study, PPP fluxes through oxidative and non-oxidative branches were included in the modeling analysis. The network also includes de novo lipogenesis and fatty acid oxidation.
The model was expressed mathematically using two types of mass balance equations, i.e. for chemical and isotope variables. The mass balance equation for the total metabolite concentration in the medium, cytosol and mitochondria is Equation 2,
 |
where Mi is intracellular concentration of the i species; Jitr is net transport flux for boundary species i between media and cytosol or cytosol and mitochondria; Fipj and Fiuk are normalized reaction fluxes that produce (j) or utilize (k) cellular species i; and vipj and νiuk are corresponding stoichiometric coefficients. For extracellular boundary metabolites in the medium, dynamic mass balance has the following general form as shown in Equation 3,
 |
where the extracellular species concentration is Me, and rie is the ratio of cell volume to media volume. An additional term for the medium flow rate was also was included. Note that we do not assume here that media boundary metabolites are at constant concentrations, and this assumption (or lack of assumption) is common for bioreactor systems.
Together with the initial metabolome state vector M0 ϵ RN and fluxome Fo ϵ RM (subscript 0 refers to baseline steady-state values and reaction rates) isotopomer dynamics of this system are formulated as an initial value problem for ordinary differential equations in terms of bonded cumomer fractions as the state variables. For parallel monomolecular reactions, metabolite 13C cumomer mass balance was expressed in the form shown in Equation 4,
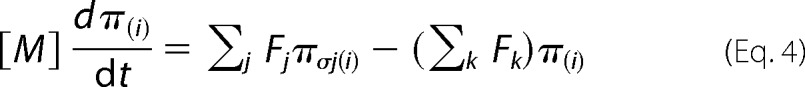 |
where metabolite M is downstream of another metabolite Sj. The total outflux ∑Fk balances total influx ∑Fj. [M] represents the total pool size of metabolite M, whereas π(i) and πσj(i) represent the ith cumomer fraction of metabolite M and metabolite Sj (i bonded cumomer), respectively.
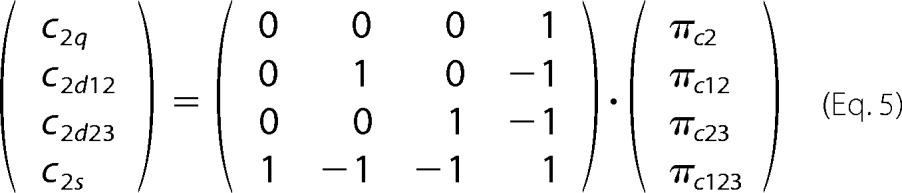
Isotopomer balance equations were derived for every metabolite bonded cumomer of orders 1, 2, and 3 (e.g. glutamate, glutamine, and aspartate) as described by Shestov et al. (22). This resulted in a set of ∼210 differential equations. Fine structure multiplets were completely described by each metabolite's bonded cumomers of order 1, 2, and 3. The use of bonded cumomers leads to a reduced number of equations compared with a model, including all possible isotopomers, while retaining all the NMR-measurable isotopomer information. The term cumomer was first proposed by Wiechert et al. (34), and the concept of cumomer was used in early studies by Muzykantov and Shestov (35). There are connection matrices between the “bonded cumomer” π vectors, which reflect subsets of particularly labeled isotopomers and the vectors of singlets, doublets, triplets, and quartets of metabolite “fine structure” of 13C NMR spectra. One can derive kinetic equations in the form of fine-structure spectroscopically defined NMR data using matrix connection equations. For example, for a metabolite with five carbon atoms such as glutamate, the equation for carbon 2 would be as shown in Equation 5,
 |
For [1,6-13C2]glucose perfusion, the fitted time courses were as follows: Glu4Tot (Tot-total), Glu4s, Glu4d34, Glu3Tot, Glu3d, Glu2Tot, Glu2s, Lac3Tot, and acylmethylene (–(CH2)n–) resonance, for a total of nine curves. The following free fluxes were determined: melanoma TCA cycle FTCA; pyruvate carboxylase FPC; exchange between glutamate and α-ketoglutarate FX; anaplerotic exchange and net flux at the level of succinyl-CoA; FANA; mitochondrial malic enzyme (ME2 + ME3) activity; de novo fatty acid production, glutaminolysis, aspartate efflux; and three other parameters, Michaelis-Menten lactate transport VmaxLAC, and KmLAC, and total cellular lactate concentration. Other fluxes and parameters, including the Warburg effect value, were calculated based on flux balance analysis, including non-oxidative glycolytic flux CMRlac and others. Solving a system of differential equations (using the Runge-Kutta 4th order procedure for stiff systems) in terms of bonded cumomer variables yields time courses for all possible fine structure 13C multiplets of glutamate, glutamine, and aspartate.
The classical PPP consists of two branches, irreversible oxidative and reversible non-oxidative parts. The oxidative branch represents the net PPP flux and produces NADPH, which can be used in many reductive synthetic pathways, including de novo lipogenesis. The PPP reactions are summarized in the Fig. 2.
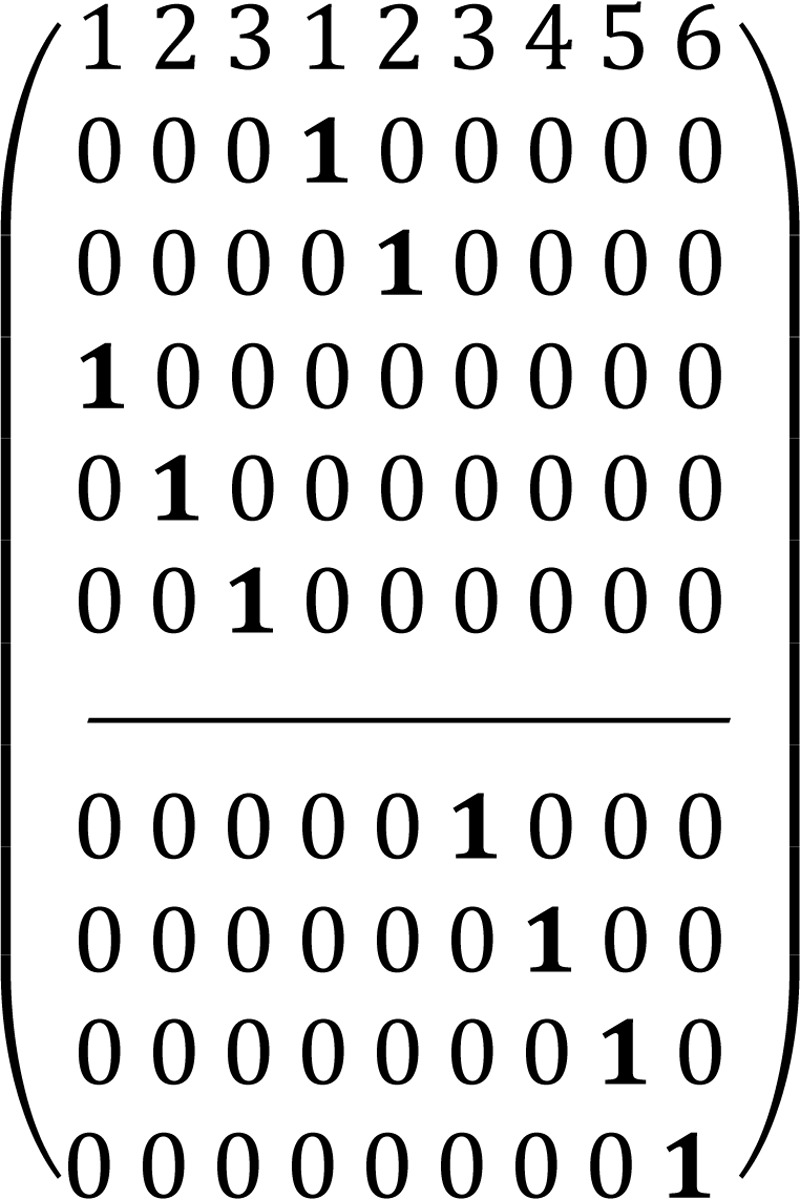
To describe the pentose phosphate pathway, we used the steady-state bonded cumomer flux model variant (which results in a system of non-linear algebraic equations for the π(i) cumomer fraction; see the equation for π(i), instead of the set of differential equations) to fit 13C NMR lactate data acquired after an 8-h incubation of DB-1 cells with [1,2-13C2]glucose tracer. The fitted steady-state data were Lac3Tot, Lac2Tot, Lac3s, Lac3d23, Lac2s, and Lac2d23 multiplets. The relations between lactate multiplets and bonded cumomers are presented elsewhere (22). Non-oxidative reactions are assumed to follow carbon atom redistributions (based on the ping-pong chemical mechanism) depicted in the following atom distribution matrices (ADM) (22, 35). Particularly for the transketolase 1 (TK1) reaction, X5P + R5P ⇔ G3P + S7P, where xylulose 5-phosphate (X5P) and ribose 5-phosphate (R5P) forms glyceraldehyde 3-phosphate (G3P) and sedoheptulose 7-phosphate (S7P), the corresponding ADM is shown in Matrix 1.
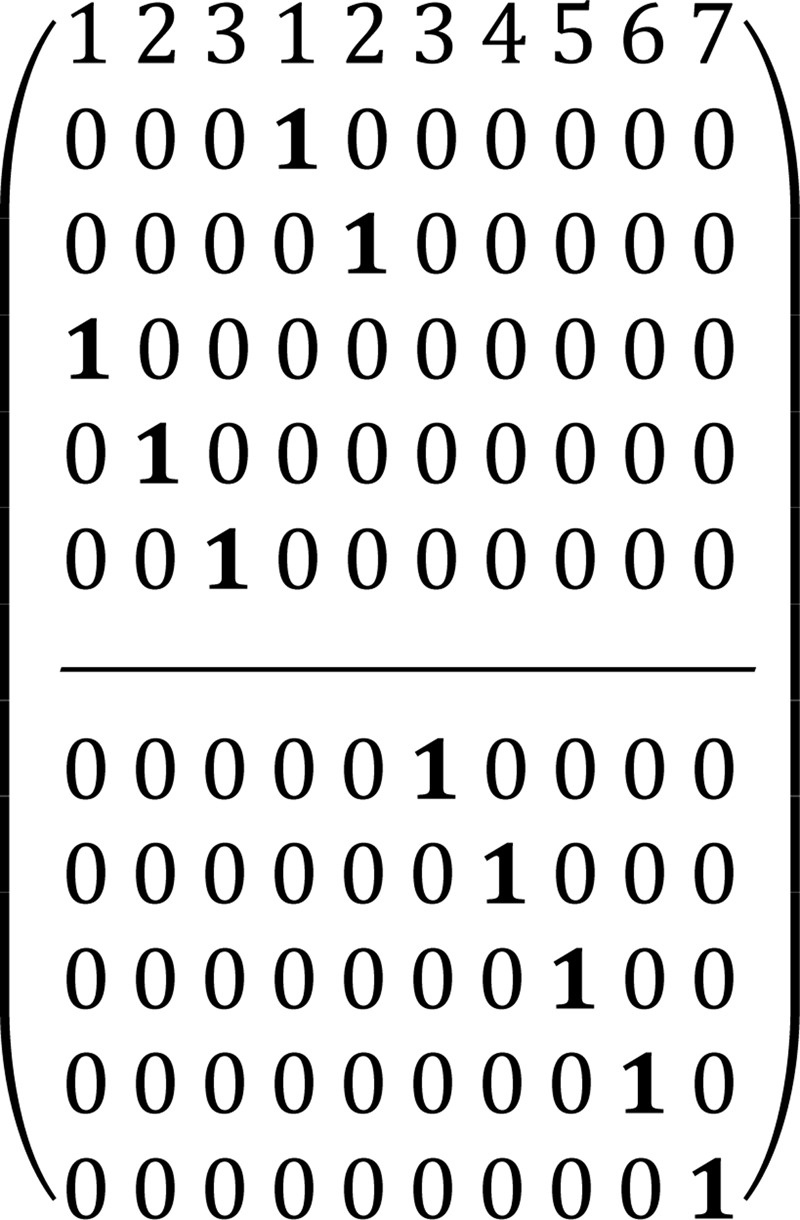
In this matrix the symbol “1” reflects a particular carbon transfer from substrates (the upper level of the matrix indicates carbon atoms of X5P and the lower level indicates carbon atoms of R5P) to products (numbers in the 1st row reflect carbon atoms of G3P from 1 to 3 and S7P from 1 to 7), and zero reflects no channeling between particular atoms in the metabolites. For the transaldolase reaction, S7P + G3P ⇔ E4P + F6P (E4P is erythrose 4-phosphate and F6P is fructose 6-phosphate), the corresponding ADM is shown in Matrix 2. Finally, for the transketolase 2 (TK2) reaction, X5P + E4P ⇔ G3P + F6P, the corresponding ADM is shown in Matrix 3.
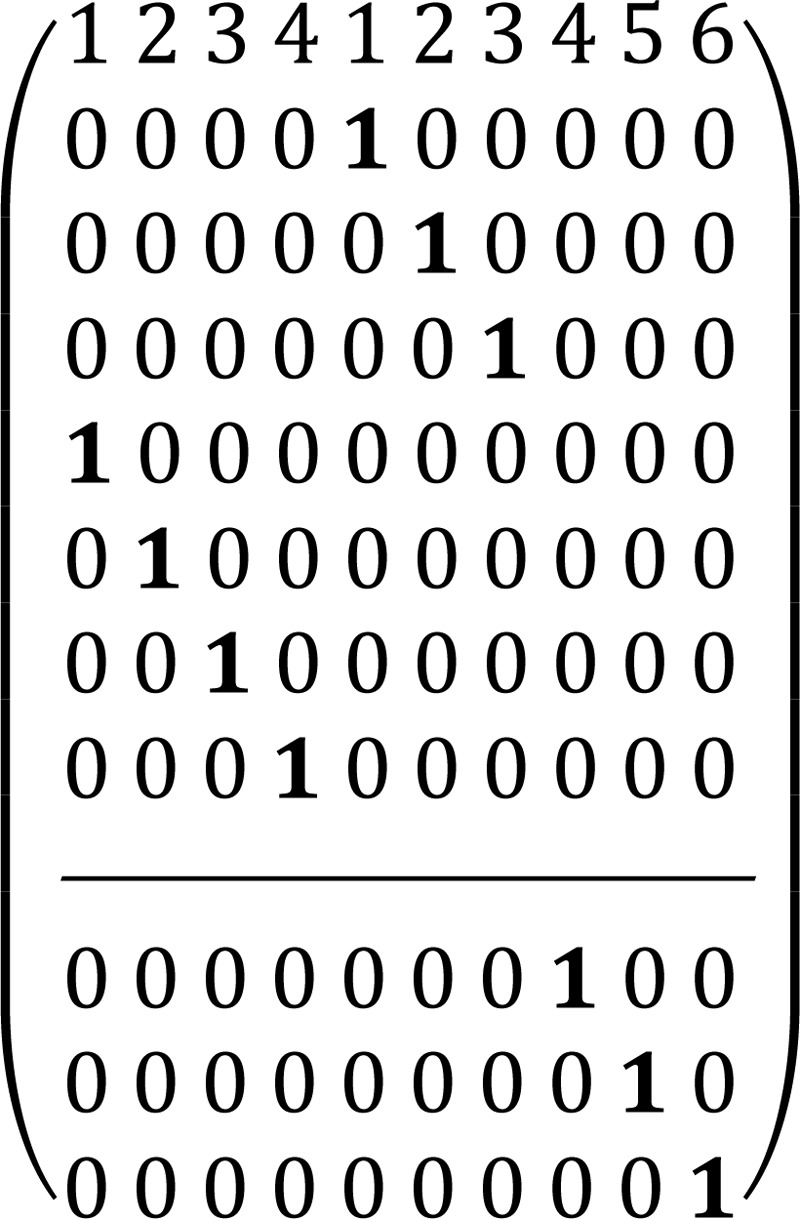
We accounted for the reversibility of every reaction by considering forward and reverse reaction steps through the non-oxidative PPP branch with a different extent of reaction reversibility for every reaction above. The system will still result in constant oxidative PPP net flux for every reaction. Overall, these matrices show that label at a particular 1st position of pentose 5-phosphate in the oxidative branch will result in the labeling of all carbon atoms in downstream metabolites such as pyruvate and lactate.
Metabolic and transport parameters as well as metabolite pool sizes used here are published elsewhere (36). For other parameters such as concentrations of the TCA cycle intermediates not reported in this reference, pool sizes were assumed to be in the range 0.1–0.2 mm. The total citrate pool size was assumed to be 0.5 mm with 20% in the mitochondria and 80% in cytosol. Pyruvate was assumed to be 20% in mitochondria. Sensitivity analysis (not shown here) verified that the chosen TCA cycle intermediate pool sizes did not affect extracted fluxes within 5% (even when modified by factors of 5 both above and below the assumed values).
Minimization of sum-of-squared residuals between simulated and experimental data was performed using Broyden-Fletcher-Goldfarb-Shanno, Levenberg-Marquardt, or Simplex algorithms. Proper mean square convergence was confirmed by verifying that goodness-of-fit values were close to expected theoretical values. The errors of the calculated parameters were estimated using Monte Carlo simulations with experimental noise levels (37). All numerical procedures were carried out in Matlab (Mathworks, Natick, MA).
In this study, LC-MS data have been utilized to compare fluxes under different conditions (e.g. hyperglycemia versus euglycemia) without detailed flux analysis (because no statistically significant change was observed between the different medium glucose conditions).
Results
31P NMR
A typical 31P spectrum is shown in Fig. 1B. The β-NTP resonance at −16.5 ppm was used to estimate the cell concentration. Other prominent resonances in the spectrum are α- and γ-NTP, diphosphodiesters, glycerophosphocholine, glycerophosphoethanolamine, inorganic phosphate, phosphocholine, phosphoethanolamine, and diphosphodiesters, including NADP(H). A broad hump emanating from immobilized phosphates from lipids dominates the central region of the spectrum. This broad peak can be removed by off-resonance saturation that is mediated by spin diffusion through the phospholipid semi-immobilized matrix, but this might modify resonance intensities of metabolites that are partially or transiently bound to membranes (38). We therefore have avoided off-resonance saturation. Other methods of removing the “hump” include fitting it with a spline function and subtracting the base line or subtracting the first spectrum and monitoring differences in peak intensities over time (39). The spectrum in Fig. 1B indicates the energy level of the tumor cells (measured by the intensity of the β-NTP peak). The level was measured before and after the time course of the 13C NMR experiment and was unchanged. Usually, the bioenergetic status of the cells is measured by the β-NTP/Pi ratio; however, in a bioreactor the Pi resonance is dominated by the Pi in the perfusate. The latter peak could be removed by applying strong gradients that dephase resonances of flowing metabolites (38, 40), but we have not applied this method here because it could lead to errors if removal of mobile resonances was incomplete.
Metabolic Fate of [1,6-13C2]Glucose in DB-1 Cells
Fig. 2 shows the entire metabolic network that is included in the current analysis (see under “Experimental Procedures” for details). 13C labeling results for DB-1 melanoma cells grown at a constant glucose level of 26 mm are shown in Figs. 1C, 3, and 4. Fig. 1C displays a 13C NMR spectrum that was obtained during the final 15 min of the experiment. Resonances were detected for C3 of lactate, C2, C3, and C4 of glutamate, C2 and C3 of aspartate, and fatty acyl carbons. With the glucose concentration clamped at 26 mm, lactate labeled at C3 (20.9 ppm) appeared in the spectrum within the first few minutes (Fig. 4A). The level of this resonance increased throughout the experiment but did not reach saturation. The time course of the intensity of this resonance is the combined result of the biological rate of lactate formation and the rate of washout of lactate due to the continuous addition of fresh medium and withdrawal of spent medium from the perfusion system. Fifteen minutes after introduction of labeled glucose, 13C incorporation was detected in C4 of glutamate (34.3 ppm); the full time course for labeling results for this resonance is shown in Fig. 3. The concentration increased in a linear manner for approximately 1 h. Subsequently, satellites were observed in this resonance indicating the presence of 13C-13C coupling between glutamate-C4 and glutamate-C3 (5). The rate of labeling of glutamate exclusively on C4 gradually slowed and reached close to steady state after ∼5 h. The level of glutamate labeled at both C3 and C4 continued to increase steadily throughout the experiment. Fig. 3, A and B, shows the labeling results for the glutamate-C3 resonance at 28.8 ppm. Over the 1st h, essentially no 13C labeling was detected in glutamate-C3. Subsequently, 13C labeling of glutamate-C3 increased linearly but did not reach saturation. Approximately two-thirds of the C3 glutamate carbon was coupled (predominantly to glutamate-C4). For glutamate-C2, label also first appeared approximately 1 h after the beginning of the experiment (Fig. 3, A and B). However, unlike glutamate-C3, only a singlet was observed for the first 3 h. Subsequently, a doublet appeared due to the presence of glutamate-C2,3 labeling. Such glutamate would be produced after carbon 1 was removed from glutamate-C3,4 during the third turn of the TCA cycle (5).
FIGURE 3.
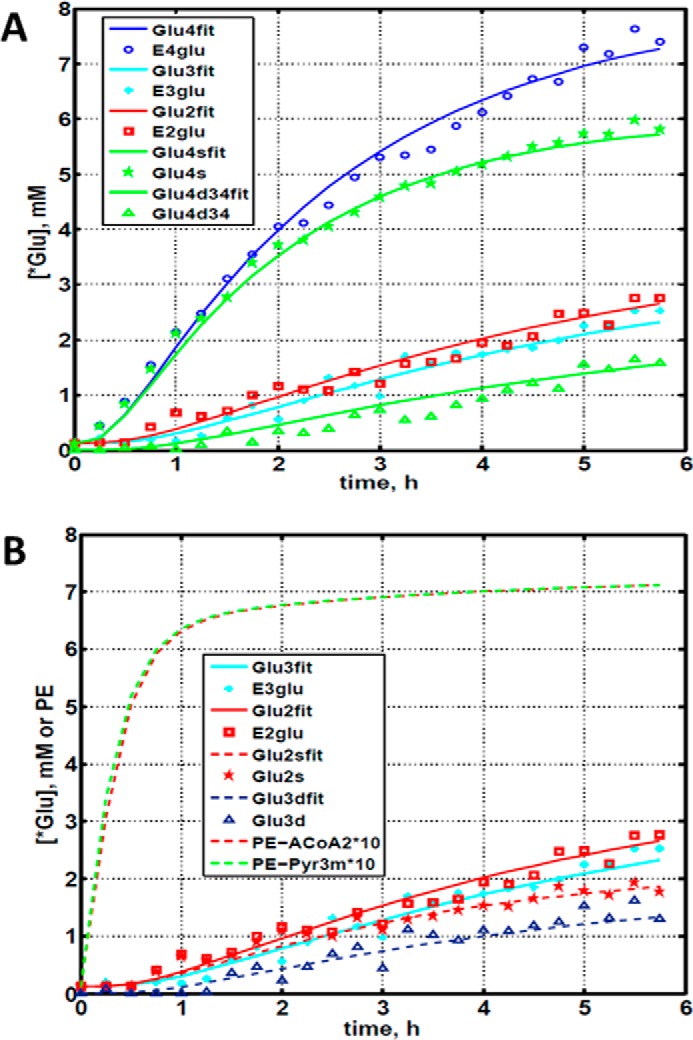
Time courses for labeling of glutamate during perfusion with medium containing [1,6-13C2]glucose. A, time course fits for labeling of glutamate (indicated with “fit” ending) at positions 4, 3, and 2. Glu4, 13C at glutamate-C4; Glu4s, singlet at glutamate-C4; Glu4d34, doublet at glutamate-C4; Glu2, 13C enrichment at glutamate-C2; Glu3, 13C at glutamate-C3. “fit” ending stands for the model fit and no-ending reflects experimental values. B, time course for labeling glutamate at positions 2 and 3. Fitted curves labeled with ending fit are Glu2 and Glu3 total; Glu2s, singlet at glutamate-2; Glu3s, singlet at glutamate-3; Glu3d, doublet at glutamate-3. PE stands for positional enrichment; this is predicted mitochondrial enrichment of acetyl-CoA at position C2 and mitochondrial Pyr at position C3 multiplied by a factor of 10. Curves are fit, and points are experimental data.
FIGURE 4.
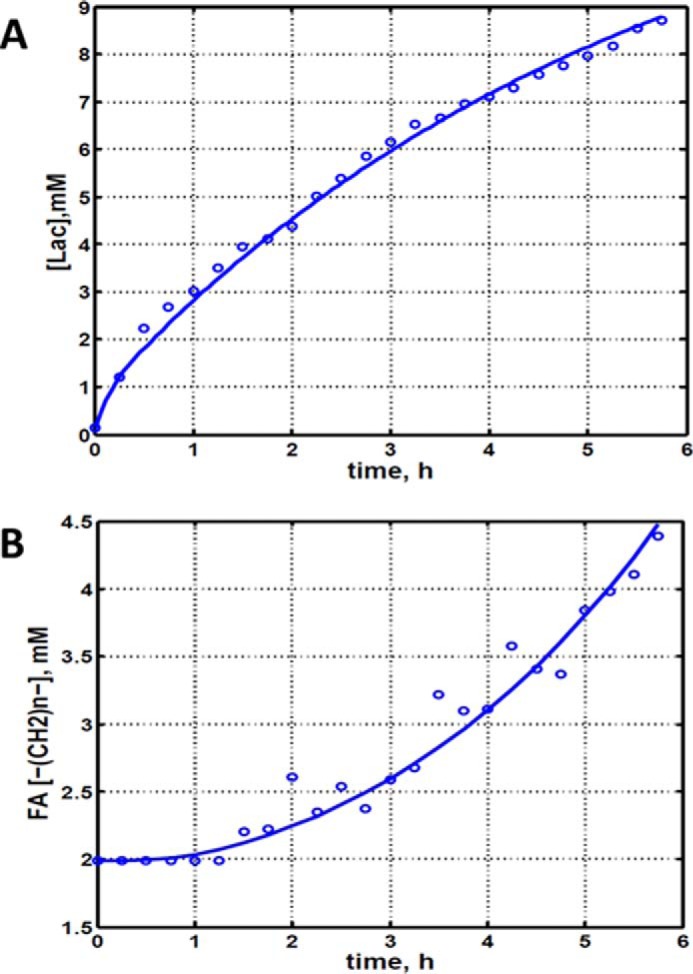
Experimental data and least squares fit of time course for labeling of lactate-C3 and fatty acyl methylene (–(CH2)n–) resonance in proliferating DB-1 melanoma cells during perfusion with medium containing [1,6-13C2]glucose and unlabeled glutamine. A, time course for labeling of total lactate-C3 (medium + intracellular). B, de novo lipogenesis in melanoma cells. Time course for labeling of fatty acyl methylene (–(CH2)n–) resonance.
Labeling was also observed in long chain fatty acids at ∼30 ppm, indicating that DB-1 melanoma cells produce lipid de novo from glucose (see Fig. 4B). This result is consistent with results for other cancer cell lines grown in culture (19). Small amounts of labeling were observed in aspartate-C2 and C3. No label was observed for any carbon of alanine, probably due to low total concentrations of alanine; this result is unusual because most cancer cell lines produce 13C-labeled alanine from glucose (19, 20). Resonances were observed in regions associated with the glycerol backbone of phospholipids in triglycerides at ∼65 ppm. This region also contains resonances associated with glycolytic intermediates.
Quantifying Bionetwork Fluxes
Our biochemical network model was used to fit 13C NMR DB-1 melanoma data acquired during continuous perfusion of cells with [1,6-13C2] glucose in the bioreactor depicted in Fig. 1A. The experimental data from isotopomer time courses was converted to 13C-metabolite concentration curves (Figs. 3 and 4). Furthermore, to minimize the bias introduced by using multiplets with low signal to noise ratio, only those multiplets with end point concentrations greater than 0.5 mm were used in the fitting procedure. The remaining experimental multiplets were used as reference points for visually examining the fit predicted for low intensity curves to experimental data but not actually calculating the goodness of fit of these metabolite resonances, whose noise levels were expected to be high (not shown here). To quantify fluxes in central metabolism, we combined four types of measurements as follows: three sets of time courses of 1) glutamate isotopomers (multiplets); 2) total lactate-C3 labeling; 3) acyl groups of fatty acid resonances determined by NMR in situ; and 4) steady-state 13C NMR lactate isotopomers. The fitted time courses were as follows: Glu4Tot (where Tot is total), Glu4s, Glu4d34, Glu3Tot, Glu3d, Glu2Tot, Glu2s, Lac3Tot, and acyl methylene (–(CH2)n–) resonance, yielding a total of nine curves. Estimation of the model-free parameters was achieved by fitting labeled patterns of glutamate, lactate, and fatty acid acyl methylene groups. The extracted flux values are presented in Table 1 and in the flux map (see Fig. 5). Flux confidence intervals were calculated by Monte-Carlo simulations (see Fig. 6A, only four fluxes are shown) and are summarized in Table 1.
TABLE 1.
Extracted fluxes using bonded cumomer modeling
| Reaction | Fluxa |
|---|---|
| mmol/liter-cell/h | |
| Pentose phosphate pathway (oxidative branch), net PPP FpppOx | 3.3 ± 72% |
| Transketolase 1 (exchange) relative to glycolysis, TK1 | 21 ± 56% |
| Transketolase 2 (exchange) relative to glycolysis, TK2 | 0.5 ± 90% |
| Transaldolase (exchange) relative to glycolysis, TA | 44 ± 64% |
| Glucogenic amino acids contribution to pyruvate, FGAA | 5.0 ± 20% |
| TCA cycle rate, FTCA (isocitrate → α-Kg) | 10.9 ± 8% |
| Exchange, Mal-Asp shuttle, Fx (reversible) | 11.3 ± 19% |
| Pyruvate carboxylase flux, Fpc | 0.6 ± 51% |
| Anaplerotic exchange flux at succinyl-CoA, Fxana | 3.0 ± 15% |
| Net anaplerotic flux to the TCA cycle, dFana | 4.3 ± 15% |
| Flux of ketogenic AA and FA to acetyl-CoA formation, Fkaa | 0.1 ± 19% |
| Glutaminolysis flux, Fgls | 0.05 ± 60% |
| Pyruvate dehydrogenase flux, Fpdh | 10.8 ± 16% |
| Citrate synthase flux, Fcs | 11.5 ± 14% |
| Net fumarase activity, Fum → Mal, Ffum | 15.3 ± 16% |
| Fatty acid synthesis, Ffas | 0.59 ± 15% |
| Mitochondrial pyruvate transport, Fmpc | 7.1 ± 23% |
| Malic enzyme (mitochondrion), ME2 + ME3, Fmem | 4.3 ± 12% |
| Malic enzyme (cytosolic), ME1, Fmec | 0.6 ± 15% |
| Aspartate efflux, dFxasp | 0.06 ± 45% |
| Production flux of ATP, glycolytic, Warburg, FatpCyt | 150 ± 13% |
| Production flux of ATP, mitochondrial, oxphos, FatpOx | 154 ± 12% |
| Warburg parameter (net LDH/MPC flux ratio) | 21 ± 24% (unit-less) |
| Combined glycolysis and PPP flux from G6P to pyruvate | 152.1 ± 12% |
| Glutamine consumption flux (for protein, nucleotides, amino acids, glutathione, etc.) | 4.9 ± 10%b |
| Net LDH activity, Pyr → Lac, FLDH | 150 ± 12% |
| Lactate transport, Vmaxlac | 395 ± 12% |
| Lactate transport, Michaelis-Menten parameter, Km | 3.5 mm ± 70% |
a Calculated fluxes are expressed in mmol/liter-cell/h with relative standard deviations in percent for pathways shown in Fig. 2. Warburg parameter is the ratio of the net flux through lactate dehydrogenase (LDH) to the mitochondrial pyruvate carrier influx (MPC).
b Standard deviation was estimated based on experimental measurements of glutamine consumption.
FIGURE 5.

Metabolic flux map and energy metabolism with predicted oxygen consumption rate MRO2 in the human melanoma DB-1 bionetwork at hyperglycemia and normoxia. Numbers indicate net fluxes in mmol/liter-cell/h. See Table 1 for definitions and values of the derived fluxes. Reversibility for SDH, Fumarase, and MDH was taken into account as 10% of the direct flux. Varying the extent of reversibility in the range 5−30% does not change extracted fluxes within several percent (results not shown).
FIGURE 6.
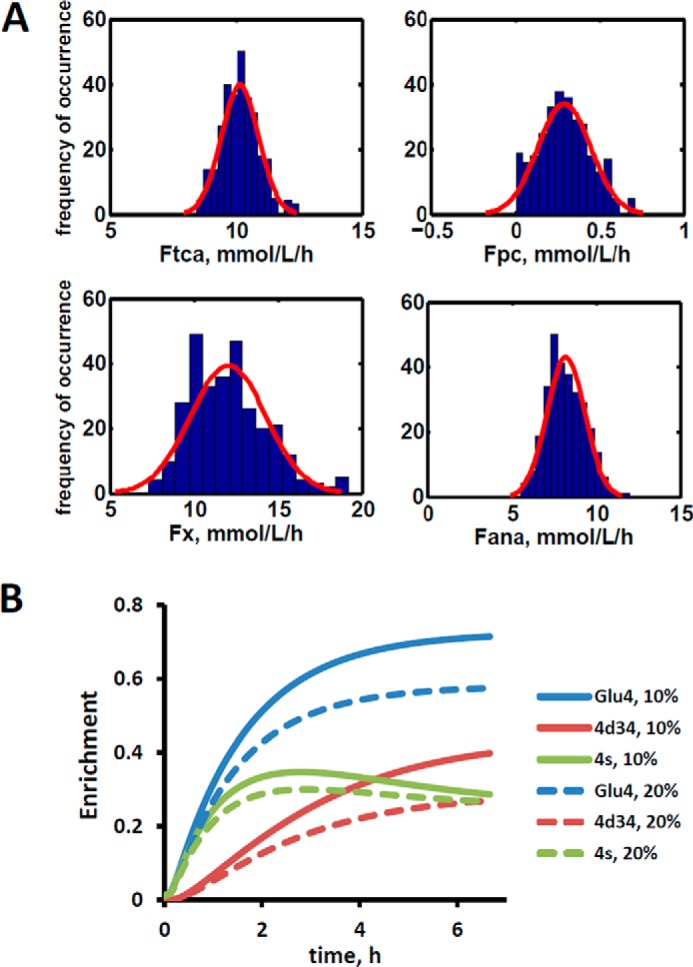
Confidence intervals revealing the extracted fluxes and the sensitivity analysis for glutaminolysis pathway. A, Monte Carlo simulation of relative standard deviations (Rsd) of parameters estimated in fitting of data in Fig. 3 to the bonded cumomer model. The experimentally estimated noise level was 0.2 mmol/liter-cell. For example, relative standard deviation for TCA cycle flux RsdFtca = 8% and for pyruvate carboxylase flux RsdFpc = 51%. See Table 1 for definitions and values of the derived fluxes. The red line represents a Gaussian distribution. Only four fluxes are shown. B, sensitivity analysis for glutaminolysis pathway during perfusion with medium containing [1,6-13C2]glucose and unlabeled glutamine. Data show simulated 13C turnover curves for glutamate C4 (Glu4) and its multiplets 4s and 4d34 for different values of net glutaminolysis flux Fgls when glutaminolysis is first set to 20% of the value of the TCA flux (dashed lines) and then to10% of the TCA flux (solid lines). The glutamate C2 and C3 multiplets were also sensitive (results not shown). All other fluxes are kept constant. The glutamate doublet 4d34 is the most sensitive glutamate multiplet to the glutaminolysis net flux.
Quantifying ATP Production Routes
The predicted fluxes were used to calculate contributions of glycolysis and oxidative phosphorylation to ATP production. We assumed that the oxidative phosphorylation phosphate to oxygen ratio equals 2.5 for NADH and 1.5 for FADH2 oxidation. To assess the contribution of glucose, fatty acids (FA) and glucogenic amino acids, and glutamine to generating reducing power, we calculated the fluxes for each of these metabolites. For each of the above substrates, we calculated the NADH/FADH2 reaction flux based on the different labeling patterns that we were able to track both from the labeled and unlabeled carbon atoms. The combined cytosolic ATP production flux was 150 mmol/liter-cell/h, and the mitochondrial compartment produced 154 mmol/liter-cell/h due to oxidative phosphorylation. The results are presented in Table 1.
Pentose Phosphate Pathway (PPP)
We fitted 13C NMR steady-state lactate multiplets acquired after an 8-h incubation of DB-1 cells with [1,2-13C2]glucose tracer. The experimental 13C NMR spectra and the results of fitting are shown in the Fig. 7. The extracted fluxes relative to glycolytic flux are presented in Table 1. Flux standard deviations were calculated by Monte-Carlo calculations. Flux through the oxidative PPP was estimated to be 3.6% of the glycolytic rate. Given the extensive experimental data that have been obtained for the lactate 13C NMR multiplets, we were also able to estimate non-oxidative exchange fluxes (the smaller rates of each reversible reaction) of the classical PPP (Fig. 2), which are presented in Table 1. Transketolase 1 and transaldolase exchange fluxes in the non-Ox PPP branch were consequently relatively high at 21 and 44%, respectively, and transketolase 2 activity was close to zero. The flux standard deviations (Table 1) demonstrate that all fluxes through the PPP were resolved but with relatively poor resolution (when using only 13C NMR isotopomers of lactate as a reporter molecule). NADPH production flux via the oxidative PPP pathway was estimated to be 6.6 mmol/liter-cell/h. At the end of this experiment, we measured glucose and lactate concentration in the flask experiments. Glucose concentrations under euglycemic conditions were unchanged within 30%.
FIGURE 7.
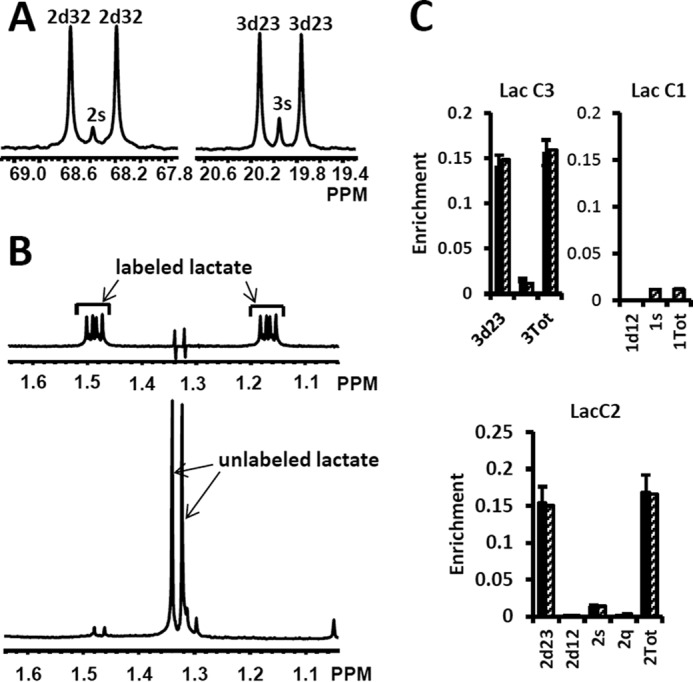
High resolution 13C and 1H NMR spectra of lactate from DB-1 cells incubated with [1,2-13C2]glucose and experimental lactate multiplets versus fit. A, 13C NMR spectra. The left panel shows the NMR spectrum at the chemical shifts around lactate C2, and the right panel shows the spectrum around lactate C3. 2s, lactate singlet at C2 position; 2d32, lactate C2 doublet with carbon coupling between the carbon 2 and 3 positions; 3s, lactate singlet from the C3 position; 3d23, lactate C3 doublet with carbon coupling between the carbon 2 and 3 positions. B, proton-observed carbon-edited 1H NMR spectra. The upper panel shows the labeled lactate, and the lower panel shows the unlabeled lactate. C, experimental multiplet fraction (left bars, black) versus fitting (right bars, patterned) for lactate C3 and C2, and the predicted lactate C1 multiplets, based on the evaluated oxidative and non-oxidative branches of the PPP. Error bars indicate standard deviation. The extracted oxidative PPP flux and the relative exchange fluxes for transketolases and aldolase are presented in Table 1.
Quantifying Glutaminolysis Flux
Our recent focus has turned to refinement of the details of glutaminolysis because of its critical role in the metabolism of many malignancies. For example, one glutamine molecule could produce up to 22.5 ATP molecules. Therefore, even a small amount of glutaminolysis can have a major effect on the bioenergetics of cancer cells. In DB-1 melanoma under hyperglycemic conditions, glutamine uptake flux ranged up to 50% of the TCA cycle flux. Under euglycemic conditions, glutamine uptake doubled reaching approximately the same level as TCA cycle flux. Glutamine uptake can lead to protein synthesis, glutathione synthesis, or nucleotide synthesis as well as to ATP production by the glutaminolysis pathway (see below) or to cytosolic reductive carboxylation driven by glutaminase 1 (GLS; it is considered to be present both in mitochondria and cytosol) or other glutamine-glutamate conversion enzymes in cytosol and isocitrate dehydrogenase 1 (IDH1) (41). It was, therefore, important to refine the metabolic analysis of DB-1 melanoma to accurately assess the contributions of the glutaminolysis pathway in these tumor cells (see Fig. 2). To quantify the glutaminolysis contribution to energy production, we modified the bionetwork by simultaneously allowing net glutamine influx into mitochondria through glutaminase 1 and 2 (GLS and GLS2) (Fig. 2).
“Classical” glutaminolysis includes uptake of glutamine by the cell, transport to mitochondria, conversion to glutamate through mitochondrial glutaminase 1 or 2 (GLS and GLS2), entry into the TCA cycle to α-ketoglutarate via glutamate dehydrogenases 1 and 2 (GLUD1 and GLUD2) or via mitochondrial aminotransferases (GPT2 and GOT2), traversing to oxaloacetate, and exiting as pyruvate or aspartate. Alternatively, glutaminolysis could partially occur in the cytosol by producing glutamate or α-ketoglutarate from glutamine and eventually by entry of those metabolites into the TCA cycle as α-ketoglutarate. Further flux in the TCA cycle then moves to malate where malate-pyruvate cycling occurs (Fig. 2). There are two pathways for pyruvate-malate cycling. One pathway involves conversion of malate via mitochondrial malic enzyme (ME2) to pyruvate; it then returns to oxaloacetate via pyruvate carboxylase or it can go from pyruvate to acetyl-CoA leading to citrate. The second pyruvate cycling pathway goes from malate in the mitochondria through a transporter into the cytosol and from there to cytosolic pyruvate via cytosolic malic enzyme (ME1). The cytosolic pyruvate can return to the mitochondria through the mitochondrial pyruvate carrier or it can be converted to alanine via alanine-aminotransferase (GPT1) or to lactate via lactate dehydrogenase. The BC approach can distinguish between these pyruvate-malate pathways or their combinations under real conditions (Fig. 2).
We continue the analysis of data of DB-1 melanoma cells treated with [1,6-13C2]glucose as the tracer. Dynamic analysis indicates that the curves resulting from fitting of the C4-labeled glutamate multiplets, particularly the glutamate 3,4-doublet, Glu4d34, resulting from simultaneous labeling of C3 and C4 (during the second TCA cycle turn) and the singlet resulting from glutamate labeling exclusively at C4 (during the first turn of the TCA cycle), are very sensitive to flux through the glutaminolysis pathway even when only natural abundance medium-derived glutamine has been used. See for example Fig. 6B, where the separation and shape of the glutamate C4 total and the glutamate C4 singlet and 3,4-doublet, Glu4d34, curves change dramatically when anaplerotic flux from glutamine increases from 10% of the TCA flux to 20%. This indicates that glutamate labeling kinetics is sensitive to glutaminolysis flux and that there is no need to purchase or synthesize exotically labeled glutamine (with 13C, 15N, or 2H labeling) to evaluate glutaminolysis.
We then evaluated the contribution of glutaminolysis flux to overall energy production of DB-1 melanoma cells. We found that for this tumor line, glutaminolysis flux through the truncated TCA cycle and via pyruvate-malate cycling by malic enzyme ME2 is essentially zero. This conclusion resulted directly from the ability of the model to detect glutaminolysis flux by fitting of data on the glutamate multiplets (see above). To further confirm this conclusion, we forced the model to accommodate glutaminolysis flux between 5 and 20% of the TCA cycle flux. Invariably, this grossly deteriorated the goodness-of-fit of the isotope kinetic data to the model (results not shown).
Even though glutaminolysis does not contribute to the mitochondrial ATP production, there is still substantial mitochondrial malic enzyme flux (combined activities of NADH producing ME2 and NADPH producing ME3), which is equal to ∼40% of the TCA flux (see Table 1).
Effect of Hyperglycemia/Euglycemia on Glutamine and Fatty Acid Metabolism
The mass isotopomer distribution of several TCA cycle metabolites from [U-13C5,15N2]glutamine labeling experiments is shown in Fig. 8 at different glucose concentrations in the medium, at 5 mm for euglycemia and 25 mm for hyperglycemia. With this tracer, increased glutaminolysis flux resulted in increased abundance of the M + 4 mass isotopomer of citrate, succinate, and malate (41), whereas reductive carboxylation resulted in increased M + 3 for malate, M + 4 for succinate, and M + 5 for citrate. Reductive carboxylation and increased glucose contribution to the fatty acid production also disturbs the acetyl-CoA mass isotopomer distribution. Fig. 8 clearly shows that there are no significant differences in labeling patterns of all four metabolites. Consequently, based on bioreactor data, we can exclude any major change in glutaminolysis flux as well as for fatty acid production under hyperglycemic versus euglycemic conditions.
FIGURE 8.
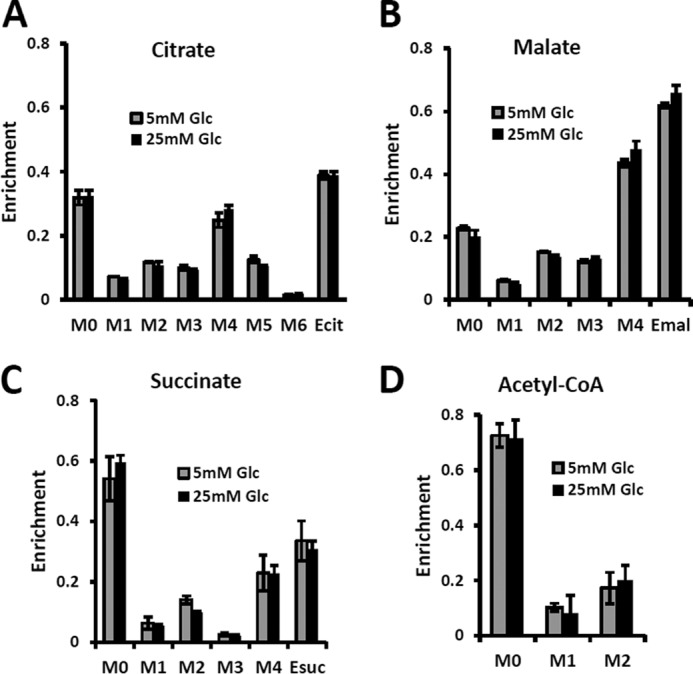
Mass isotopomer distribution for the TCA cycle intermediate and acetyl-CoA measured at hyperglycemic and euglycemic conditions during [U-13C5]glutamine labeling. Mass isotopomer distribution (MID) of A, citrate; B, malate; C, succinate; and D, acetyl-CoA. The figure clearly demonstrates that there are no significant differences in labeling patterns of key metabolites (p value was always >0.05) between 5 mm glucose and 25 mm medium glucose conditions.
Quantifying de Novo Lipogenesis Flux in DB-1 Cells
During culturing of DB-1 cells with [1,6-13C2]glucose, progressive labeling of fatty acids was observed for multiple resonances (see Figs. 1C and 4B). FA synthesis occurs first by cytosolic citrate production from glucose and through reductive carboxylation in the cytosol from glutamine through isocitrate dehydrogenase (IDH1 isoform). By ATP citrate lyase, cytosolic citrate is converted to oxaloacetate and cytosolic acetyl-CoA, which is converted further to malonyl-CoA by the rate-limiting acetyl-CoA carboxylase (ACC-β) and through fatty acid synthases to elongated precursors via sequential addition of acetyl-CoA, eventually leading to palmitate production. Palmitate is further elongated or desaturated to produce numerous other FAs. To address de novo FA flux production, we utilized the BC model with cytosolic FA and their precursors as well as membrane fatty acids as the second FA pool. We calculated FA content based on the total FA content of ∼20% of cell dry weight of 200 mg/109 cells (5 × 10⁸ cells = 1 ml). Total FA content referenced to palmitate is at the level of several tens of mmol/liter-cell. We iteratively varied the ratio of cytosolic to membrane FA and found the best fit at ∼10 times more FA in the cytosolic membrane compartment (Fig. 4B). The de novo flux of conversion of glucose to FA was 0.59 mmol/liter-cell/h, and NADPH consumption flux in FA biosynthesis was 8.4 mmol/liter-cell/h.
Model Validation
As validation of the inferred/extracted fluxes, we measured the MRO2 with polarographic oxygen probes during the perfusion experiment. The fluxes obtained by fitting of dynamic 13C data produced good agreement between the experimentally observed MRO2, 33 mmol/liter-cell/h, and the calculated MRO2, 32 mmol/liter-cell/h (see Table 2). The experimental total glutamate concentration was 8.6 mm. Assuming the glutamate concentration to be a fitted parameter, we calculated this parameter and obtained a value of 9.2 mm in good agreement with the experimental concentration. The measured glucose consumption rate (MRGlc) was 90 mmol/liter-cell/h, whereas the predicted MRGlc was 78 mmol/liter-cell/h. Simultaneously, the measured lactate production flux (MRlac) was 155 mmol/liter-cell/h, whereas the predicted MRlac was 150. We note that we did not use experimentally measured fluxes as constraints in our bonded cumomer metabolic flux analysis.
TABLE 2.
Experimental data compared with calculated values determined by dynamic bonded cumomer modeling
Flux values are in mmol/liter-cell/h, and concentrations are in mm.
| Reaction | Experimental data | Calculated values |
|---|---|---|
| Oxygen consumption, MRO2 | 33 | 32 |
| Glucose uptake, MRGlc | 90.0 | 78a |
| LDH activity, Pyr → Lac, Fldh | 155.0 | 150 |
| Glutamine uptake, FGln | 5.0 | –b |
| Glutamate concentration | 8.6c | 9.2 |
a The difference between experimental and calculated glucose consumption rates is due to glycogen production that is not included in the metabolic network model.
b The flux was not estimated since glutamine is consumed in numerous reactions that were not included in the analysis.
c The glutamate concentration was measured at the end of the bioreactor experiment by cell extraction and LC-MS analysis.
Table 3 compares glucose and glutamine uptake under euglycemic (6 mm glucose) and hyperglycemic (23 mm) conditions. Under euglycemic conditions, glutamine influx approximately doubles, whereas glucose consumption remains essentially unchanged. Table 4 shows the glucose and lactate concentrations at the end of experiments at different glycemic conditions conducted in the flask experiments for mass spectrometric measurements. Glucose concentrations were unchanged within 30% under euglycemic conditions and within 5% under hyperglycemic conditions. Finally, we were able to generate a flux map (Fig. 5). This figure shows the extracted metabolic fluxes with the predicted MRO2. Numbers indicate fluxes in mmol/liter-cell/h. See Table 1 for definitions and values of the derived fluxes.
TABLE 3.
Experimental glucose and glutamine consumption fluxes under euglycemic (6.4 mm) and hyperglycemic conditions (23.2 mm in medium)
Glutamine = 3.0 mm at low glucose and 3.4 mm at high glucose. FGlc, glucose consumption flux (mmol/109cells/h) and FGln, glutamine consumption (mmol/109cells/h). Flux ratios were FGlc/FGln = 22.4 at high glucose and FGlc/FGln = 13.5 at euglycemia.
| Glutamine flux | Glucose flux | |
|---|---|---|
| Euglycemia (6.4 mm) | 0.064 | 0.86 |
| Hyperglycemia (23.2 mm) | 0.035 | 0.79 |
TABLE 4.
Experimental medium glucose and lactate concentrations under euglycemic (5.1 mm glucose in medium) and hyperglycemic conditions (25.0 mm) after 8-h incubation
| Glucose concentration | Lactate concentrationa | |
|---|---|---|
| Euglycemia (5.1 mm) | 3.6 ± 0.1 | 5.0 ± 0.2 |
| Hyperglycemia (25.0 mm) | 23.4 ± 0.1 | 5.5 ± 0.3 |
a Initial medium lactate concentration was 1.8 mm for euglycemic conditions and 2.0 mm for hyperglycemia.
Discussion
Measuring the relative glycolytic and oxidative capacity of specific tumors plays an important role in development of strategies for treating neoplasms and for monitoring tumor response to specific therapeutic agents. For this reason, development of a non-invasive method for quantifying the fraction of ATP production by tumors that occurs by glycolytic and mitochondrial metabolism would be useful in the management of cancer and tailor-fitting of therapeutic regimens to the needs of individual patients. In addition, various other pathways of tumor metabolism play critical roles in tumor proliferation by providing additional energy sources and essential precursors for cell replication. Our goal was to develop a method for quantitating tumor intermediary metabolism in cells and with some extension in animal tumor models and human cancer patients.
One of our key objectives was to validate the bonded cumomer modeling technique as a method for measuring fluxes through key pathways of tumor energy production. This is best accomplished by comparing model predicted parameters with independently measured experimental parameters as has been demonstrated previously by Chatham et al. (6) for the cardiac TCA cycle model of Chance et al. (5) and Jeffrey et al. (7) for the isotopomer model of the heart. Table 2 compares model-predicted and experimentally measured parameters. There is excellent agreement between the predicted MRO2 (32 mmol/liter-cell/h) and the experimentally measured rate of oxygen consumption (36 mmol/liter-cell/h). The experimental and predicted rates of glucose uptake agree within 7%. The experimental and predicted pyruvate to lactate fluxes, 149 and 150, respectively, agree within ∼1% and glutamate pool sizes within 7%. Overall, this excellent agreement between model-predicted and experimental data validates the BC model.
ATP production fluxes were calculated assuming a phosphate to oxygen ratio of 2.5 for NADH and 1.5 for FADH2 (42). Under hyperglycemic conditions, the average ATP production rates were MRATP (mitochondrial) = 154 mmol/liter-cell/h and MRATP (glycolytic) = 150 mmol/liter-cell/h which indicates that 51% of the energy was produced by oxidative phosphorylation and 49% was from glycolysis. Based on the similarity of isotopomer labeling patterns under hyperglycemic and euglycemic conditions (Fig. 8), we expect no significant change in glycolytic and oxidative metabolism under these conditions. High fluxes of pyruvate mitochondrial transport (∼70% of the TCA cycle activity) and mitochondrial ATP production are promoted by the melanoma-associated BRAF mutation. Recent work (43) has demonstrated that BRAF V600E mutated melanoma cells exhibit increased pyruvate entry through the activated PDH complex. PDH flux (∼106% of the TCA flux) is regulated by inhibitory phosphorylation mediated by PDH kinases (PDK) and PDH phosphatases (PDP). The oncogene BRAF V600E causes concerted activation of the PDH complex by down-regulation of PDK1 expression and up-regulation of PDP2 thereby promoting oxidative pyruvate utilization and leading to increased cellular respiration.
There has been considerable interest in glutamine metabolism as a key source of tumor energy production linked to c-Myc expression (21, 44–47). Our model of tumor metabolism (Fig. 2) contains a specific glutamine transporter on the cell membrane. The classical model of glutaminolysis includes an additional specific glutamine transporter on the mitochondrial membrane that leads to mitochondrial glutaminase (GLS2 or GLS), which converts glutamine to glutamate, which is then converted to α-ketoglutarate by enzymes such as glutamate dehydrogenase (GLUD1 and -2). Two additional transaminases can carry out the glutamate–α-ketoglutarate exchange, aspartate aminotransferase, and alanine aminotransferase. The α-ketoglutarate then produces reducing equivalents via the oxidative branch of the TCA cycle leading to ATP production by oxidative phosphorylation. Various pathways, including the malate-aspartate shuttle, pyruvate carboxylase, malic enzyme, and phosphoenolpyruvate carboxykinase (PEPCK1 and -2) all contribute to metabolism of the glutamine carbon atoms. As noted previously, glutamine metabolism can lead to production of 22.5 molecules of ATP per glutamine molecule. In the case of DB-1 melanoma cells under hyperglycemic conditions, glutamine influx constituted about 50% of the TCA cycle flux, with about double this level of glutamine uptake under euglycemic conditions (Table 3). However, the transaminase reactions are reversible and may exhibit high exchange flux in both directions even with very little net glutamine uptake by the TCA cycle and nearly no energy production from the glutaminolysis pathway in DB-1 cells. It is important to note that because carbon atoms of glutamate originating from glucose will be isotopically labeled (first on C4 position and then on C2 and C3 etc.), whereas carbons coming from glutamine will be unlabeled, it was possible to distinguish the two pools of carbon atoms originating from these two substrates. The data fitting clearly indicated that the net flux from glutamine being metabolized via the TCA cycle was very small.
We also conducted a sensitivity analysis to show that using [1,6-13C2]glucose tracer alone suffices to reliably calculate glutaminolysis flux in malignant cells and tissues. Fig. 6B shows that the glutamate C4 doublets due to C3-C4 coupling (Glu4d34) are sensitive to net flux of unlabeled glutamine entering the TCA cycle; even a 10% difference in flux produces a clearly detectable shift in these curves. Fitting analysis indicated that there was little net influx from glutamine into the TCA cycle. Note also that this conclusion can also be reached from 13C NMR data without the use of labeled glutamine.
By contrast, some investigators utilizing mass spectrometry have equated glutamine uptake minus glutamate release with net glutaminolysis flux (48). In this case, the net influx of glutamine is ∼5 mmol/liter-cell/h, which, if it were equated with glutaminolysis flux, would have been interpreted as 113 mmol/liter-cell/h of ATP per h or about 75% of the glycolytic production of ATP. Under euglycemic conditions, which produce about twice the level of glutamine uptake, such an analysis would have attributed about 50% higher ATP production to glutaminolysis than to glycolysis, and most of the tumor energy production would have been attributed to glutaminolysis. This is incorrect in our case; in reality the net glutaminolysis flux under hyperglycemic conditions is ∼0.1 mmol/liter-cell/h or ∼2 mmol of ATP/liter-cell/h or ∼1% of the glycolytic ATP production rate. Bonded cumomer analysis provides a method for making this crucial distinction. Our labeled LC-MS data for the TCA cycle intermediates with [U-13C5,U-15N2] glutamine confirmed that no glutaminolysis occurred under euglycemic conditions versus hyperglycemia (Fig. 8). The absence of change in glutaminolysis or reductive carboxylation flux is evident from similar mass isotopomer distributions of several key metabolites. Our finding of nearly zero glutaminolysis flux contradicts Scott et al. (49), who, on the basis of glutamine uptake and label appearance in some TCA cycle metabolites, concluded that glutamine was utilized as an anaplerotic substrate of several human melanoma lines. However, these authors did not conduct a rigorous metabolic modeling analysis to measure flux through the TCA cycle. Consequently, they were unable to distinguish between actual flux through the cycle via glutaminolysis and exchange labeling between α-ketoglutarate and glutamate without any net flux. In addition, glutamine could be used for many other metabolic processes besides energy production, e.g. protein, nucleotide, and hexosamine synthesis.
If the net uptake of glutamine is 5 mmol/liter-cell/h with negligible contribution to energy production, glutamine must be contributing primarily to anabolic processes such as amino acid, nucleotide, and protein production as well as to de novo lipogenesis. Although glutamine-derived carbons have been unlabeled, we have monitored lipogenesis by 13C NMR detecting methylene carbon acyl groups originating from labeled glucose (Figs. 1C and 4B). Table 1 indicates that de novo lipogenesis corresponds to ∼6% of the TCA cycle flux under hyperglycemic conditions. However, this does not include possible direct contributions from unlabeled glutamine (i.e. through cytosolic reductive carboxylation by isocitrate dehydrogenase IDH1 or mitochondrial IDH2) and potentially from the cytosolic acetyl-CoA synthetase 2 (ACSS2) reaction (50).
This modest flux for de novo fatty acid synthesis requires a large contribution of NADPH cofactor production (∼8.3 mmol/liter-cell/h). NADPH could be produced by the oxidative branch of the PPP, malic enzyme, or isocitrate dehydrogenase activities or by serine-glycine one-carbon metabolism (folate metabolism). Our calculated malic enzyme activities in mitochondria (even if all this activity is represented by ME3) would account for 4.3 mmol/liter-cell/h, and cytosolic NADPH flux (ME1, 0.6 mmol/liter-cell/h) would not account for the required high level of NADPH flux. A recent elegant study (51) suggested that in some cancers folate metabolism is the largest source of NADPH. Based on these data (52), we estimated that the serine-glycine one-carbon metabolism pathway cannot account for the required NADPH consumption. In the light of our 13C NMR lactate labeling data, the oxidative branch of the PPP is the main source of NADPH in these cancer cells (6.6 mmol/liter-cell/h). This constitutes ∼80% in agreement with the NADPH consumption rate during fatty acid biosynthesis. Thus, the flux through the oxidative PPP appears to be ∼80% sufficient to supply all of the NADPH required for fatty acid production and is the main supplier of reducing equivalents in DB-1 melanoma. A 20% difference in the rates of NADPH production and consumption indicates that alternative sources of NADP+ reduction, considered above, need to be taken into account. We also found that mitochondrial pyruvate-malate cycling was very high (4.3 mmol/liter-cell/h). This could also contribute to defense against reactive oxygen species by producing sufficient NADPH via ME3.
In summary, we have validated a novel method, bonded cumomer analysis, for determining fluxes through specific pathways of tumor energy metabolism. This method can be applied to studies of perfused tumor cells in bioreactors or, with some modifications, to in vivo studies for non-invasive investigation of the metabolism of tumors in animals or humans. The transition from isolated cells to in vivo rodent models and humans is not simple and seamless, but it is feasible. The interested reader experienced in metabolic modeling might pursue similar objectives using the methods outlined in this study together with mathematical methods and metabolic models referenced herein (53).
Author Contributions
The study was conceived and coordinated by J. D. G., A. M., and A. A. S.; A. M., S. C. L., L. G., D. S. N., and J. C. R. designed and performed the experiments and collected the data; A. A. S., A. M., S. C. L., L. G., I. A. B., and J. D. G. designed, analyzed, and interpreted the experiments; A. A. S. performed computational metabolic analysis; P. G. H. and D. B. L. provided technical assistance and contributed to the preparation of the manuscript; J. D. G. provided conceptual advice; A. A. S., A. M., S. C. L., and J. D. G. wrote and edited the manuscript with the assistance of all authors.
Acknowledgments
These studies were performed at the Small Animal Imaging Facility of the University of Pennsylvania under the management of Dr. Stephen Pickup, whose assistance and guidance is gratefully acknowledged. The authors thank anonymous reviewers for suggestions that substantially improved the manuscript.
This work was supported by National Institutes of Health Grants R01 CA129544 (to J. D. G.) and R01 CA172820 (to J. D. G.). The authors declare that they have no conflicts of interest with the contents of this article. The content is solely the responsibility of the authors and does not necessarily represent the official views of the National Institutes of Health.
- BC
- bonded cumomer
- TCA cycle
- tricarboxylic acid cycle
- PPP
- pentose phosphate pathway
- MRO2
- O2 consumption rate
- GLUT
- glucose transporter
- MCT
- monocarboxylic acid transporter
- FA
- fatty acid
- MID
- mass isotopomer distribution
- G3P
- glyceraldehyde 3-phosphate
- 6PG
- d-6-phosphogluconate
- Ru5P
- d-ribulose 5-phosphate
- R5P
- d-ribose 5-phosphate
- X5P
- d-xylulose 5-phosphate
- S7P
- d-sedoheptulose 7-phosphate
- E4P
- d-erythrose 4-phosphate
- PDH
- pyruvate dehydrogenase
- MDH
- malate dehydrogenase
- SDH
- succinate dehydrogenase
- ADM
- atom distribution matrix
- GLS
- glutaminase.
References
- 1. Beckmann N. (1995) in Carbon-13 NMR Spectroscopy of Biological Systems (Beckmann N., ed) pp. 269–322, Academic Press, San Diego [Google Scholar]
- 2. Berliner L. J., and Robitaille P. M. (eds) (1999) In Vivo Carbon 13 NMR, pp. 1–255, Kluwer Academic/Plenum Publishers, New York [Google Scholar]
- 3. Glickson J. D. (1996) in Encyclopedia of Nuclear Magnetic Resonance (Grant D. M., and Harris R. K., eds) pp. 1209–1217, John Wiley & Sons, Ltd., New York [Google Scholar]
- 4. Kunnecke B. (1995) in Carbon-13 NMR Spectroscopy of Biological Systems (Beckmann N., ed) pp. 159–267, Academic Press, San Diego [Google Scholar]
- 5. Chance E. M., Seeholzer S. H., Kobayashi K., and Williamson J. R. (1983) Mathematical analysis of isotope labeling in the citric acid cycle with applications to 13C NMR studies in perfused rat hearts. J. Biol. Chem. 258, 13785–13794 [PubMed] [Google Scholar]
- 6. Chatham J. C., Forder J. R., Glickson J. D., and Chance E. M. (1995) Calculation of absolute metabolic flux and the elucidation of the pathways of glutamate labeling in perfused rat heart by 13C NMR spectroscopy and nonlinear least squares analysis. J. Biol. Chem. 270, 7999–8008 [DOI] [PubMed] [Google Scholar]
- 7. Jeffrey F. M., Reshetov A., Storey C. J., Carvalho R. A., Sherry A. D., and Malloy C. R. (1999) Use of a single 13C NMR resonance of glutamate for measuring oxygen consumption in tissue. Am. J. Physiol. 277, E1111–E1121 [DOI] [PubMed] [Google Scholar]
- 8. Malloy C. R., Sherry A. D., and Jeffrey F. M. (1987) Carbon flux through citric acid cycle pathways in perfused heart by 13C NMR spectroscopy. FEBS Lett. 212, 58–62 [DOI] [PubMed] [Google Scholar]
- 9. Weiss R. G., Kalil-Filho R., Herskowitz A., Chacko V. P., Litt M., Stern M. D., and Gerstenblith G. (1993) Tricarboxylic acid cycle activity in postischemic rat hearts. Circulation 87, 270–282 [DOI] [PubMed] [Google Scholar]
- 10. Yu X., White L. T., Doumen C., Damico L. A., LaNoue K. F., Alpert N. M., and Lewandowski E. D. (1995) Kinetic analysis of dynamic 13C NMR spectra: metabolic flux, regulation, and compartmentation in hearts. Biophys. J. 69, 2090–2102 [DOI] [PMC free article] [PubMed] [Google Scholar]
- 11. Befroy D. E., Perry R. J., Jain N., Dufour S., Cline G. W., Trimmer J. K., Brosnan J., Rothman D. L., Petersen K. F., and Shulman G. I. (2014) Direct assessment of hepatic mitochondrial oxidative and anaplerotic fluxes in humans using dynamic 13C magnetic resonance spectroscopy. Nat. Med. 20, 98–102 [DOI] [PMC free article] [PubMed] [Google Scholar]
- 12. Jones J. G., Solomon M. A., Cole S. M., Sherry A. D., and Malloy C. R. (2001) An integrated 2H and 13C NMR study of gluconeogenesis and TCA cycle flux in humans. Am. J. Physiol. Endocrinol. Metab. 281, E848–E856 [DOI] [PubMed] [Google Scholar]
- 13. Jucker B. M., Lee J. Y., and Shulman R. G. (1998) In vivo 13C NMR measurements of hepatocellular tricarboxylic acid cycle flux. J. Biol. Chem. 273, 12187–12194 [DOI] [PubMed] [Google Scholar]
- 14. Gruetter R., Seaquist E. R., and Ugurbil K. (2001) A mathematical model of compartmentalized neurotransmitter metabolism in the human brain. Am. J. Physiol. Endocrinol. Metab. 281, E100–E112 [DOI] [PubMed] [Google Scholar]
- 15. Mason G. F., Gruetter R., Rothman D. L., Behar K. L., Shulman R. G., and Novotny E. J. (1995) Simultaneous determination of the rates of the TCA cycle, glucose utilization, α-ketoglutarate/glutamate exchange, and glutamine synthesis in human brain by NMR. J. Cereb. Blood Flow Metab. 15, 12–25 [DOI] [PubMed] [Google Scholar]
- 16. Mason G. F., Rothman D. L., Behar K. L., and Shulman R. G. (1992) NMR determination of the TCA cycle rate and α-ketoglutarate/glutamate exchange rate in rat brain. J. Cereb. Blood Flow Metab. 12, 434–447 [DOI] [PubMed] [Google Scholar]
- 17. Portais J. C., Schuster R., Merle M., and Canioni P. (1993) Metabolic flux determination in C6 glioma cells using carbon-13 distribution upon [1-13C]glucose incubation. Eur. J. Biochem. 217, 457–468 [DOI] [PubMed] [Google Scholar]
- 18. Shestov A., Mancuso A., Leeper D., and Glickson J. D. (2013) in Oxygen Transport to Tissue XXXIV (Welch W., Palm F., Bruley D., and Harrison D., eds) pp. 265–271, Springer, New York [Google Scholar]
- 19. Mancuso A., Zhu A., Beardsley N. J., Glickson J. D., Wehrli S., and Pickup S. (2005) Artificial tumor model suitable for monitoring 31P and 13C NMR spectroscopic changes during chemotherapy-induced apoptosis in human glioma cells. Magn. Reson. Med. 54, 67–78 [DOI] [PubMed] [Google Scholar]
- 20. Mancuso A., Beardsley N. J., Wehrli S., Pickup S., Matschinsky F. M., and Glickson J. D. (2004) Real-time detection of 13C NMR labeling kinetics in perfused EMT6 mouse mammary tumor cells and βHC9 mouse insulinomas. Biotechnol. Bioeng. 87, 835–848 [DOI] [PubMed] [Google Scholar]
- 21. DeBerardinis R. J., Mancuso A., Daikhin E., Nissim I., Yudkoff M., Wehrli S., and Thompson C. B. (2007) Beyond aerobic glycolysis: transformed cells can engage in glutamine metabolism that exceeds the requirement for protein and nucleotide synthesis. Proc. Natl. Acad. Sci. U.S.A. 104, 19345–19350 [DOI] [PMC free article] [PubMed] [Google Scholar]
- 22. Shestov A. A., Valette J., Deelchand D. K., Uğurbil K., and Henry P. G. (2012) Metabolic modeling of dynamic brain 13C NMR multiplet data: concepts and simulations with a two-compartment neuronal-glial model. Neurochem. Res. 37, 2388–2401 [DOI] [PMC free article] [PubMed] [Google Scholar]
- 23. Maher E. A., Marin-Valencia I., Bachoo R. M., Mashimo T., Raisanen J., Hatanpaa K. J., Jindal A., Jeffrey F. M., Choi C., Madden C., Mathews D., Pascual J. M., Mickey B. E., Malloy C. R., and DeBerardinis R. J. (2012) Metabolism of [U-13C]glucose in human brain tumors in vivo. NMR Biomed. 25, 1234–1244 [DOI] [PMC free article] [PubMed] [Google Scholar]
- 24. Hensley C. T., and DeBerardinis R. J. (2015) In vivo analysis of lung cancer metabolism: nothing like the real thing. J. Clin. Invest. 125, 495–497 [DOI] [PMC free article] [PubMed] [Google Scholar]
- 25. Hill L. L., Korngold R., Jaworsky C., Murphy G., McCue P., and Berd D. (1991) Growth and metastasis of fresh human melanoma tissue in mice with severe combined immunodeficiency. Cancer Res. 51, 4937–4941 [PubMed] [Google Scholar]
- 26. Wahl M. L., Owen J. A., Burd R., Herlands R. A., Nogami S. S., Rodeck U., Berd D., Leeper D. B., and Owen C. S. (2002) Regulation of intracellular pH in human melanoma: potential therapeutic implications. Mol. Cancer Ther. 1, 617–628 [PubMed] [Google Scholar]
- 27. Mancuso A., Fernandez E. J., Blanch H. W., and Clark D. S. (1990) A nuclear magnetic resonance technique for determining hybridoma cell concentration in hollow fiber bioreactors. Biotechnology 8, 1282–1285 [DOI] [PubMed] [Google Scholar]
- 28. Leeper D. B., Engin K., Thistlethwaite A. J., Hitchon H. D., Dover J. D., Li D. J., and Tupchong L. (1994) Human tumor extracellular pH as a function of blood glucose concentration. Int. J. Radiat. Oncol. Biol. Phys. 28, 935–943 [DOI] [PubMed] [Google Scholar]
- 29. Tannock I. F., and Rotin D. (1989) Acid pH in tumors and its potential for therapeutic exploitation. Cancer Res. 49, 4373–4384 [PubMed] [Google Scholar]
- 30. Fitzpatrick S. M., Hetherington H. P., Behar K. L., and Shulman R. G. (1990) The flux from glucose to glutamate in the rat brain in vivo as determined by 1H-observed, 13C-edited NMR spectroscopy. J. Cereb. Blood Flow Metab. 10, 170–179 [DOI] [PubMed] [Google Scholar]
- 31. Herzig S., Raemy E., Montessuit S., Veuthey J. L., Zamboni N., Westermann B., Kunji E. R., and Martinou J. C. (2012) Identification and functional expression of the mitochondrial pyruvate carrier. Science 337, 93–96 [DOI] [PubMed] [Google Scholar]
- 32. Halestrap A. P. (2012) The mitochondrial pyruvate carrier: has it been unearthed at last? Cell Metab. 16, 141–143 [DOI] [PubMed] [Google Scholar]
- 33. Bricker D. K., Taylor E. B., Schell J. C., Orsak T., Boutron A., Chen Y. C., Cox J. E., Cardon C. M., Van Vranken J. G., Dephoure N., Redin C., Boudina S., Gygi S. P., Brivet M., Thummel C. S., and Rutter J. (2012) A mitochondrial pyruvate carrier required for pyruvate uptake in yeast, Drosophila, and humans. Science 337, 96–100 [DOI] [PMC free article] [PubMed] [Google Scholar]
- 34. Wiechert W., Möllney M., Isermann N., Wurzel M., and de Graaf A. A. (1999) Bidirectional reaction steps in metabolic networks: III. Explicit solution and analysis of isotopomer labeling systems. Biotechnol. Bioeng. 66, 69–85 [PubMed] [Google Scholar]
- 35. Muzykantov V. S., and Shestov A. A. (1986) Kinetic equations for the redistribution of isotopic molecules due to reversible dissociation. Homoexchange of methane. React. Kinet. Catal. Lett. 32, 207–312 [Google Scholar]
- 36. Shestov A. A., Liu X., Ser Z., Cluntun A. A., Hung Y. P., Huang L., Kim D., Le A., Yellen G., Albeck J. G., and Locasale J. W. (2014) Quantitative determinants of aerobic glycolysis identify flux through the enzyme GAPDH as a limiting step. Elife 3, e03342. [DOI] [PMC free article] [PubMed] [Google Scholar]
- 37. Shestov A. A., Valette J., Uğurbil K., and Henry P. G. (2007) On the reliability of 13C metabolic modeling with two-compartment neuronal-glial models. J. Neurosci. Res. 85, 3294–3303 [DOI] [PubMed] [Google Scholar]
- 38. McNamara R., Arias-Mendoza F., and Brown T. R. (1994) Investigation of broad resonances in 31P NMR spectra of the human brain in vivo. NMR Biomed. 7, 237–242 [DOI] [PubMed] [Google Scholar]
- 39. Shungu D. C., Bhujwalla Z. M., Li S. J., Rose L. M., Wehrle J. P., and Glickson J. D. (1992) Determination of absolute phosphate metabolite concentrations in RIF-1 tumors in vivo by 31P-1H-2H NMR spectroscopy using water as an internal intensity reference. Magn. Reson. Med. 28, 105–121 [DOI] [PubMed] [Google Scholar]
- 40. Van Zijl P. C., Moonen C. T., Faustino P., Pekar J., Kaplan O., and Cohen J. S. (1991) Complete separation of intracellular and extracellular information in NMR spectra of perfused cells by diffusion-weighted spectroscopy. Proc. Natl. Acad. Sci. U.S.A. 88, 3228–3232 [DOI] [PMC free article] [PubMed] [Google Scholar]
- 41. Mullen A. R., Hu Z., Shi X., Jiang L., Boroughs L. K., Kovacs Z., Boriack R., Rakheja D., Sullivan L. B., Linehan W. M., Chandel N. S., and DeBerardinis R. J. (2014) Oxidation of α-ketoglutarate is required for reductive carboxylation in cancer cells with mitochondrial defects. Cell Rep. 7, 1679–1690 [DOI] [PMC free article] [PubMed] [Google Scholar]
- 42. Berg J. M., Tymoczko J. L., and Stryer L. (2002) Biochemistry, pp. 1–1100, W. H. Freeman, New York [Google Scholar]
- 43. Kaplon J., Zheng L., Meissl K., Chaneton B., Selivanov V. A., Mackay G., van der Burg S. H., Verdegaal E. M., Cascante M., Shlomi T., Gottlieb E., and Peeper D. S. (2013) A key role for mitochondrial gatekeeper pyruvate dehydrogenase in oncogene-induced senescence. Nature 498, 109–112 [DOI] [PubMed] [Google Scholar]
- 44. Wise D. R., DeBerardinis R. J., Mancuso A., Sayed N., Zhang X. Y., Pfeiffer H. K., Nissim I., Daikhin E., Yudkoff M., McMahon S. B., and Thompson C. B. (2008) Myc regulates a transcriptional program that stimulates mitochondrial glutaminolysis and leads to glutamine addiction. Proc. Natl. Acad. Sci. U.S.A. 105, 18782–18787 [DOI] [PMC free article] [PubMed] [Google Scholar]
- 45. Rajagopalan K. N., and DeBerardinis R. J. (2011) Role of glutamine in cancer: therapeutic and imaging implications. J. Nucl. Med. 52, 1005–1008 [DOI] [PMC free article] [PubMed] [Google Scholar]
- 46. Hensley C. T., Wasti A. T., and DeBerardinis R. J. (2013) Glutamine and cancer: cell biology, physiology, and clinical opportunities. J. Clin. Invest. 123, 3678–3684 [DOI] [PMC free article] [PubMed] [Google Scholar]
- 47. Le A., and Dang C. V. (2013) Studying Myc's role in metabolism regulation. Methods Mol. Biol. 1012, 213–219 [DOI] [PMC free article] [PubMed] [Google Scholar]
- 48. Fan J., Kamphorst J. J., Mathew R., Chung M. K., White E., Shlomi T., and Rabinowitz J. D. (2013) Glutamine-driven oxidative phosphorylation is a major ATP source in transformed mammalian cells in both normoxia and hypoxia. Mol. Syst. Biol. 9, 712. [DOI] [PMC free article] [PubMed] [Google Scholar]
- 49. Scott D. A., Richardson A. D., Filipp F. V., Knutzen C. A., Chiang G. G., Ronai Z. A., Osterman A. L., and Smith J. W. (2011) Comparative metabolic flux profiling of melanoma cell lines: beyond the Warburg effect. J. Biol. Chem. 286, 42626–42634 [DOI] [PMC free article] [PubMed] [Google Scholar]
- 50. Schug Z. T., Peck B., Jones D. T., Zhang Q., Grosskurth S., Alam I. S., Goodwin L. M., Smethurst E., Mason S., Blyth K., McGarry L., James D., Shanks E., Kalna G., Saunders R. E., et al. (2015) Acetyl-CoA synthetase 2 promotes acetate utilization and maintains cancer cell growth under metabolic stress. Cancer Cell 27, 57–71 [DOI] [PMC free article] [PubMed] [Google Scholar]
- 51. Fan J., Ye J., Kamphorst J. J., Shlomi T., Thompson C. B., and Rabinowitz J. D. (2014) Quantitative flux analysis reveals folate-dependent NADPH production. Nature 510, 298–302 [DOI] [PMC free article] [PubMed] [Google Scholar]
- 52. Mehrmohamadi M., Liu X., Shestov A. A., and Locasale J. W. (2014) Characterization of the usage of the serine metabolic network in human cancer. Cell Rep. 9, 1507–1519 [DOI] [PMC free article] [PubMed] [Google Scholar]
- 53. Shestov A. A., Barker B., Gu Z., and Locasale J. W. (2013) Computational approaches for understanding energy metabolism. Wiley Interdiscip Rev. Syst. Biol. Med. 5, 733–750 [DOI] [PMC free article] [PubMed] [Google Scholar]