

Abstract
Mammalian target of rapamycin complex 1 (mTORC1) is a master regulator of cellular metabolism, growth, and proliferation. mTORC1 has been implicated in many diseases such as cancer, diabetes, and neurodegeneration, and is a target to prolong lifespan. Here we report a small molecule inhibitor (Cbz-B3A) of mTORC1 signaling. Cbz-B3A inhibits the phosphorylation of eIF4E-binding protein 1 (4EBP1) and blocks 68% of translation. In contrast, rapamycin preferentially inhibits the phosphorylation of p70S6k and blocks 35% of translation. Cbz-B3A does not appear to bind directly to mTORC1, but instead binds to ubiquilins 1, 2, and 4. Knockdown of ubiquilin 2, but not ubiquilins 1 and 4, decreases the phosphorylation of 4EBP1, suggesting that ubiquilin 2 activates mTORC1. The knockdown of ubiquilins 2 and 4 decreases the effect of Cbz-B3A on 4EBP1 phosphorylation. Cbz-B3A slows cellular growth of some human leukemia cell lines, but is not cytotoxic. Thus Cbz-B3A exemplifies a novel strategy to inhibit mTORC1 signaling that might be exploited for treating many human diseases. We propose that Cbz-B3A reveals a previously unappreciated regulatory pathway coordinating cytosolic protein quality control and mTORC1 signaling.
Keywords: eukaryotic translation initiation factor 4E-binding protein 1 (EIF4EBP1), mammalian target of rapamycin (mTOR), protein synthesis, S6 kinase, translation control, luciferase, rapamycin, ubiquilin
Introduction
Mammalian target of rapamycin (mTOR)3 is an evolutionarily conserved Ser/Thr kinase that serves as a master regulator of many cellular functions, including mRNA translation, autophagy, and cellular proliferation. mTOR integrates growth signals and the availability of amino acids. Deregulation of mTOR is common in cancer (1), type 2 diabetes (2), and neurodegeneration (3, 4). Inhibition of mTOR prolongs lifespan in yeast, worms, fruit flies, and mice (5–8).
mTOR is found in two main complexes, mTOR complex 1 (mTORC1) and mTOR complex 2 (mTORC2), which phosphorylate different downstream targets. These two complexes are distinguished by the presence of Raptor in mTORC1 and Rictor in mTORC2 (9, 10). The insulin/Akt, MAPK/ERK, and Wnt pathways activate mTORC1 (11–15). mTORC1 activates protein biosynthesis and inhibits autophagy (10). Insulin and growth factors stimulate mTORC2 via an unknown mechanism (16). mTORC2 controls cell survival and proliferation by phosphorylating Akt at Ser-471 and SGK1 at Ser-422 (17, 18).
mTORC1 activates mRNA translation by phosphorylating both 4EBP1 and p70S6k (10). 4EBP1 inhibits formation of the eIF4F translation initiation complex that controls the translation of capped mRNAs. Phosphorylation disrupts the 4EBP1·eIF4E complex, allowing eIF4E to associate with eIF4F (19–22). Phosphorylation of 4EBP1 occurs initially at Thr-37/Thr-46, which is sufficient to block its association with eIF4E. Subsequent phosphorylations occur at Thr-70 followed by Ser-65. mTORC1 is the protein kinase responsible for the majority of 4EBP1 phosphorylation (23). mTORC1 also phosphorylates p70S6k at Thr-412, priming subsequent phosphorylation by PDK1 at Thr-252 and by glycogen synthase kinase 3 at Ser-371 (24–26). Phosphorylation of Ser-371 activates p70S6k, which in turn phosphorylates ribosome S6, turning on translation (27). mTORC1 may also influence the dephosphorylation at Ser-371 by inhibiting the p70S6k phosphatase PP2A (26).
mTORC1 inhibits autophagy by phosphorylating autophagy related protein 13 (ATG13), and UNC-51-like kinases 1 and 2 (ULK1 and ULK2). Phosphorylation of these proteins prevents phosphorylation and activation of FIP2000, an essential protein for autophagosome formation (28–30). Additionally, the lipidation of LC3 to LC3-II is required for the formation of autophagosomes (31). LC3-II migrates to a lower molecular weight than LC3 on a SDS-PAGE, and therefore is typically used to measure autophagy.
Currently, inhibitors of mTOR generally fall within two categories: rapamycin and rapamycin derivatives (rapalogs), and ATP-competitive mTOR kinase inhibitors. Rapamycin binds to mTORC1 as a complex with FKBP12, and will also inhibit mTORC2 activity after prolonged treatment (17, 32–34). Rapamycin strongly inhibits phosphorylation of p70S6k at Thr-389. However, the initial phosphorylation of 4EBP1 is rapamycin resistant, so rapamycin has comparatively little effect on 4EBP1-regulated translation (35–38). ATP-competitive mTOR kinase inhibitors inhibit the kinase activity of both mTORC1 and mTORC2 and block the phosphorylation of all mTOR substrates (35). This class of inhibitors includes Torin 1, Torin 2, OSI-027, AZD-8055, AZD-2014, and INK128 (39).
Our laboratory recently reported that Boc3Arg (B3A) is a small molecule degron that, when coupled to an appropriate recognition ligand, can induce the degradation of a target protein (Fig. 1) (40). B3A-linked trimethoprim and ethacrynic acid increase the degradation of Escherichia coli dihydrofolate reductase (eDHFR) and glutathione transferase (GST), respectively, in both cycloheximide-treated cells and cell lysates. B3A-induced degradation is proteasome dependent but does not appear to require ubiquitination of the target protein. We believe that B3A resembles an unfolded peptide and may usurp the cytosolic protein quality control processes.
FIGURE 1.

Structures of compounds.
While further investigating the mechanism of B3A-induced degradation, we unexpectedly discovered that B3A ligands inhibit translation. Here we show that Cbz-B3A blocks translation by inhibiting the mTORC1 pathway in a process that is dependent on the presence of ubiquilins 2 and 4. Unlike rapamycin, Cbz-B3A has a larger effect on the phosphorylation of 4EBP1 than p70S6k.
Experimental Procedures
Materials
Rapamycin was obtained from Gold Biotechnology. Cycloheximide, tunicamycin, and thapsigargin were obtained from Sigma. Bortezomib was obtained from Fisher Scientific. Rabbit monoclonal anti-p70S6k (49D7, 2708), anti-p70S6k Thr-381 (108D2, 9234), anti-mTOR (7C10, 2983), anti-mTOR Ser-2448 (D9C2, 5536), anti-mTOR Ser-2481 (2974), anti-eIF2α Ser-51 (D9G8, 3398), anti-LC3A/B (4108), anti-AKT Ser-473 (D9E, 4060), anti-AKT Thr-308 (D25E6, 13038), anti-Rheb (E1G1R, 13879), anti-TSC2 (D93F12, 4308), and rabbit polyclonal anti-4EBP1 (9452), and anti-p70S6k Ser-371 (9208) were obtained from Cell Signaling. Rabbit polyclonal anti-HA (ab9110), anti-raptor (ab40758), and anti-ubiquilin 4 (ab106443), mouse monoclonal anti-ubiquilin 2 (ab57150), and anti-eIF2α (ab5369) were obtained from Abcam. Mouse anti-actin was obtained from Sigma. IRDye800CW donkey anti-mouse and IRDye680CW donkey anti-rabbit were obtained from Li-Cor. TMP-B3A was synthesized as previously described (40). Cbz-B3A, Ac-B3A, and amine-B3A were synthesized as described in (40).
Immunoblotting
Quantification of Western blots was performed with ImageJ (41). Cells were lysed in RIPA buffer (1% Nonidet P-40, 1% sodium deoxycholate, 0.1% SDS, 10 mm Tris-Cl, 10 mm β-glycerophosphate, 10 mm sodium pyrophosphate, 50 mm NaF, 200 μm sodium vanadate, 1 mm EDTA, 500 μm EGTA, 1% Benzonase, and supplemented with cOmplete (Roche Diagnostics) protease inhibitors).
Cell Culture and Experiments
HEK-293T cells and GP2–293 were cultured in DMEM supplemented with 10% heat inactivated FBS (Sigma), 1× GlutaMax (Gibco), 100 units/ml of penicillin, and 100 μg/ml of streptomycin (Gibco) at 37 °C and 5% CO2. K562 and BaF3/p210 cells were cultured in RPMI supplemented with 10% heat-inactivated FBS (Sigma), 1× GlutaMax, 100 units/ml of penicillin, and 100 μg/ml of streptomycin at 37 °C and 5% CO2.
Retroviral Transduction
Firefly luciferase and firefly luciferase-eDHFR were cloned into pBABE-puro vector, which was a gift from Hartmut Land, Jay Morgenstern, and Bob Weinberg (Addgene plasmid number 1764). pBABE-puro-luciferase was co-transfected with VSV-G into GP2–293 cells (Retro-X Universal Packaging System, Clonetech, Mountain View, CA) with TransIT-2020 (MirusBio) according to the TransIT-2020 protocol. After 48 h, the viral supernatant was harvested, spun down, filtered with a 45-μm syringe filter, and added to HEK-293T supplemented with 8 μg/ml of Polybrene. After 4 h of infection, the media was replaced with fresh media. 48 h later, media was replaced with media containing 3 μg/ml of puromycin. Media was replaced with fresh media containing puromycin every 3–4 days. After 2 weeks of puromycin selection, the cells were grown out from single cell colonies and screened for luciferase expression.
Luciferase Assay and Recombinant Luciferase
Stably transduced luciferase HEK-293T cells were plated in 96-well plates 24 h prior to treatment with 100 μm Cbz-B3A, amine-B3A, acetyl-B3A, and Cbz-acetyl. After 4 h, cells were harvested and measured with Luciferase Assay System with Reporter Lysis Buffer from Promega according to the manufacturer's protocol. Before the addition of luciferin, the protein concentration was measured by removing 2 μl of lysate from each well and adding it to diluted Bio-Rad Protein Assay Dye Reagent Concentrate, and the absorbance was measured at A595. The protein concentration was used to normalize the luciferase signal. For translation assays, cells were pretreated for 15 min with 100 μg/ml of cycloheximide or 6 μm bortezomib. For the recombinant luciferase assay, Quantilum Recombinant Luciferase (Promega) was diluted 1:250,000 in reporter lysis buffer with 1 mg/ml of BSA, then mixed 1:1 with 200 μm compound in the same buffer for a final dilution of 1:500,000 and 100 μm compound in 20 μl. This was incubated for 10 min at room temperature, then measured with a Luciferase Assay System with Reporter Lysis Buffer from Promega according to the manufacturer's protocol.
For the luciferase half-life experiment, stably transduced luciferase HEK-293T cells were plated in a 96-well black plate with a clear bottom at 5,000 cells/well 24 h before the experiment. Cells were incubated for 4 h with the indicated concentrations of Cbz-B3A, then the media was replaced with phenol red-free DMEM supplemented with 10% heat inactivated FBS (Sigma), 1× GlutaMax (Gibco), 100 units/ml of penicillin, and 100 μg/ml of streptomycin (Gibco), 100 μg/ml of cycloheximide, the indicated concentration of Cbz-B3A, and 1 mm d-luciferin (Gold Biotechnology).
Real-time PCR
Real-time PCR was conducted on a Corbett Rotor-Gene 6000. RNA was reverse transcribed and cDNA was amplified with iTaq Universal SYBR Green One-Step kit (Bio-Rad) according to the manufacturer's protocol. Firefly luciferase was amplified using primers 5′-CTCACTGAGACTACATCAGC-3′ and 5′-TCCAGATCCACAACCTTCGC. Renilla luferase was amplified using primers 5′-GGAATTATAATGCTTATCTACGTGC-3′ and 5′-CTTGCGAAAAATGAAGACCTTTTAC-3′. Actin was amplified using primers 5′-GGCATGGGTCAGAAGGATT-3′ and 5′-GGGGTGTTGAAGGTCTCAAA-3′.
Renilla Assay
pRSV-Renilla, which was a gift from Dr. Michael Marr, was transfected into HEK-293T cells with TransIt 2020 according to the manufacturer's protocol. Cells were trypsinized 48 h after transfection and plated into a 96-well plate at 10,000 cells/well. The media was removed 24 h later and replaced by media containing 100 μm Cbz-B3A or DMSO and the cells were treated for 4 h. After treatment, cells were lysed with reporter lysis buffer (Promega), then substrate was added and Renilla luciferase was measured on a luminometer. For the substrate, 10 μl of 10 mm coelenterazine (Gold Biotechnology) dissolved in acidified ethanol was added to 1 ml of Renilla buffer (25 mm Na4PPi, 10 mm NaOAc, 15 mm EDTA, 0.5 m Na2SO4, 1.0 m NaCl, pH 5.0).
[35S]Methionine/Cysteine Incorporation Translation Assay
80,000 cells/well of HEK-293T cells were plated into 24-well plates 24 h before the assay. Cells were treated with the indicated concentration of compound for 4 h. After 4 h, the media was removed and replaced with DMEM without methionine and cysteine (Life Technologies) supplemented with 0.2 mCi/ml of EXPRESS [35S] protein labeling mix (PerkinElmer Life Sciences), 10% dialyzed FBS (Pierce), 1× GlutaMax (Gibco), 100 units/ml of penicillin, 100 μg/ml of streptomycin (Gibco), 1 mm sodium pyruvate (Life Technologies), and the indicated concentration of compound. After 1 h, this media was removed, cells were washed with ice-cold PBS, and lysed with low deoxycholate RIPA buffer (10 mm Tris-Cl, 1% Nonidet P-40, 0.5% sodium deoxycholate, 0.1% SDS, 140 mm NaCl, 1 mm EDTA, 500 μm EGTA, 1× Roche Complete protease inhibitors, 1:100 Benzonase, pH 8.0). Lysate was centrifuged at maximum speed for 20 min at 4 °C. The concentration was measured by a Bradford assay. 10 μg of lysate was added to 100 μl of ice-cold 1 mg/ml of BSA with 0.02% sodium azide. 1 ml of ice-cold 10% TCA was added, the solutions were mixed and incubated on ice for 0.5 h. These mixtures were vacuum filtered onto GF/C Whatman glass microfiber filters. The filters were washed with 2× 5 ml of 10% TCA, then 2× 3 ml of ethanol. The filters were then dried for one-half h. The filters were placed into scintillation vials with 5 ml of scintillation fluid and read on a scintillation counter.
SILAC Lysate
HEK-293T cells were grown in DMEM minus l-lysine and l-arginine (Thermo Scientific Pierce) supplemented with 10% dialyzed FBS for SILAC (Pierce), 1× GlutaMax (Gibco), 100 units/ml of penicillin, 100 μg/ml of streptomycin (Gibco) and either 84 μg/ml of [13C/15N]l-arginine and 146 μg/ml of [13C/15N]l-lysine (Cambridge Isotope Laboratories) or 84 μg/ml of l-arginine and 146 μg/ml of l-lysine (Sigma) at 37 °C and 5% CO2 for a minimum of 6 passages. Cells were lysed by 3 quick freeze/thaws in Dulbecco's phosphate-buffered saline supplemented with Roche Complete protease inhibitor mixture and 10 mm β-glycerophosphate, 10 mm sodium pyrophosphate, 50 mm NaF, and 200 μm sodium vanadate and used for pulldowns. Mass spectrometry was performed on a Thermo Orbitrap Elite and Thermo XL-ETD Orbitrap microcapillary LC-MS/MS. The false discovery rate was set to 0.01 (1%) for peptide and protein identifications. To determine SILAC ratios, a minimum of two ratio counts between SILAC peptide pairs was required.
Pulldowns
NHS-activated Sepharose 4 fast flow beads (GE Healthcare) were added to screw cap spin columns (Pierce) washed with phosphate buffer. Amine-acetyl or amine-B3A was dissolved in ethanol at 5 mm then diluted 5-fold into 100 mm NaPO4, 150 mm NaCl, pH 7.2, to reach a concentration of 1 mm compound in buffer. 1 mm amine-acetyl or amine-B3A was added to beads and rotated overnight at room temperature. Afterward, the beads were blocked with 100 mm ethanolamine for 3 h. The manufacturer's protocol was followed thereafter. Briefly, HEK-293T cells were lysed by 3 quick freeze/thaws in Dulbecco's phosphate-buffered saline supplemented with Roche Complete protease inhibitor mixture and 10 mm β-glycerophosphate, 10 mm sodium pyrophosphate, 50 mm NaF, and 200 μm sodium vanadate. Lysate was added to the beads at 3 μg/μl and rotated for 30 min at room temperature, then washed 3 times with Dulbecco's phosphate-buffered saline and inhibitors and eluted with 1× Laemmli loading buffer at 65 °C for 20 min.
Cellular Thermal Shift Assay (CETSA)
CETSA was performed as previously described (42). Briefly, HEK-293T cells were lysed in Dulbecco's phosphate-buffered saline with Roche Complete protease inhibitor by 3 quick freeze thaws, centrifuged at 20,000 × g for 20 min at 4 °C, and the supernatant was adjusted to 4 mg/ml. Lysate was incubated with compound for 30 min and heated to different temperatures in a thermal cycler for 3 min, then cooled to room temperature for 3 min. All samples were then centrifuged at 20,000 × g for 20 min at 4 °C and a Western blot was run on the supernatant.
RNAi Knockdown
ON-TARGETplus SMARTpool siRNA for ubiquilin 1 (catalogue number L012942-00-0005), ubiquilin 2 (L013566-00-0005), and ubiquilin 4 (L021178-01-0005) were obtained from Dharmacon and transfected into HEK-293T cells with DharmaFECT 1 (Dharmacon, Lafayette, CO) according to the manufacturer's protocol. Cells were harvested 72 h post-transfection and analyzed by Western blot.
Cellular Growth and Cytoxicity Assays
To determine cellular growth, a CellTiter-Glo luminescent cell viability assay (Promega) was used per the manufacturer's instructions. To determine cytotoxicity, LDH release was measured with the LDH Cytotoxicity Assay Kit (Pierce) according to the manufacturer's protocol. For 4-h assays, 96-well plates were seeded at 75,000 cells/ml for BaF3/p210 cells or K562 cells. For HEK-293T cells, 10,000 cells/well were plated 24 h before treatment. Cells were treated for 4 h at 37 °C and 50 μl was removed from every well and used in the LDH cytotoxicity assay per the manufacturer's protocol. For 48 h assays, 7,500 cells/ml of BaF3/p210 or K562 cells were incubated with compound at 37 °C for 48 h (200 μl/well). For HEK-293T cells, 1,000 cells/well were plated 24 h prior to compound treatment. After treatment, 50 μl was removed from each well for the LDH assay for all cell lines and 100 μl of mixed cells were removed and used with the CellTiter-Glo kit for K562 and BaF3/p210 cells. For HEK-293T cells, wells were treated as directed with the CellTiter-Glo kit. Cytotoxicity or viability was measured by luminosity and absorbance on a microplate reader.
NCI-60 DTP Human Tumor Cell Line Screen
Screen was conducted as previously described (43), performed at Developmental Therapeutics Program NCI/NIH.
Statistics
All p values were determined by a standard independent 2 sample t test calculated by scipy.stats.ttest_ind within Python 3.4 (programming language).
Results
Cbz-B3A Decreases Luciferase Protein
We chose to investigate the mechanism of B3A-induced degradation in the human embryonic kidney cell line HEK-293T because these cells are easily manipulated and have been widely used to elucidate protein degradation and signaling pathways. We constructed HEK-293T cells that stably expressed firefly luciferase fused to eDHFR (luciferase-eDHFR), as well as firefly luciferase alone (wild type) as a control. Surprisingly, TMP-B3A (Fig. 1) reduced luciferase signal to similar levels in both luciferase-eDHFR and wild-type luciferase cells (Fig. 2a). Firefly luciferase is a promiscuous small molecule binder (44), suggesting that TMP-B3A might bind to luciferase and induce proteasomal degradation as previously reported for the B3A-induced degradation of eDHFR and GST (40). Therefore we removed the TMP recognition ligand to leave the free amino group at the end of the linker (amine-B3A; Fig. 1). Amine-B3A treatment did not cause a significant change in the luciferase signal. However, the positive charge of the free amine is likely to hinder cellular uptake. Therefore we also replaced TMP with the commonly used amine protecting groups carboxybenzyl and acetyl to make Cbz-B3A and acetyl-B3A, respectively (Fig. 1). Both Cbz-B3A and acetyl-B3A decreased the wild type luciferase signal as observed with TMP-B3A (Fig. 2b). In contrast, the luciferase signal was not reduced when cells were treated with Cbz-acetyl, which lacks the B3A tag. These observations indicate the B3A tag is responsible for the decrease in firefly luciferase signal, although the process is distinct from the B3A-induced proteasomal degradation observed previously.
FIGURE 2.

B3A reduces luciferase protein. a, TMP-B3A reduces luciferase signal of both wild type luciferase and luciferase-eDHFR fusion protein. The graph represents 5 independent replicates of cells treated with either DMSO or 200 μm TMP-B3A. All samples were measured with Luciferase Assay System (Promega) on a luminometer and normalized with a Bradford assay. b, B3A-containing ligands decrease luciferase signal. HEK-293T cells expressing HA-luciferase were treated for 4 h with 100 μm of the listed compounds. The bars represent the average and standard deviation of 4 independent replicates. All samples were measured as in a. c, Cbz-B3A does not inhibit luciferase enzymatic activity. Recombinant luciferase was incubated with compound for 10 min, then substrate was added and activity was measured. The bars represent the average and standard deviation of 5 independent replicates. d, Cbz-B3A reduces luciferase protein. HEK-293T cells expressing HA-luciferase were treated with 100 μm Cbz-B3A for 4 h. Cells were lysed and analyzed by immunoblotting with an anti-HA antibody. Both blots are from the same experiment and the same exposure. e, the graph represents quantification of d. f, Cbz-B3A does not reduce firefly luciferase mRNA. HEK-293T cells expressing HA-luciferase were treated with 100 μm Cbz-B3A for 4 h. Firefly luciferase mRNA was measured by quantitative RT-PCR and normalized to actin. The bars represent the average and standard deviation of 3 independent replicates. g, Cbz-B3A reduces Renilla luciferase. HEK-293T cells transfected with pRSV-Renilla were treated with 100 μm Cbz-B3A for 4 h. All samples were lysed in reporter lysis buffer and measured with substrate on a luminometer and normalized with a Bradford assay. The bars represent the average and standard deviation of 4 independent replicates. Significance was determined in comparison to DMSO; n.s., not significant, p > 0.05; *, p < 0.05; **, p < 0.01; ***, p < 0.001; ****, p < 0.0001.
We next wanted to determine whether the reduction in signal was due to inhibition of luciferase activity or reduced levels of luciferase protein. When recombinant firefly luciferase was incubated with Cbz-B3A, there was no reduction of signal, indicating that Cbz-B3A does not inhibit the enzymatic activity of firefly luciferase (Fig. 2c). Moreover, when cells were treated with Cbz-B3A, the amount of luciferase protein decreased by ∼40%, in good agreement with the decrease in luciferase signal (compare Fig. 2, b, d, and e). We also investigated the effect of Cbz-B3A on the levels of luciferase mRNA by quantitative RT-PCR (Fig. 2f). No change was observed in the presence of Cbz-B3A, indicating that the decrease in luciferase protein must arise from either a decrease in synthesis or an increase in degradation.
To determine whether this phenomenon was unique to our firefly luciferase construct, we repeated the assay with HEK-293T cells transfected with Renilla luciferase regulated by the RSV promoter. The Renilla luciferase signal also decreased with Cbz-B3A treatment (Fig. 2g). Thus Cbz-B3A decreased the levels of both luciferase proteins. As observed with firefly luciferase expression, the amount of Renilla luciferase mRNA was not affected by Cbz-B3A treatment. These observations indicate the Cbz-B3A modulates the biosynthesis or degradation of at least two luciferase proteins.
The Cbz-B3A-mediated Decrease in Luciferase Protein Is Not Due to Increased Degradation
To further investigate why luciferase protein levels decrease in the presence of Cbz-B3A, we treated cells with bortezomib to inhibit proteasomal degradation. Surprisingly, bortezomib alone decreased luciferase levels (Fig. 3a). The proteasome inhibitor-induced degradation of luciferase has been reporter by others (45). Importantly, bortezomib did not protect firefly luciferase signal from Cbz-B3A treatment. These observations indicate that the Cbz-B3A-induced decrease firefly luciferase does not involve proteasomal degradation (Fig. 3a), further demonstrating that this process must be distinct from the B3A-dependent degradation previously reported (40).
FIGURE 3.

Cbz-B3A inhibits protein translation. a, Cbz-B3A does not induce degradation of luciferase. HEK-293T cells expressing HA-luciferase were pretreated with 100 μg/ml of cycloheximide or 6 μm bortezomib for 15 min followed by treatment with 100 μm Cbz-B3A for 4 h. All samples were measured with the Luciferase Assay System (Promega) on a luminometer and normalized by Bradford assay measurements. The bars represent average and standard deviation of 6 independent replicates. b, Cbz-B3A does not change the half-life of luciferase. HEK-293T cells expressing HA-luciferase were pretreated with the indicated concentrations of Cbz-B3A or DMSO for 4 h, then co-treated with the indicated concentrations of Cbz-B3A, 100 μg/ml of cycloheximide, and d-luciferin for the indicated times. t = 0 begins at the addition of cycloheximide and d-luciferin. Each point represents the average and standard deviation of 6 independent replicates. c, dose response of luciferase activity for the experiment in panel b at t = 0. d, Cbz-B3A inhibits protein translation. HEK-293T cells were treated with vehicle or Cbz-B3A (300 nm, 1 μm, 3 μm, 10 μm, or 30 μm) for 4 h. Media was replaced with 35S-labeled media containing the appropriate concentration of Cbz-B3A and cells were incubated for 1 h prior to lysis. Protein was isolated by TCA precipitation, washed, and 35S incorporation was measured on a scintillation counter. The graph represents the average and the standard deviation of 2 independent replicates. e, Cbz-B3A does not increase eIF2α phosphorylation. HEK-293T cells were treated with Cbz-B3A (10 μm), tunicamycin (5 μg/ml), thapsigargin (500 nm), or serum starved for 1 h and blotted against eIF2α and phosphorylated eIF2α. f, the bars represent the average and standard deviation of the quantification of e.
To observe luciferase turnover, cells were treated with cycloheximide to block protein biosynthesis. Luciferase levels decreased in the presence of cycloheximide as expected (Fig. 3a). No further decrease was observed in the presence of Cbz-B3A, which suggested that Cbz-B3A does not increase luciferase turnover. We also measured the half-life of luciferase turnover in the presence and absence of Cbz-B3A (Fig. 3b). Cbz-B3A had no effect on the half-life of luciferase at concentrations up to 100 μm. Under these conditions, luciferase signal was reduced in a dose-dependent manner with an EC50 of 8 ± 2 μm (Fig. 3c). These observations indicate that the decrease in luciferase protein is not the result of degradation, and must instead be due to a decrease in protein synthesis.
Cbz-B3A Inhibits Translation
We measured the incorporation of [35S]methionine/cysteine into proteins to directly determine the effects of Cbz-B3A on global translation. Intriguingly, Cbz-B3A decreased the incorporation of [35S]methionine/cysteine into protein in a dose-dependent manner (Fig. 3d), with maximal inhibition of 68% observed at 10 μm, and an EC50 of ∼3 μm. Thus Cbz-B3A is a strong inhibitor of translation.
Cbz-B3A Does Not Inactivate eIF2α
B3A resembles an unfolded peptide, which suggests that it might trigger the unfolded protein response. Translation is blocked by phosphorylation of the translation initiation factor eIF2α during the unfolded protein response, as well as during ER stress, and in response to amino acid starvation (46, 47). Therefore we investigated whether B3A induced the phosphorylation of eIF2α. As expected, serum starvation, tunicamycin (induces ER stress and unfolded protein response), and thapsigargin (induces ER stress and unfolded protein response) increased phosphorylation of eIF2α (Fig. 3, e and f) (48). However, no increase in eIF2α phosphorylation was observed after treatment with Cbz-B3A. Thus Cbz-B3A does not block translation by inducing the phosphorylation of eIF2α.
Cbz-B3A Inhibits the Phosphorylation of 4EBP1
We next investigated the effect of Cbz-B3A on the translation repressor 4EBP1. The phosphorylation of 4EBP1 by mTORC1 inactivates 4EBP1, allowing translation to initiate. 4EBP1 has multiple phosphorylation sites, the differentiation of which is visible on a Western blot of total 4EBP1 protein (Fig. 4a). Only the hypophosphorylated form (the bottom band) binds to eIF2a and blocks translation (37, 49). When cells were treated with 10 μm Cbz-B3A, a clear shift from hyperphosphorylation to hypophosphorylation was observed (Fig. 4, a and b). No shift was observed with Cbz-acetyl, which indicates that the B3A tag is required for inhibition of 4EBP1 phosphorylation. The dose-response of 4EBP1 phosphorylation inhibition reached a maximum at 10 μm with an EC50 of ∼2 μm, in good agreement with the dose dependence of translation inhibition (compare Fig. 4c and Fig. 3b). Moreover, the accumulation of hypophosphorylation was greater than that observed with saturating rapamycin (Fig. 4, a and b), as expected given that the Thr-37/46 site is rapamycin resistant (35, 37, 38). These observations indicate that Cbz-B3A blocks translation by inhibiting the phosphorylation of 4EBP1.
FIGURE 4.
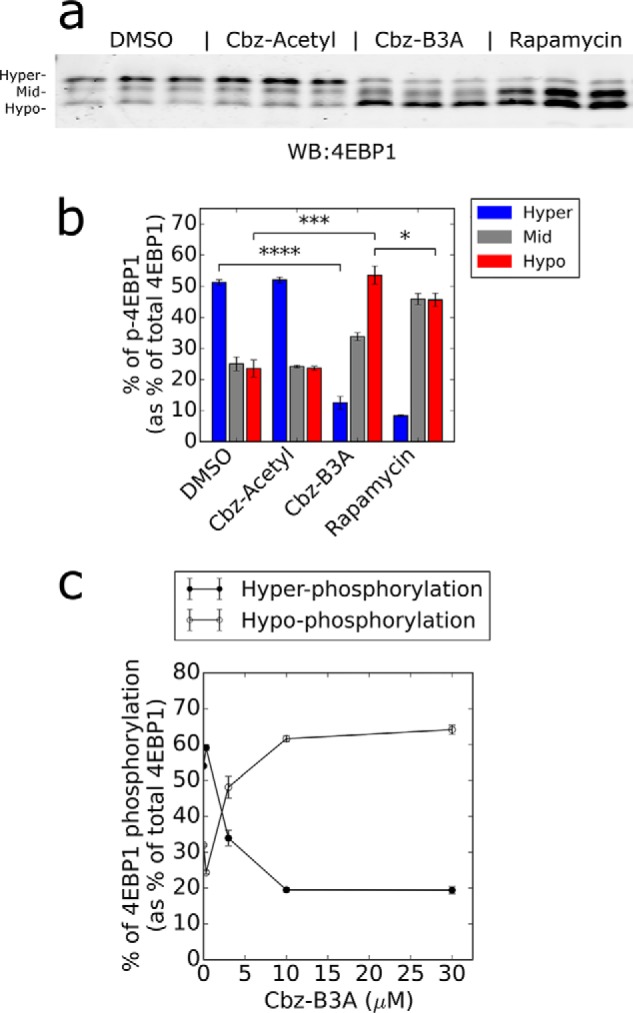
Cbz-B3A inhibits the phosphorylation of 4EBP1. a, Cbz-B3A reduces 4EBP1 phosphorylation. Anti-4EBP1 Western blot of lysate from HEK-293T cells treated with DMSO, Cbz-Acetyl (10 μm), Cbz-B3A (10 μm), or rapamycin (20 nm) for 4 h. b, quantification of a with hyper representing the top band, mid the middle band, and hypo the bottom band. c, dose response for inhibition of 4EBP1 phosphorylation. Cbz-B3A inhibits 4EBP1 phosphorylation with an EC50 of ∼2 μm. The graph represents the quantification of 4EBP1 found in the top band (hyperphosphorylation) and bottom band (hypophosphorylation) in a dilution curve of HEK-293T cells treated with Cbz-B3A for 4 h. Significance was determined in comparison to DMSO; n.s., not significant, p > 0.05; *, p < 0.05; **, p < 0.01; ***, p < 0.001; ****, p < 0.0001.
Cbz-B3A Inhibits mTORC1 Signaling
We measured the phosphorylation of p70S6k to further investigate the effects of Cbz-B3A on mTORC1-regulated translation. Cbz-B3A inhibits phosphorylation of p70S6k at Thr-389 (Fig. 5, a and b). The dose response is similar to that observed for the phosphorylation of 4EBP1 (Fig. 5a). Interestingly, Cbz-B3A-treated cells retained ∼30% phosphorylation at Thr-389, whereas rapamycin completely blocked phosphorylation of this site. Unlike rapamycin, Cbz-B3A did not inhibit phosphorylation of p70S6k at Ser-371 (Fig. 5, b and c). We also examined the p70S6k catalyzed phosphorylation of mTOR at Ser-2448 (50). Cbz-B3A had only a small effect on the phosphorylation of mTOR at Ser-2448 (Fig. 6, a and b), indicating that the Cbz-B3A-mediated decrease in the phosphorylation of Thr-389 does not inactivate p70S6k. Importantly, the levels of mTOR did not change after treatment with Cbz-B3A (Fig. 6c), nor did Raptor levels (Fig. 6d).
FIGURE 5.

Cbz-B3A inhibits mTOR. a, Cbz-B3A inhibits p70S6k Thr-389 phosphorylation. The graph represents the average and standard deviation of the quantification of anti-Thr-389 phosphorylation Western blots done in three independent replicates. b, Cbz-B3A inhibits Thr-389 but not Ser-371 phosphorylation of p70S6k. p70S6k Western blot of HEK-293T cells treated with DMSO, Cbz-Acetyl (10 μm), Cbz-B3A (10 μm), or rapamycin (20 nm) for 4 h. Total anti-p70S6K and anti-phosphoantibodies against Thr-389 and Ser-371 were used for blotting. c, quantification of Fig. 5b. Bars represent the average and standard deviation of the Western blots shown. No change was observed in total p70S6k protein, although a reduction of phosphorylation explains the compactness of the band. n.s., not significant. **, p < 0.01; ***, p < 0.001.
FIGURE 6.

Cbz-B3A and rapamycin have different downstream effects. a, Cbz-B3A has little to no effect on mTOR and mTOR phosphorylation levels. Representative anti-mTOR, p-mTOR Ser-2448, and p-mTOR Ser-2481 Western blot of lysate from HEK-293T cells treated with DMSO, 10 μm Cbz-B3A, 20 nm rapamycin, or 10 μm Cbz-Acetyl for 4 h. b, Cbz-B3A does not have a significant effect on mTOR Ser-2448 phosphorylation. The bars represent the average and standard deviation of the quantification of the 3 independent replicates blotted in Fig. 5a. c, Cbz-B3A does not have a significant effect on mTOR levels. The bars represent the average and standard deviation of the quantification of the 3 independent replicates blotted in Fig. 5a. d, Cbz-B3A has no effect on Raptor levels. Anti-Raptor Western blot of lysate from HEK-293T cells treated with DMSO, 10 μm Cbz-B3A, 20 nm rapamycin, or 10 μm Cbz-Acetyl for 4 h. e, rapamycin inhibits translation. HEK-293T cells were treated with vehicle, 2, 20, and 200 nm rapamycin for 4 h. After 4 h, media was replaced with 35S-labeled media and cells were incubated for 1 h, then lysed. cpm from the lysate was measured and the graph represents the average and standard deviation of 2 independent replicates. The experiment was performed simultaneously with that of Fig. 3b. f, Cbz-B3A is a stronger inhibitor of translation than rapamycin. Cbz-B3A values are as described in the legend from Fig. 3b. Concentrations were chosen based on the values of EC50. Rapa., rapamycin. g, Cbz-B3A increases autophagy. Representative anti-LC3A/B Western blot of lysate from HEK-293T cells treated as in a. h, the bars represent the average and standard deviation of the quantification of LC3 II in g. i, Cbz-B3A has no effect on Akt phosphorylation. Representative anti-phosphorylated Akt Thr-308 and Ser-473 Western blots of lysate from HEK-293T cells treated as in a. j, the bars represent the average and standard deviation of the quantification of i. Significance was determined in comparison to DMSO; n.s., not significant, p > 0.05; *, p < 0.05; **, p < 0.01.
Recent literature suggests that phosphorylation of 4EBP1 is more important than the phosphorylation of p70S6k in regulating the rate of protein biosynthesis (51). Therefore, Cbz-B3A should be a more effective translation inhibitor than rapamycin. Indeed, although saturating concentrations of Cbz-B3A inhibited translation by 68%, we found that saturating rapamycin inhibited translation by only 35% (Fig. 6, e and f).
The inhibition of mTORC1 activates autophagy, and the amount of autophagy correlates with the amount of LC3 A/B II (52). Cbz-B3A increased LC3 A/B II to equivalent levels as rapamycin (Fig. 6, g and h), indicating that both compounds increase autophagy. This observation is further evidence that Cbz-B3A inhibits mTORC1 signaling.
Cbz-B3A Does Not Inhibit mTORC2
Previously reported inhibitors of mTORC1 also inhibit mTORC2, so we examined the effects of Cbz-B3A on the mTORC2-catalyzed phosphorylation of Akt at Ser-473 (17). No decrease in Akt phosphorylation was observed when cells were treated with Cbz-B3A, indicating that Cbz-B3A only inhibits the mTORC1 complex (Fig. 6, i and j). Akt is also upstream of mTORC1, so this observation also indicates Akt does not mediate the inhibition of mTORC1 by Cbz-B3A.
The phosphorylation of mTOR at Ser-2481 is a marker of the mTORC2 complex (53). There was no change in Ser-2481 phosphorylation of mTOR after treatment with Cbz-B3A, indicating that there was no shift of mTOR from mTORC1 to mTORC2 (Fig. 6a). Thus Cbz-B3A does not decrease the levels of mTOR and Raptor, nor does it change the ratio of mTORC1 and mTORC2.
Cbz-B3A Binds Ubiquilins
We designed a SILAC bead pulldown assay to identify proteins that bind the B3A tag. HEK-293T cells were incubated with either media supplemented with [13C/15N]l-arginine and [13C/15N]l-lysine (R6K6) or unlabeled l-arginine and l-lysine (R0K0). B3A beads were incubated with R6K6 lysate and acetyl beads were incubated with R0K0 lysate for a negative control. Proteins were eluted with 1× Laemmli buffer and the eluant was analyzed by mass spectrometry. mTOR and the other components of mTORC1 (Raptor, mLST8, PRAS40, and DEPTOR) were not found in this sample, indicating that mTORC1 does not bind Cbz-B3A directly. 146 proteins were identified with a B3A to acetyl ratio of greater than 2:1, including 47 proteins that were only found in the B3A sample (supplemental Table S1). Ubiquilin 2 was at the top of this list, with seven peptides accounting for 19.9% sequence coverage, including 3 unique peptides. Two homologs of ubiquilin 2, ubiquilin 1 and ubiquilin 4, also bind selectively to the B3A resin, with B3A to acetyl ratios of 7.3:1 and 2.7:1, respectively. Intriguingly, ubiquilin 1 has been reported to bind to mTOR, although the effects of this interaction are unknown (54).
We verified that ubiquilins bind to B3A with immunoblotting. B3A beads bound ubiquilin 1 and ubiquilin 2 sufficiently to deplete the lysate (Fig. 7a). Ubiquilin 4 bound and eluted from B3A beads but did not appear to bind as strongly as ubiquilin 1 and 2. In contrast, no ubiquilin eluted from acetyl beads. mTOR was present in both B3A and acetyl eluants, demonstrating that this interaction was not specific and further indicating that B3A does not bind directly to mTOR.
FIGURE 7.

Ubiquilins bind B3A. a, B3A binds to ubiquilin 1, ubiquilin 2, and ubiquilin 4. Anti-ubiquilins 1, 2, and 4 Western blots of acetyl and B3A pulldown. L, loading; F, flow-through; W, 3rd wash; Elut, elution. b, Cbz-B3A destabilizes ubiquilin 4. The graph represents the quantification of anti-ubiquilin 4 and actin Western blots within a cellular thermal shift assay with treatment of 100 μm Cbz-B3A. Each data point represents the average and standard deviation of 2 independent replicates.
To further confirm Cbz-B3A interacts with ubiquilins, we performed CETSA (42). In CETSA, the thermal stability of a protein is monitored by incubating lysate at different temperatures. When the protein of interest denatures, it precipitates and is depleted from the soluble fraction. Ligands usually stabilize a protein and are expected to shift the melting curve to higher temperatures, although shifts to lower melting points have also been observed (55). When lysate was incubated with Cbz-B3A, there was a clear shift to a lower melting temperature for ubiquilin 4 (Fig. 7b), indicating Cbz-B3A destabilizes this protein. No shift was seen in actin, demonstrating that this was a specific effect. This observation suggests that Cbz-B3A binds to ubiquilin 4 and induces a conformational change. Unfortunately, neither ubiquilin 1 nor ubiquilin 2 melted within the accessible temperature range.
Cbz-B3A Inhibits mTOR through Ubiquilins
To address whether the association of Cbz-B3A with ubiquilins mediates the inhibition of mTORC1, we performed RNAi knockdowns of ubiquilin 1, 2, and 4. Ubiquilin 1, 2, and 4 were knocked down 60, 65, and 52%, respectively (Fig. 8, a and b). No off-target or compensating effects were observed on other ubiquilins. Ubiquilin 2 RNAi increased the hypophosphorylated form of 4EBP1 (Fig. 8, c and d), suggesting that ubiquilin 2 activates mTORC1. No change in 4EBP1 phosphorylation was observed with either ubiquilin 1 or ubiquilin 4 knockdown.
FIGURE 8.

The inhibition of 4EBP1 phosphorylation by Cbz-B3A requires ubiquilins. a, ubiquilins knockdowns. Anti-ubiquilin Western blots of samples to verify knockdown of specific ubiquilins. b, the bars represent the average and standard deviation of the quantification of a. c, ubiquilins 2 and 4 affect mTORC1 activity. Lysate from cells treated with scramble, ubiquilin 1, ubiquilin 2, or ubiquilin 4 RNAi 72 h prior to treatment with 3 μm Cbz-B3A for 4 h. The lysate was blotted against 4EBP1. Protein knockdown was verified as shown in a and b. d, bars represent the quantification and standard deviation of hypophosphorylated 4EBP1 in c. Significance of ubiquilin 2 RNAi DMSO and ubiquilin 4 RNAi 3 μm Cbz-B3A determined in comparison to scramble RNAi with the same treatment. e, percent increase of hypophosphorylation from DMSO to 3 μm Cbz-B3A treatment calculated from d. Significance was determined in comparison to DMSO. f, the effect of Cbz-B3A on Rheb. HEK-293T cells were treated as described in the legend to Fig. 4a and immunoblotted against Rheb and actin. g, the effect of Cbz-B3A on TSC2 as in f, and immunoblotted against TSC2 and actin. n.s., not significant, p > 0.05; *, p < 0.05; **, p < 0.01.
We also observed the effect of ubiquilin knockdown in the context of Cbz-B3A treatment. Cells were treated with 3 μm Cbz-B3A so that either an increase or a decrease in 4EBP1 phosphorylation could be detected. The knockdown of both ubiquilin 2 and ubiquilin 4 decreased the ability of Cbz-B3A to block the phosphorylation of 4EBP1, whereas the knockdown of ubiquilin 1 had no effect on Cbz-B3A (Fig. 8, c–e). Thus ubiquilins 2 and 4 mediate the inhibition of mTORC1 by Cbz-B3A.
Ubiquilins 2 and 4 Do Not Interact with mTOR
We hypothesized that ubiquilin 2 and/or 4 might interact with mTORC1. Because neither mTOR nor any components of mTORC1 were found in SILAC pulldowns, either ubiquilins do not form a stable complex with mTORC1 or B3A disrupts this complex. However, we were unable to detect any ubiquilins in mTOR pulldowns in the absence or presence of Cbz-B3A under a variety of lysis/wash buffers and different lysis methods. We were able to verify that ubiquilin 1 binds the first 670 amino acids of mTOR in a yeast 2-hybrid (54), but only when ubiquilin 1 was the prey. We did not observe a similar interaction with mTOR(1–670) and ubiquilin 4 (data not shown).
We also performed FRET assays to determine whether ubiquilin binds to mTOR within the context of living cells. HEK-293T cells were transfected with ubiquilins 1, 2, or 4 fused to Cerulean as the donor and mTOR fused with Venus as the acceptor. Both the N-terminal and C-terminal fusion proteins were tested. FRET efficiency was measured by FRET after acceptor photobleaching. No evidence of FRET was observed with any of the combinations of ubiquilin and mTOR in the absence or presence of Cbz-B3A (data not shown).
Cbz-B3A Does Not Change Levels of TSC2 or Rheb
Ubiquilins modulate protein degradation, increasing the degradation of some proteins and protecting others (56). However, no change in the levels of mTOR, 4EBP1, p70S6k, or Raptor was observed with Cbz-B3A treatment (see Figs. 4a, 5b, and 6, a and d). Two proteins that modulate mTORC1 activity were also enriched in the B3A eluant, Ras homolog enriched in brain (Rheb) and its GTPase activating protein TSC2 (supplemental Table S1) (15). Rheb is a direct upstream activator of mTORC1, whereas TSC2 inhibits Rheb action (14, 15). Rheb was ranked 109 with a B3A:acetyl ratio of 2.5:1. TSC2 ranked 22nd and was only found in the B3A eluant. No effect was observed on the quantity of either of these proteins after cells were treated with Cbz-B3A (Fig. 8, f and g).
Cbz-B3A Slows Cellular Growth
Because inhibition of mTORC1 slows cellular proliferation (57), we investigated the proliferation of several different cell lines after treatment with Cbz-B3A. The proliferation of HEK-293T, K562, and BaF3/p210 cells, measured by CellTiter Glo, was significantly slowed by treatment with as little as 1 μm Cbz-B3A for 48 h. Maximum growth inhibition was seen at 10 μm Cbz-B3A treatment. Proliferation of HEK-293T, K562, and BaF3/p210 was inhibited by 64, 52, and 68%, respectively (Fig. 9a). Importantly, Cbz-B3A was not cytotoxic to the cells as measured by the release of lactate dehydrogenase (Fig. 9b).
FIGURE 9.
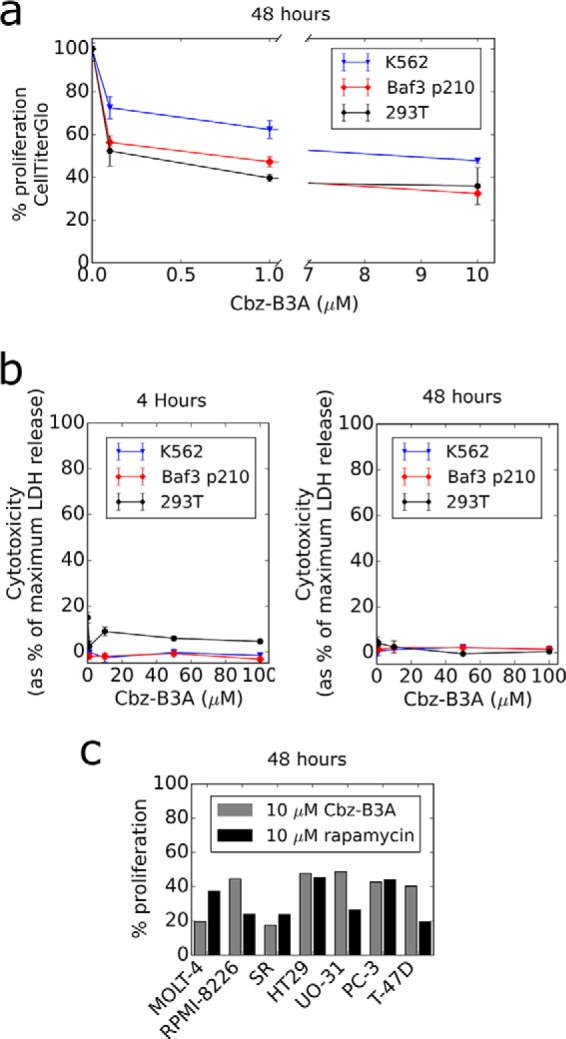
Cbz-B3A slows proliferation but is not cytotoxic. a, CellTiterGlo assay of K562, BaF3/p210, and HEK-293T cells treated for 48 h. Two different scales are used on the x axis to visualize low concentrations. All data points represent the average and standard deviation of 3 independent replicates. b, LDH release assay of K562, BaF3/p210, and HEK-293T cells treated for 4 and 48 h. All data points represent the average and standard deviation of 3 independent replicates except K562 at 48 h, which represents 2 independent replicates. c, graph of cell lines showing lower than 50% proliferation from the NCI-60 DTP Human Tumor Cell Line Screen. Cells were treated for 48 h with 10 μm Cbz-B3A or 10 μm rapamycin. Rapamycin data were retrieved from the NCI-60 DTP Human Tumor Cell Line Screen website.
Cbz-B3A was also evaluated in the NCI-60 DTP Human Tumor Cell Line Screen (43). The average decrease in proliferation was 29% for all cell lines after 48 h treatment with 10 μm Cbz-B3A. The inhibition of proliferation for K562 cells was 39%, consistent with CellTiter Glo findings (Fig. 10). The most sensitive cell lines were MOLT-4 and SR with a decrease in proliferation of 80 and 83%, respectively (Fig. 9c). MOLT-4 and SR cell lines were also more sensitive to 10 μm Cbz-B3A than 10 μm rapamycin. This is consistent with other reports that show MOLT-4 may be dependent on mTORC1 for cellular growth (58). Both MOLT-4 and SR cell lines derive from leukemia patients and Cbz-B3A has the largest effect within this category of cancer (Fig. 10).
FIGURE 10.

Cbz-B3A slows proliferation. The NCI-60 DTP Human Tumor Cell Line Screen. Cells were treated for 48 h with 10 μm Cbz-B3A. % proliferation was measured relative to untreated cells. First dash line represents average % proliferation of all cell lines. Second dash line represents 100% proliferation.
Discussion
Taken together, our experiments show that Cbz-B3A inhibits translation by blocking the phosphorylation of 4EBP1. Although 4EBP1 appears to be a substrate for several protein kinases, the majority of 4EBP1 phosphorylation occurs via the action of mTORC1. Cbz-B3A also inhibits two mTORC1-regulated events, the phosphorylation of p70S6k and autophagy. These observations strongly suggest that mTORC1 signaling is the target. However, Cbz-B3A does not appear to interact directly with mTORC1. Instead, inhibition is mediated by ubiquilins 2 and 4, although the exact mechanism remains to be determined. Unlike other mTOR inhibitors, Cbz-B3A efficiently blocks 4EBP1 phosphorylation but only partially inhibits the phosphorylation of p70S6k. In contrast, rapamycin, preferentially inhibits the phosphorylation of p70S6k by mTORC1, whereas Torin inhibits the phosphorylation of all mTOR substrates in the contexts of both mTORC1 and mTORC2. Cbz-B3A does not inhibit mTORC2 under the conditions of our experiments, although it is possible that mTORC2 inhibition might occur with extensive incubation, as observed with rapamycin. Both our data and previous literature suggest that the phosphorylation of 4EBP1 is more important than p70S6k phosphorylation for translation regulation (51). We find that Cbz-B3A inhibits a larger fraction of translation than rapamycin even though Cbz-B3A does not inactivate p70S6k. Torin 1 has little effect on translation in 4EBP1 double knock-out cells (51). Thus it follows that 4EBP1 is the critical downstream effector of mTORC1 for translation control.
Ubiquilins have a well recognized role in protein homeostasis, and our results suggest that ubiquilins may provide a previously unappreciated link between mTOR signaling and cytosolic protein quality. All ubiquilins contain a ubiquitin-like (Ubl) domain at the N terminus and a ubiquitin association (Uba) domain at the C terminus. There is strong evidence that both ubiquilin 1 and ubiquilin 2 interact with the proteasome through the Ubl domain (59) and that ubiquilin 1 binds polyubiquitinated chains through the Uba domain (60, 61). Furthermore, these proteins play a role in diseases caused by protein aggregation in neurodegeneration (62–65), which suggests that ubiquilins are involved in protein homeostasis within the cytoplasm. Additionally, ubiquilins are involved in autophagy mediated protein degradation (66, 67). Ubiquilin 4 associates with LC3 and facilitates the localization of ubiquilin 1 to autophagosomes (68). Ubiquilin 1 also binds to mTOR(1–670), although overexpression of ubiquilin 1 has no apparent effect on mTOR activity (54). We show that the knockdown of ubiquilin 2 decreases 4EBP1 phosphorylation, indicating that ubiquilin 2 activates mTOR. Both ubiquilin 2 and ubiquilin 4 mediate the inhibition of mTORC1 by Cbz-B3A. However, we have not observed an interaction between mTOR and ubiquilin 2 or ubiquilin 4 in co-immunoprecipitates, FRET assays, or yeast 2-hybrid experiments. Both the mTORC1 activator Rheb, and Rheb inhibitor TSC2 were found in the B3A eluant, indicating that it is possible that ubiquilin is mediating mTORC1 inhibition through these proteins, although the mechanism is still unclear. It is also possible that the decrease in 4EBP1 phosphorylation results from activation of a phosphatase rather than inhibition of the mTORC1 kinase. How Cbz-B3A and ubiquilins interact to inhibit mTORC1 signaling remains to be elucidated.
mTOR is a target for the treatment of many diseases, including cancer, diabetes, neurodegeneration, as well as of aging. Rapamycin is used as an immunosuppressive and in cancer combination therapy, and torins have entered cancer clinical trials. Rapamycin is also beneficial in animal models of Parkinson, Huntington, and Alzheimer diseases (69), and prolongs lifespan in yeast, worms, fruit flies, and mice (5–8). Many of these effects have been attributed to the inhibition of translation (7, 70). The inhibition of 4EBP1 phosphorylation in particular is believed to mediate the effects of rapamycin on cancer (71) and Parkinson disease (72). Cbz-B3A provides a novel strategy to block translation via 4EBP1 phosphorylation that may also be an effective treatment for these devastating diseases.
Author Contributions
R. T. C. conceived and designed the study, developed the methodology, performed and analyzed most of the experiments, and wrote most of the paper. Y. S. and M. J. C. L. synthesized the compounds and contributed to the design. M. M. designed the study, helped with analysis, and edited the paper. L. H. conceived and designed the study, supervised the project, and wrote the paper.
Supplementary Material
Acknowledgment
We thank Deviprasad Gollapalli for helpful discussion and acknowledge the Developmental Therapeutics Program NCI/National Institutes of Health for the 60 cell line screenings.
This work was supported, in whole or in part, by National Institutes of Health Grants 5 RO1 GM100921 (to L. H.) and 5 T32 GM007122 and a Brandeis Sprout grant (to R. T. C.). The authors declare that they have no conflicts of interest with the contents of this article.

This article contains supplemental Table S1.
- mTOR
- mammalian target of rapamycin
- eDHFR
- E. coli dihydrofolate reductase
- mTORC1
- mTOR complex 1
- mTORC2
- mTOR complex 2
- p70S6k
- p70 S6 kinase
- SILAC
- stable isotope labeling with amino acids in cell culture
- RSV
- Rous sarcoma virus
- DMSO
- dimethyl sulfoxide
- LDH
- lactate dehydrogenase
- CETSA
- cellular thermal shift assay
- B3A
- Boc3Arg.
References
- 1. Guertin D. A., and Sabatini D. M. (2007) Defining the role of mTOR in cancer. Cancer Cell 12, 9–22 [DOI] [PubMed] [Google Scholar]
- 2. Briaud I., Dickson L. M., Lingohr M. K., McCuaig J. F., Lawrence J. C., and Rhodes C. J. (2005) Insulin receptor substrate-2 proteasomal degradation mediated by a mammalian target of rapamycin (mTOR)-induced negative feedback down-regulates protein kinase B-mediated signaling pathway in beta-cells. J. Biol. Chem. 280, 2282–2293 [DOI] [PubMed] [Google Scholar]
- 3. Liu P., Cheng H., Roberts T. M., and Zhao J. J. (2009) Targeting the phosphoinositide 3-kinase pathway in cancer. Nat. Rev. Drug Discov. 8, 627–644 [DOI] [PMC free article] [PubMed] [Google Scholar]
- 4. Laplante M., and Sabatini D. M. (2012) mTOR signaling in growth control and disease. Cell 149, 274–293 [DOI] [PMC free article] [PubMed] [Google Scholar]
- 5. Powers R. W. 3rd, Kaeberlein M., Caldwell S. D., Kennedy B. K., and Fields S. (2006) Extension of chronological life span in yeast by decreased TOR pathway signaling. Genes Dev. 20, 174–184 [DOI] [PMC free article] [PubMed] [Google Scholar]
- 6. Harrison D. E., Strong R., Sharp Z. D., Nelson J. F., Astle C. M., Flurkey K., Nadon N. L., Wilkinson J. E., Frenkel K., Carter C. S., Pahor M., Javors M. A., Fernandez E., and Miller R. A. (2009) Rapamycin fed late in life extends lifespan in genetically heterogeneous mice. Nature 460, 392–395 [DOI] [PMC free article] [PubMed] [Google Scholar]
- 7. Bjedov I., Toivonen J. M., Kerr F., Slack C., Jacobson J., Foley A., and Partridge L. (2010) Mechanisms of life span extension by rapamycin in the fruit fly Drosophila melanogaster. Cell Metab. 11, 35–46 [DOI] [PMC free article] [PubMed] [Google Scholar]
- 8. Robida-Stubbs S., Glover-Cutter K., Lamming D. W., Mizunuma M., Narasimhan S. D., Neumann-Haefelin E., Sabatini D. M., and Blackwell T. K. (2012) TOR signaling and rapamycin influence longevity by regulating SKN-1/Nrf and DAF-16/FoxO. Cell Metab. 15, 713–724 [DOI] [PMC free article] [PubMed] [Google Scholar]
- 9. Sarbassov D. D., Ali S. M., Kim D. H., Guertin D. A., Latek R. R., Erdjument-Bromage H., Tempst P., and Sabatini D. M. (2004) Rictor, a novel binding partner of mTOR, defines a rapamycin-insensitive and raptor-independent pathway that regulates the cytoskeleton. Curr. Biol. 14, 1296–1302 [DOI] [PubMed] [Google Scholar]
- 10. Hara K., Maruki Y., Long X., Yoshino K., Oshiro N., Hidayat S., Tokunaga C., Avruch J., and Yonezawa K. (2002) Raptor, a binding partner of target of rapamycin (TOR), mediates TOR action. Cell 110, 177–189 [DOI] [PubMed] [Google Scholar]
- 11. Inoki K., Li Y., Zhu T., Wu J., and Guan K. L. (2002) TSC2 is phosphorylated and inhibited by Akt and suppresses mTOR signalling. Nat. Cell Biol. 4, 648–657 [DOI] [PubMed] [Google Scholar]
- 12. Ma L., Chen Z., Erdjument-Bromage H., Tempst P., and Pandolfi P. P. (2005) Phosphorylation and functional inactivation of TSC2 by Erk implications for tuberous sclerosis and cancer pathogenesis. Cell 121, 179–193 [DOI] [PubMed] [Google Scholar]
- 13. Inoki K., Ouyang H., Zhu T., Lindvall C., Wang Y., Zhang X., Yang Q., Bennett C., Harada Y., Stankunas K., Wang C. Y., He X., MacDougald O. A., You M., Williams B. O., and Guan K. L. (2006) TSC2 integrates Wnt and energy signals via a coordinated phosphorylation by AMPK and GSK3 to regulate cell growth. Cell 126, 955–968 [DOI] [PubMed] [Google Scholar]
- 14. Garami A., Zwartkruis F. J., Nobukuni T., Joaquin M., Roccio M., Stocker H., Kozma S. C., Hafen E., Bos J. L., and Thomas G. (2003) Insulin activation of Rheb, a mediator of mTOR/S6K/4E-BP signaling, is inhibited by TSC1 and 2. Mol. Cell 11, 1457–1466 [DOI] [PubMed] [Google Scholar]
- 15. Inoki K., Li Y., Xu T., and Guan K. L. (2003) Rheb GTPase is a direct target of TSC2 GAP activity and regulates mTOR signaling. Genes Dev. 17, 1829–1834 [DOI] [PMC free article] [PubMed] [Google Scholar]
- 16. Masui K., Cavenee W. K., and Mischel P. S. (2014) mTORC2 in the center of cancer metabolic reprogramming. Trends Endocrinol. Metab. 25, 364–373 [DOI] [PMC free article] [PubMed] [Google Scholar]
- 17. Sarbassov D. D., Guertin D. A., Ali S. M., and Sabatini D. M. (2005) Phosphorylation and regulation of Akt/PKB by the rictor-mTOR complex. Science 307, 1098–1101 [DOI] [PubMed] [Google Scholar]
- 18. García-Martínez J. M., and Alessi D. R. (2008) mTOR complex 2 (mTORC2) controls hydrophobic motif phosphorylation and activation of serum- and glucocorticoid-induced protein kinase 1 (SGK1). Biochem. J. 416, 375–385 [DOI] [PubMed] [Google Scholar]
- 19. Pause A., Belsham G. J., Gingras A. C., Donzé O., Lin T. A., Lawrence J. C. Jr., and Sonenberg N. (1994) Insulin-dependent stimulation of protein synthesis by phosphorylation of a regulator of 5′-cap function. Nature 371, 762–767 [DOI] [PubMed] [Google Scholar]
- 20. Sonenberg N., Rupprecht K. M., Hecht S. M., and Shatkin A. J. (1979) Eukaryotic mRNA cap binding protein: purification by affinity chromatography on Sepharose-coupled m7GDP. Proc. Natl. Acad. Sci. U.S.A. 76, 4345–4349 [DOI] [PMC free article] [PubMed] [Google Scholar]
- 21. Gingras A. C., Raught B., and Sonenberg N. (1999) eIF4 initiation factors: effectors of mRNA recruitment to ribosomes and regulators of translation. Annu. Rev. Biochem. 68, 913–963 [DOI] [PubMed] [Google Scholar]
- 22. Gingras A. C., Raught B., Gygi S. P., Niedzwiecka A., Miron M., Burley S. K., Polakiewicz R. D., Wyslouch-Cieszynska A., Aebersold R., and Sonenberg N. (2001) Hierarchical phosphorylation of the translation inhibitor 4E-BP1. Genes Dev. 15, 2852–2864 [DOI] [PMC free article] [PubMed] [Google Scholar]
- 23. Pons B., Armengol G., Livingstone M., López L., Coch L., Sonenberg N., and Ramón y Cajal S. (2012) Association between LRRK2 and 4E-BP1 protein levels in normal and malignant cells. Oncol. Rep. 27, 225–231 [DOI] [PubMed] [Google Scholar]
- 24. Ali S. M., and Sabatini D. M. (2005) Structure of S6 kinase 1 determines whether raptor-mTOR or rictor-mTOR phosphorylates its hydrophobic motif site. J. Biol. Chem. 280, 19445–19448 [DOI] [PubMed] [Google Scholar]
- 25. Pullen N., Dennis P. B., Andjelkovic M., Dufner A., Kozma S. C., Hemmings B. A., and Thomas G. (1998) Phosphorylation and activation of p70s6k by PDK1. Science 279, 707–710 [DOI] [PubMed] [Google Scholar]
- 26. Shin S., Wolgamott L., Yu Y., Blenis J., and Yoon S. O. (2011) Glycogen synthase kinase (GSK)-3 promotes p70 ribosomal protein S6 kinase (p70S6K) activity and cell proliferation. Proc. Natl. Acad. Sci. U.S.A. 108, E1204–1213 [DOI] [PMC free article] [PubMed] [Google Scholar]
- 27. Jefferies H. B., Fumagalli S., Dennis P. B., Reinhard C., Pearson R. B., and Thomas G. (1997) Rapamycin suppresses 5′TOP mRNA translation through inhibition of p70S6k. EMBO J. 16, 3693–3704 [DOI] [PMC free article] [PubMed] [Google Scholar]
- 28. Hosokawa N., Hara T., Kaizuka T., Kishi C., Takamura A., Miura Y., Iemura S., Natsume T., Takehana K., Yamada N., Guan J. L., Oshiro N., and Mizushima N. (2009) Nutrient-dependent mTORC1 association with the ULK1-Atg13-FIP200 complex required for autophagy. Mol. Biol. Cell 20, 1981–1991 [DOI] [PMC free article] [PubMed] [Google Scholar]
- 29. Jung C. H., Jun C. B., Ro S. H., Kim Y. M., Otto N. M., Cao J., Kundu M., and Kim D. H. (2009) ULK-Atg13-FIP200 complexes mediate mTOR signaling to the autophagy machinery. Mol. Biol. Cell 20, 1992–2003 [DOI] [PMC free article] [PubMed] [Google Scholar]
- 30. Hara T., Takamura A., Kishi C., Iemura S., Natsume T., Guan J. L., and Mizushima N. (2008) FIP200, a ULK-interacting protein, is required for autophagosome formation in mammalian cells. J. Cell Biol. 181, 497–510 [DOI] [PMC free article] [PubMed] [Google Scholar]
- 31. He C., and Klionsky D. J. (2009) Regulation mechanisms and signaling pathways of autophagy. Annu. Rev. Genet. 43, 67–93 [DOI] [PMC free article] [PubMed] [Google Scholar]
- 32. Chiu M. I., Katz H., and Berlin V. (1994) RAPT1, a mammalian homolog of yeast Tor, interacts with the FKBP12/rapamycin complex. Proc. Natl. Acad. Sci. U.S.A. 91, 12574–12578 [DOI] [PMC free article] [PubMed] [Google Scholar]
- 33. Sarbassov D. D., Ali S. M., Sengupta S., Sheen J. H., Hsu P. P., Bagley A. F., Markhard A. L., and Sabatini D. M. (2006) Prolonged rapamycin treatment inhibits mTORC2 assembly and Akt/PKB. Mol. Cell 22, 159–168 [DOI] [PubMed] [Google Scholar]
- 34. Edinger A. L., Linardic C. M., Chiang G. G., Thompson C. B., and Abraham R. T. (2003) Differential effects of rapamycin on mammalian target of rapamycin signaling functions in mammalian cells. Cancer Res. 63, 8451–8460 [PubMed] [Google Scholar]
- 35. Thoreen C. C., Kang S. A., Chang J. W., Liu Q., Zhang J., Gao Y., Reichling L. J., Sim T., Sabatini D. M., and Gray N. S. (2009) An ATP-competitive mammalian target of rapamycin inhibitor reveals rapamycin-resistant functions of mTORC1. J. Biol. Chem. 284, 8023–8032 [DOI] [PMC free article] [PubMed] [Google Scholar]
- 36. Pearson R. B., Dennis P. B., Han J. W., Williamson N. A., Kozma S. C., Wettenhall R. E., and Thomas G. (1995) The principal target of rapamycin-induced p70S6k inactivation is a novel phosphorylation site within a conserved hydrophobic domain. EMBO J. 14, 5279–5287 [DOI] [PMC free article] [PubMed] [Google Scholar]
- 37. Livingstone M., and Bidinosti M. (2012) Rapamycin-insensitive mTORC1 activity controls eIF4E:4E-BP1 binding. F1000Research 1, 4. [DOI] [PMC free article] [PubMed] [Google Scholar]
- 38. Dowling R. J., Topisirovic I., Alain T., Bidinosti M., Fonseca B. D., Petroulakis E., Wang X., Larsson O., Selvaraj A., Liu Y., Kozma S. C., Thomas G., and Sonenberg N. (2010) mTORC1-mediated cell proliferation, but not cell growth, controlled by the 4E-BPs. Science 328, 1172–1176 [DOI] [PMC free article] [PubMed] [Google Scholar]
- 39. Zaytseva Y. Y., Valentino J. D., Gulhati P., and Evers B. M. (2012) mTOR inhibitors in cancer therapy. Cancer Lett. 319, 1–7 [DOI] [PubMed] [Google Scholar]
- 40. Long M. J., Gollapalli D. R., and Hedstrom L. (2012) Inhibitor mediated protein degradation. Chem. Biol. 19, 629–637 [DOI] [PMC free article] [PubMed] [Google Scholar]
- 41. Schneider C. A., Rasband W. S., and Eliceiri K. W. (2012) NIH Image to ImageJ: 25 years of image analysis. Nat. Methods 9, 671–675 [DOI] [PMC free article] [PubMed] [Google Scholar]
- 42. Martinez Molina D., Jafari R., Ignatushchenko M., Seki T., Larsson E. A., Dan C., Sreekumar L., Cao Y., and Nordlund P. (2013) Monitoring drug target engagement in cells and tissues using the cellular thermal shift assay. Science 341, 84–87 [DOI] [PubMed] [Google Scholar]
- 43. Alley M. C., Scudiero D. A., Monks A., Hursey M. L., Czerwinski M. J., Fine D. L., Abbott B. J., Mayo J. G., Shoemaker R. H., and Boyd M. R. (1988) Feasibility of drug screening with panels of human tumor cell lines using a microculture tetrazolium assay. Cancer Res. 48, 589–601 [PubMed] [Google Scholar]
- 44. Thorne N., Shen M., Lea W. A., Simeonov A., Lovell S., Auld D. S., and Inglese J. (2012) Firefly luciferase in chemical biology: a compendium of inhibitors, mechanistic evaluation of chemotypes, and suggested use as a reporter. Chem. Biol. 19, 1060–1072 [DOI] [PMC free article] [PubMed] [Google Scholar]
- 45. Deroo B. J., and Archer T. K. (2002) Proteasome inhibitors reduce luciferase and β-galactosidase activity in tissue culture cells. J. Biol. Chem. 277, 20120–20123 [DOI] [PubMed] [Google Scholar]
- 46. Harding H. P., Zhang Y., Bertolotti A., Zeng H., and Ron D. (2000) Perk is essential for translational regulation and cell survival during the unfolded protein response. Mol. Cell 5, 897–904 [DOI] [PubMed] [Google Scholar]
- 47. Dever T. E., Feng L., Wek R. C., Cigan A. M., Donahue T. F., and Hinnebusch A. G. (1992) Phosphorylation of initiation factor 2α by protein kinase GCN2 mediates gene-specific translational control of GCN4 in yeast. Cell 68, 585–596 [DOI] [PubMed] [Google Scholar]
- 48. Oslowski C. M., and Urano F. (2011) Measuring ER stress and the unfolded protein response using mammalian tissue culture system. Methods Enzymol. 490, 71–92 [DOI] [PMC free article] [PubMed] [Google Scholar]
- 49. Choo A. Y., Yoon S. O., Kim S. G., Roux P. P., and Blenis J. (2008) Rapamycin differentially inhibits S6Ks and 4E-BP1 to mediate cell-type-specific repression of mRNA translation. Proc. Natl. Acad. Sci. U.S.A. 105, 17414–17419 [DOI] [PMC free article] [PubMed] [Google Scholar]
- 50. Chiang G. G., and Abraham R. T. (2005) Phosphorylation of mammalian target of rapamycin (mTOR) at Ser-2448 is mediated by p70 S6 kinase. J. Biol. Chem. 280, 25485–25490 [DOI] [PubMed] [Google Scholar]
- 51. Thoreen C. C., Chantranupong L., Keys H. R., Wang T., Gray N. S., and Sabatini D. M. (2012) A unifying model for mTORC1-mediated regulation of mRNA translation. Nature 485, 109–113 [DOI] [PMC free article] [PubMed] [Google Scholar]
- 52. Kabeya Y., Mizushima N., Ueno T., Yamamoto A., Kirisako T., Noda T., Kominami E., Ohsumi Y., and Yoshimori T. (2000) LC3, a mammalian homologue of yeast Apg8p, is localized in autophagosome membranes after processing. EMBO J. 19, 5720–5728 [DOI] [PMC free article] [PubMed] [Google Scholar]
- 53. Copp J., Manning G., and Hunter T. (2009) TORC-specific phosphorylation of mammalian target of rapamycin (mTOR): phospho-Ser2481 is a marker for intact mTOR signaling complex 2. Cancer Res. 69, 1821–1827 [DOI] [PMC free article] [PubMed] [Google Scholar]
- 54. Wu S., Mikhailov A., Kallo-Hosein H., Hara K., Yonezawa K., and Avruch J. (2002) Characterization of ubiquilin 1, an mTOR-interacting protein. Biochim. Biophys. Acta 1542, 41–56 [DOI] [PubMed] [Google Scholar]
- 55. Teilum K., Olsen J. G., and Kragelund B. B. (2011) Protein stability, flexibility and function. Biochim. Biophys. Acta 1814, 969–976 [DOI] [PubMed] [Google Scholar]
- 56. Su V., and Lau A. F. (2009) Ubiquitin-like and ubiquitin-associated domain proteins: significance in proteasomal degradation. Cell Mol. Life Sci. 66, 2819–2833 [DOI] [PMC free article] [PubMed] [Google Scholar]
- 57. Abraham R. T., and Wiederrecht G. J. (1996) Immunopharmacology of rapamycin. Annu. Rev. Immunol. 14, 483–510 [DOI] [PubMed] [Google Scholar]
- 58. Lekmine F., Uddin S., Sassano A., Parmar S., Brachmann S. M., Majchrzak B., Sonenberg N., Hay N., Fish E. N., and Platanias L. C. (2003) Activation of the p70 S6 kinase and phosphorylation of the 4E-BP1 repressor of mRNA translation by type I interferons. J. Biol. Chem. 278, 27772–27780 [DOI] [PubMed] [Google Scholar]
- 59. Kleijnen M. F., Shih A. H., Zhou P., Kumar S., Soccio R. E., Kedersha N. L., Gill G., and Howley P. M. (2000) The hPLIC proteins may provide a link between the ubiquitination machinery and the proteasome. Mol. Cell 6, 409–419 [DOI] [PubMed] [Google Scholar]
- 60. Zhang D., Raasi S., and Fushman D. (2008) Affinity makes the difference: nonselective interaction of the UBA domain of Ubiquilin-1 with monomeric ubiquitin and polyubiquitin chains. J. Mol. Biol. 377, 162–180 [DOI] [PMC free article] [PubMed] [Google Scholar]
- 61. Raasi S., Varadan R., Fushman D., and Pickart C. M. (2005) Diverse polyubiquitin interaction properties of ubiquitin-associated domains. Nat. Struct. Mol. Biol. 12, 708–714 [DOI] [PubMed] [Google Scholar]
- 62. Safren N., El Ayadi A., Chang L., Terrillion C. E., Gould T. D., Boehning D. F., and Monteiro M. J. (2014) Ubiquilin-1 overexpression increases the lifespan and delays accumulation of Huntingtin aggregates in the R6/2 mouse model of Huntington's disease. PLoS ONE 9, e87513. [DOI] [PMC free article] [PubMed] [Google Scholar]
- 63. Bertram L., Hiltunen M., Parkinson M., Ingelsson M., Lange C., Ramasamy K., Mullin K., Menon R., Sampson A. J., Hsiao M. Y., Elliott K. J., Velicelebi G., Moscarillo T., Hyman B. T., Wagner S. L., Becker K. D., Blacker D., and Tanzi R. E. (2005) Family-based association between Alzheimer's disease and variants in UBQLN1. N. Engl. J. Med. 352, 884–894 [DOI] [PubMed] [Google Scholar]
- 64. Deng H. X., Chen W., Hong S. T., Boycott K. M., Gorrie G. H., Siddique N., Yang Y., Fecto F., Shi Y., Zhai H., Jiang H., Hirano M., Rampersaud E., Jansen G. H., Donkervoort S., Bigio E. H., Brooks B. R., Ajroud K., Sufit R. L., Haines J. L., Mugnaini E., Pericak-Vance M. A., and Siddique T. (2011) Mutations in UBQLN2 cause dominant X-linked juvenile and adult-onset ALS and ALS/dementia. Nature 477, 211–215 [DOI] [PMC free article] [PubMed] [Google Scholar]
- 65. Davidson J. D., Riley B., Burright E. N., Duvick L. A., Zoghbi H. Y., and Orr H. T. (2000) Identification and characterization of an ataxin-1-interacting protein: A1Up, a ubiquitin-like nuclear protein. Hum. Mol. Genet. 9, 2305–2312 [DOI] [PubMed] [Google Scholar]
- 66. N′Diaye E. N., Kajihara K. K., Hsieh I., Morisaki H., Debnath J., and Brown E. J. (2009) PLIC proteins or ubiquilins regulate autophagy-dependent cell survival during nutrient starvation. EMBO Rep. 10, 173–179 [DOI] [PMC free article] [PubMed] [Google Scholar]
- 67. Rothenberg C., Srinivasan D., Mah L., Kaushik S., Peterhoff C. M., Ugolino J., Fang S., Cuervo A. M., Nixon R. A., and Monteiro M. J. (2010) Ubiquilin functions in autophagy and is degraded by chaperone-mediated autophagy. Hum. Mol. Genet. 19, 3219–3232 [DOI] [PMC free article] [PubMed] [Google Scholar]
- 68. Lee D. Y., Arnott D., and Brown E. J. (2013) Ubiquilin4 is an adaptor protein that recruits Ubiquilin1 to the autophagy machinery. EMBO Rep. 14, 373–381 [DOI] [PMC free article] [PubMed] [Google Scholar]
- 69. Bové J., Martínez-Vicente M., and Vila M. (2011) Fighting neurodegeneration with rapamycin: mechanistic insights. Nat. Rev. Neurosci. 12, 437–452 [DOI] [PubMed] [Google Scholar]
- 70. Kapahi P., Chen D., Rogers A. N., Katewa S. D., Li P. W., Thomas E. L., and Kockel L. (2010) With TOR, less is more: a key role for the conserved nutrient-sensing TOR pathway in aging. Cell Metab. 11, 453–465 [DOI] [PMC free article] [PubMed] [Google Scholar]
- 71. Houghton P. J., Morton C. L., Gorlick R., Lock R. B., Carol H., Reynolds C. P., Kang M. H., Maris J. M., Keir S. T., Kolb E. A., Wu J., Wozniak A. W., Billups C. A., Rubinstein L., and Smith M. A. (2010) Stage 2 combination testing of rapamycin with cytotoxic agents by the Pediatric Preclinical Testing Program. Mol. Cancer Ther. 9, 101–112 [DOI] [PMC free article] [PubMed] [Google Scholar]
- 72. Tain L. S., Mortiboys H., Tao R. N., Ziviani E., Bandmann O., and Whitworth A. J. (2009) Rapamycin activation of 4E-BP prevents parkinsonian dopaminergic neuron loss. Nat. Neurosci. 12, 1129–1135 [DOI] [PMC free article] [PubMed] [Google Scholar]
Associated Data
This section collects any data citations, data availability statements, or supplementary materials included in this article.