

Abstract
Romk knock-out mice show a similar phenotype to Bartter syndrome of salt wasting and dehydration due to reduced Na-K-2Cl-cotransporter activity. At least three ROMK isoforms have been identified in the kidney; however, unique functions of any of the isoforms in nephron segments are still poorly understood. We have generated a mouse deficient only in Romk1 by selective deletion of the Romk1-specific first exon using an ES cell Cre-LoxP strategy and examined the renal phenotypes, ion transporter expression, ROMK channel activity, and localization under normal and high K intake. Unlike Romk−/− mice, there was no Bartter phenotype with reduced NKCC2 activity and increased NCC expression in Romk1−/− mice. The small conductance K channel (SK) activity showed no difference of channel properties or gating in the collecting tubule between Romk1+/+ and Romk1−/− mice. High K intake increased SK channel number per patch and increased the ROMK channel intensity in the apical membrane of the collecting tubule in Romk1+/+, but such regulation by high K intake was diminished with significant hyperkalemia in Romk1−/− mice. We conclude that 1) animal knockouts of ROMK1 do not produce Bartter phenotype. 2) There is no functional linking of ROMK1 and NKCC2 in the TAL. 3) ROMK1 is critical in response to high K intake-stimulated K+ secretion in the collecting tubule.
Keywords: patch clamp, potassium channel, potassium transport, sodium transport, transgenic mice, Bartter syndrome, K channel, ROMK isoforms, sodium and potassium homeostasis
Introduction
The renal outer medullary potassium channel (ROMK)3 is an ATP-dependent potassium channel (Kir1.1) that forms apical K channels that play an important role in K+ recycling to support sodium and chloride absorption in the thick ascending limb (TAL), and in regulation of K+ secretion in the collecting duct (CD). Mutations in the ROMK channel cause Type II Bartter syndrome that presents with polyhydramnios and postnatal life threatening volume depletion caused by loss of salt reabsorbing capacity by the thick ascending limb (1). Romk knock-out mice, originally generated from Gary Shull's lab at the University of Cincinnati, exhibited the same phenotypes as the Bartter syndrome in humans (2). By using the Romk Bartter mouse model, we have further confirmed that ROMK forms both small conductance K+ channels (SK) and 70 pS K channels in apical membranes of the thick ascending limb and cortical collecting duct (3, 4). We have demonstrated: 1) absence of both SK activity and 70 pS K+ channels in apical membranes of thick ascending limb and cortical collecting duct in Romk knock-out mice; 2) Romk knock-out mice produced similar phenotypes to Bartter syndrome consisting of salt and water wasting due to reduced NKCC2 activity and expression (3, 5); 3) the salt and water wasting from the kidney is compensated by increased thiazide-sensitive NaCl transport expression and activity, distal tubule hypertrophy, elevated renin-Ang II, and aldosterone levels (6). 4) The reduced K+ secretion in Romk null mice is compensated by increased maxi-K channel activity in the collecting tubule (7).
However, three ROMK isoforms (ROMK1, -2, and -3) have been identified in the rat kidney (8–10), but unique functions of any of the ROMK isoforms in nephron segments are still poorly understood. ROMK1 is expressed in the distal and collecting tubules and uniquely regulated by PTK/PTP-dependent endocytosis, which may be the mechanism for high-K-mediated enhanced ROMK channel activity in the collecting tubule (11, 12). To study the functional role of ROMK1 in the regulation of Na and K homeostasis, we have generated a mouse deficient only in Romk1 by selective deletion of the Romk1 exon, using an ES cell Cre-LoxP strategy. We have examined the phenotypes of these mice by metabolic and renal clearance, and examined K channel activities by the patch clamp. The ion transporters, Nkcc2, Ncc, and Romk2, expression were measured by Q-PCR and ROMK localization was examined by immunofluorescence staining under the conditions of normal and high K intake. Our experimental data show no difference in plasma Na+, K+, and acid-base parameters between littermate Romk1+/+ and Romk1−/− mice. Unlike Romk null mice Romk1−/− mice that exhibited no increase increases in urine volume, Na+ and K+ excretion, or water and food intake. Renal clearance data show no difference in urine output and GFR, but the fractional Na+ excretion was reduced in Romk1−/− compared with the Romk1+/+ control. The Nkcc2 and Romk2 expressions were unchanged, and the Ncc expression was slightly reduced in the Romk1−/− mice kidney. Patch clamp of single channel recording shows that the small conductance K channel (SK) activities are the same in the collecting tubule of channel property or gating between Romk1+/+ and Romk1−/− mice. High K intake produced significant hyperkalemia in Romk1−/− mice with impaired un-regulated SK channel activity and the ROMK channel trafficking to the apical membrane of the collecting tubule. Our results are consistent with previous studies that ROMK1 does not localize in the TAL, and that ROMK1 is a key target of PTK-mediated ROMK trafficking in response to K+ intake.
Experimental Procedures
Preparation of Targeting Construct
A phage library prepared using genomic DNA from a 129/SvJ mouse was screened with a Romk cDNA probe. The Romk1 knock-out construct was made from the mouse genomic DNA fragments containing Romk exons and pEasy Flox vector with multicloning sites on either side of the Neo gene and strategically placed LoxP sites for removing the Neo gene with Cre recombinase. The plasmid pEasy Flox was generated and kindly provided by Marat Alimzhanov, Institute for Genetics, University of Cologne, Cologne, Germany, which contains the selection marker genes HSV-tk and PGK neo and three loxP sites for removing the Neo gene with Cre recombinase. Specifically, an XmnI-Tth111I fragment containing the upstream Romk1 exon was subcloned into a HindIII site, upstream of the HSV-tk, and an MscI-XmnI fragment containing the Romk2 exon into BamHI-SfiI site, upstream of the loxP-flanked neo gene of pEasy-Flox. A Tth111I-MscI fragment containing the Romk1 exon was cloned into the SalI-XbaI site between two loxP sites of pEasy Flox. Cre recombination deleted ROMK 1 exon while leaving the promoters and exons of Romk2 and Romk3 intact. External probe P1, complementary to the partial BamHI-XmnI element, upstream of the XmnI-Tth111I fragment was used for hybridization of BamHI-digested genomic DNA to identify homologous recombinants by Southern blot.
Generation of Knock-out Mice
All experiments from animal work were conducted according to an Institutional Animal Care and Use Committee-approved protocol at Yale School of Medicine. The targeting construct was linearized by NotI cleavage and subsequently electroporated into 129/SvJ ES cells. Transfected ES cells were selected in the presence of G418 and ganciclovir. Drug-resistant ES cell clones were screened for homologous recombination by Southern blot. To obtain chimeric mice, correctly targeted ES clones were injected into BALB/c blastocysts, which were then implanted in CD1 pseudopregnant foster mothers. Male chimeras were bred with C57BL/6 to screen for germ-line-transmitted offspring. Germ-line-transmitted mice were bred with Actin-Cre (whole body) transgenic mice (deletor mice) to remove the Romk1 exon fragment and neomycin gene.
DNA Extraction and Genotyping
Genotypes were determined by PCR and Southern blot analysis by using tail DNA. PCR primers were: RC12-F (5′-TTGCTAACACAGTAATGGAGAACC-3′) and T7-9 (5′-TTCCGCTCTGATCTCAAGTGCCTA-3′) for WT (400 bp); NEO1280 (5′-GGCGAATGGGCTGACCGCTTCCTCGT-3′) and R463 (5′-GCTGATCTCGTTCTTCAGGCTATG-3′) for pKG neo (480 bp), Cre3 (5′-GGTTCGCAAGAACCTGATGG-3′) and cre4 (5′-GCCTTCTCTACACCTGCGG-3′) for the Cre transgene (700 bp), and T7-18 (5′-GGCATGACTTAGGAGAACAGG-3′) and T7-9 (5′-TTCCGCTCTGATCTCAAGTGCCTA-3′) for the Romk1 exon fragment and neomycin gene deletion (900 bp). The primers used were synthesized by the Yale Keck facility. External probe P1 was used for the confirmation of genotyping by Southern blot.
Metabolic and Renal Clearance Measurements
Both metabolic and renal clearance experiments were performed on adult Romk1+/+ and Romk1−/− mice, weighing 30–40 g, as described previously (3). Briefly, for metabolic study, Romk1+/+ and Romk1−/− mice were single housed in a metabolic cage. After 2 days of training in the cage, 24 h food and water intake, urine output and feces were measured, recorded, and compared between the littermate Romk1+/+ and Romk1−/− mice. Urinary Na+ and K+ concentrations were measured by flame photometry (type 480 Flame Photometer, Corning Medical and Scientific, Corning, NY), and total Na+ and K+ excretion (ENa, EK) was calculated as μEq/24 h.
Renal clearance experiments were performed on anesthetized animals to measure glomerular filtration rate (GFR) urine volume absolute (ENa, EK) and fractional excretion rates of Na+ and K+ (FENa, FEK). A thiobutabarbital sodium (Inactin, Sigma) intraperitoneal injection (100 to 150 mg/kg body weight) was given as anesthetic. The animals were then surgically prepared for tracheotomy and the cannulation of the carotid artery and jugular vein with polyethylene tubing (PE 10). The arterial catheter was then connected to a pressure transducer to monitor blood pressure and take blood samples, the venous catheter was connected to a syringe pump for saline infusion. After replacing surgical fluid loss with isotonic saline, the mice were given a priming dose of 10 μCi of [methoxy-3H]inulin, followed by a maintenance infusion in isotonic saline containing 10 μCi/h at a rate of 0.4 ml/h. The bladder was cannulated with a PE 50 tube for timed urine collections. Urine collections were made over 30-min collection periods and 2 collections of urine and blood were made from each mouse. Blood pressure, urine volume, and plasma and urinary Na+ and K+ concentrations were measured and the GFR, ENa, EK, FENa, and FEK were calculated by standard methods (13).
Single Channel Recording from Isolated Collecting Tubule
Tubule Preparation
The left kidney was removed following anesthesia/euthanasia by intraperitoneal injection of pentobarbital sodium (0.1 mg/g body weight) and cut into slices. Cortical TAL tubules were dissected in chilled bath solution, immobilized on a 5 × 5-mm coverglass coated with Cell-Tak (Biopolymers, Farmington, CT) and transferred to a patch chamber mounted on the stage of an inverted microscope (Olympus IMT-2). The tubule lumen was opened by a sharpened micropipette to expose the apical surface of the cells for patch clamping. All experiments were carried out at room temperature (22–24C°).
Patch Clamping
In general, patch clamping was performed as described previously (3, 14). Briefly, glass pipettes were pulled from borosilicate glass capillaries (Dagan, Minneapolis, MN) using a two-step Narishige PP83 puller (Narishige, Tokyo, Japan) and polished to give a pipette resistance from 6–8 MΩ when filled with 140 mm KCl solution. Single-channel currents were amplified by an EPC-7 amplifier (List Electronics, Darmstadt, Germany) and low-pass filtered at 1 kHz by an 8-pole Bessel filter (902LPF, Frequency Devices, Haverhill, MA). Signals were digitized at a sampling rate 4 kHz (DigiData 1200, Axon Instruments, Foster City, CA) and stored for later analysis (Gateway2000, E-3100). Bath solution contained (in mm): 140 NaCl, 5 KCl, 1.8 MgCl, 1.8 CaCl2, 10 HEPES, and adjusted to pH 7.4 with NaOH. Pipette solution contained (in mm): 140 KCl, 1.8 MgCl2, 10 HEPES, and pH adjusted to 7.4 with KOH.
Electrophysiology Data Analysis
Data were analyzed using pCLAMP software (version 6.0.4, Axon Instruments, Foster City, CA) at a digital filter frequency of 250 Hz. Channel expression was calculated as: (number of patches with active channels)/(total number of giga-seal patches with or without channel activity). Channel activity was also assessed as described previously (3, 14),
 |
where ti is the fractional open time spent at each of the observed current levels. Channel conductance was estimated from linear regression analysis of single channel current-voltage curves. Voltage applied to the pipette was referenced to the bath potential (−V).
Immunolocalization of ROMK
Anesthetized mice were fixed by perfusion with 2% paraformaldehyde in PBS via the abdominal aorta for 5 min at room temperature. The kidneys were then removed and fixed (24 h at 4 °C), rinsed in PBS, and embedded in paraffin. Cross-sections of 3-μm thick were cut and picked up on chrome-alum gelatin-coated glass coverslips and dried on a warming plate. The sections were then deparaffinized in two xylene baths and two absolute ethanol baths, 5 min each, and dehydrated in a graded ethanol series to distilled water. Then sections were stained with antibodies of ROMK (chicken polyclonal ROMK-specific antibody LC35, 1:500; a generous gift of Dr. James B. Wade, University of Maryland) and H-ATPase (rabbit anti-H-ATPase antibody). Antigen retrieval was applied during the staining process. After the staining was completed, anti-ROMK was detected with Alexa Fluor 594-conjugated donkey anti-chicken IgG (Sigma) and the H-ATPase staining was detected with 488 Alexa Fluor goat anti-rabbit IgG (Sigma).
Real-time RT-PCR
The kidneys from Romk1+/+ and Romk1−/− mice were harvested, transversely sliced to 4–5 pieces, and stored in RNA; later for overnight at 4 °C and then transferred to new tubes without reagent and stored at −80 °C for later use. A total of 1 mg of RNA from tissues was extracted by RNeasy kit (Qiagen) according to the manufacturer's instructions. Residual genomic DNA was removed by DNase I digestion, using a DNA free kit (Ambion, Austin, TX). cDNA synthesis from total RNA was carried out using the high capacity cDNA reverse transcription kit (Applied Biosystems, Foster City, CA) and mRNA expression was quantified by real-time RT-PCR using Power SYBR® Green PCR Master Mix (Applied Biosystems, Foster City, CA). The cycling conditions for all genes were: preincubation at 95 °C for 10 min, followed by 40 cycles at 94 °C for 15 s and 60 °C for 60 s. The final mRNA abundance of each gene was normalized to the abundance of an endogeneous gene, Cyclophilin A, using the DDCT method (2−DDCT). Fold-change in the gene expression was calculated (15). The primers used in this study were listed in Table 1.
TABLE 1.
Primers used in real-time PCR
| Gene namea | Primer sequence | Gene ID |
|---|---|---|
| Nkcc2 | Forward: 5′-CATTGGCCTGAGCGTAGTTGT-3′ | NM_001079690 |
| Reverse: 5′-GCCTATTGACCCACCGAACTC-3′ | ||
| Ncc | Forward: 5′-AGGCCCAGGTGCTATTCTTTCT-3′ | NM_019415 |
| Reverse: 5′-TGAACAAAAATGTCCCCATGGT-3′ | ||
| Romk2 | Forward: 5′-CACGTTTACCCCAGCAATCC-3′ | NM_019659 |
| Reverse: 5′-CCGAGAACGCCCAAATATGT-3′ | ||
| Cyclophilin A | Forward: 5′-TTGCAGACAAAGTTCCAAAGACA-3′ | NM_008907 |
| Reverse: 5′-AAGTCACCACCCTGGCACAT-3′ |
a The gene names are defined as: Nkcc2, solute carrier family 12 (sodium/potassium/chloride transporters), member 1; Ncc, solute carrier family 12 (sodium/chloride transporters), member 3; Romk2: potassium inwardly-rectifying channel, subfamily J, member 1, isoform 2.
Statistics
All the data are expressed as mean ± S.E. Statistical evaluation was performed using Student's t test. p < 0.05 was considered statistically significant.
Results
Generation of Romk1 Knock-out Mice by Cre-LoxP Recombination
Cloning and gene mining have identified ROMK splice variants in human, rat, and mouse that produce proteins differing in the beginning of the N terminus. ROMK2 has the shortest N terminus, whereas ROMK1 adds an additional 19 (rat) or 20 (mouse) residues. ROMK1 transcripts are expressed in the mid and late distal tubule and the cortical collecting duct (CCD) where ENaC is also expressed. In addition, ROMK1 transcripts are found in the outer medullary collecting duct (OMCD) where ROMK1 may provide K+ recycling for the renal H,K-ATPase. In the CCD, the ROMK2 transcript is also expressed, whereas in the OMCD the only transcript is ROMK1 (9). There are no studies assessing relative or absolute quantities of the ROMK isoform in any condition (e.g. high or low K+ diet) because no one has been able to produce isoform-specific antibodies. Thus, our understanding of the unique roles of the ROMK1 isoform in native kidney is limited.
The conditional knock-out vector, pEasy Flox (designed by Dr. Klaus Rajewsky from the CBR Institute for Biomedical Research, Harvard Medical School), has multicloning sites on either side of the PKG-neo transcription unit, which is flanked by LoxP sites. The Romk1 deletion targeting construct shown in Fig. 1 has been generated and inserted into the pEasy Flox vector. The left arm is a 2.3-kb genomic DNA fragment inserted between HindIII and XhoI sites of the vector. The Romk1 exon was ligated between the SalI and XbaI sites in the vector. The right arm is a 3.6-kb genomic DNA fragment ligated between the BamHI and NotI sites of the vector. ES cells were transfected with the Romk1 deletion targeting construct, and 200 cell clones were screened for correct targeting using PCR and Southern blotting. We incorporated unique restriction enzyme sites during generation of the targeting construct to give a distinct 7.3-kb band with BamHI digestion of the targeted gene versus 11.2 kb for the wild-type gene and obtained positive ES cell clones. By using two of these positive ES cell clones injected into mouse blastocytes we obtained Romk1flox/flox mouse colonies. The Romk1flox/flox mouse was then crossed with the actin-Cre mouse (obtained from Yale Transgenic Mouse Facility) to produce the Romk1 conditional knock-out mouse. Fig. 2 shows Southern blot and PCR results from the Romk1flox/flox mouse before mating with the Cre mouse (A and B), Southern blot after mating with the Cre mouse (C), and PCR genotyping results from littermate Romk1+/+ and Romk1−/− mice.
FIGURE 1.

The targeting strategy of Romk1 knock-out. L-Arm, left arm; R1, Romk1 exon; R-Arm, right arm; TK, thymidine kinase gene; neo and PGK neo, neomycin resistance gene; R2, Romk2 core exon. GT, genotype. Left arm, a 2.3-kb genomic DNA fragment is inserted between HindIII and XhoI sites of the vector; Romk1 exon is placed between SalI and XbaI sites of the vector; right arm, a 3.6-kb genomic DNA fragment, is put into between BamHI and NotI sites of the vector.
FIGURE 2.

Southern blot analysis of tail DNA from mice. A and B, Southern blot and PCR from the samples before mating with Cre mice. A, 11.2 kb is a wild-type gene and 7.8 kb is the gene with insertions (see Fig. 1). B, RC12-F/T7-9 and NEO1280/R463 are PCR products from the WT and gene with insertions, respectively. C and D, Southern blot and PCR from the samples after mating with Cre mice. C, 11.2 kb is the wild-type gene and 4.9 kb is the knock-out gene (see Fig. 1). D, RC12-F/T7-9 and T7–18/T7-9 are the PCR products from the WT and KO mice, respectively (see Fig. 1). The samples were digested with BamHI and hybridized with the external probe (right side). N, Neo+loxp allele.
Romk1 Knock-out Mice Do Not Produce Bartter Phenotype
Romk Bartter mice exhibit lower survival rates, surviving mice show lower body weight, higher urine volume, elevated water and food intake, and urinary Na+ and K+ excretion (3). In contrast, Romk1−/− mice had a similar fertility and survival rate, normal growth, and no difference in body weight compared with Romk1+/+ mice. As shown in Table 2, the body weights of age-matched animals were similar, 23.3 ± 1.45 g in Romk1+/+, and was 23.3 ± 0.87 g in Romk1−/− mice. Table 2 also shows the results from the metabolic studies with 24-h urine collection. The urine output, water and food intake, amount of stool, and 24-h urinary Na+ and K+ excretion (ENa, EK) are the same and have no significant difference in any of the parameters between the Romk1−/− and Romk1+/+ mice. Table 3 summarized the results of plasma Na+,K+ concentrations and acid-base parameters of blood (pH, PCO2, and HCO3−) from Romk1+/+ and Romk1−/− mice. Those parameters are all in the normal range and no differences between Romk1+/+ and Romk1−/−. Because the original ROMK KO mice exhibited hydronephrosis (16), we examined the size and kidney weight, morphology change, and also scored the liquid retention rate as we described previously (16). In that study, we classified the mice with liquid retention rate <10% as normal. Our new data show that the liquid retention rate was 9.2 ± 1.8% (n = 6) in Romk1−/− mice, indicating no hydronephrosis in these mice. In addition, there is no difference in kidney weight and no morphological defects found in Romk1−/− mice. The kidney size was 10.5 ± 0.16 and 10.6 ± 0.23 mm and the kidney weight was 188 ± 6.6 and 182 ± 8.4 mg in Romk1+/+ and Romk1−/− mice, respectively (n = 10, p > 0.05). We next compared the metabolic and renal functions between Romk−/− and Romk1−/− mice. As shown in Fig. 3, food and water intake were significantly higher in Romk−/− mice, but the Romk1−/− had no change compared with their WT control. In the total Romk group, food intake was 3.11 ± 0.19 and 1.95 ± 0.16 g/24 h, and water intake was 9.20 ± 0.39 and 3.04 ± 0.16 ml/24 h in Romk−/− and Romk+/+ mice (p < 0.05). In the ROMK1 group, food intake was 1.94 ± 0.45 and 1.52 ± 0.35 g/24 h and water intake was 3.25 ± 0.80 and 2.8 ± 0.45 ml/24 h in Romk1−/− and Romk1+/+ mice, respectively (n = 15, p > 0.05). To measure GFR and fractional Na+ and K+ excretion, we conducted renal clearance experiments in these mice. Experimental results shown in Fig. 4 illustrate the GFR and urine volume, and Fig. 5 shows the fractional Na (FENa) and K (FEK) excretion. In the Romk KO mice, the urine volume increased by 3-fold and GFR was reduced by 40% (n = 17, p < 0.01). In contrast, there was no difference in urine volume and GFR between Romk1−/− and Romk1+/+ mice. Both FENa and FEK were elevated in Romk KO mice. FENa was 0.34 and 0.69%, and FEK was 18.3 and 44%, in Romk+/+ and Romk−/− mice, respectively (p < 0.001), consistent with the Bartter phenotype of salt and water wasting. In contrast, the FENa was 0.45 ± 0.11 and 0.32 ± 0.05% and the FEK was 20.4 ± 6.32 and 26.9 ± 9.12% (n = 9; p > 0.05) in Romk1−/− and Romk1+/+ mice, respectively, showing no Bartter phenotype in these mice.
TABLE 2.
Metabolic study on Romk1+/+ and Romk1−/− mice with a normal diet
Animals were housed in a metabolic cage and 24 h urine and stool samples were collected and food and water intake were measured.
| Romk1+/+ (n = 15) | Romk1−/− (n = 15) | Significance | |
|---|---|---|---|
| Body weight (g) | 23.3 ± 1.45 | 23.3 ± 0.87 | NSa |
| Food intake (g/24 h) | 1.52 ± 0.35 | 1.94 ± 0.45 | NS |
| Water intake (g/24 h) | 2.8 ± 0.45 | 3.25 ± 0.80 | NS |
| Urine (ml/24 h) | 1.04 ± 0.20 | 0.85 ± 0.14 | NS |
| Stool (g/24 h) | 0.64 ± 0.17 | 0.81 ± 0.17 | NS |
| ENa (μEq/24 h) | 84.16 ± 14.14 | 89.08 ± 11.13 | NS |
| EK (μEq/24 h) | 214.46 ± 40.75 | 220.76 ± 33.58 | NS |
a NS, no significant difference between Romk+/+ and Romk−/− mice.
TABLE 3.
Plasma electrolytes and acid-base parameters in Romk1+/+ and Romk1−/− mice with a normal diet
Blood was collected by retro-orbital bleeding and samples were measured immediately by an iSTAT-meter (n: number of animals).
| Romk1+/+ (n = 10) | Romk1−/− (n = 13) | Significance | |
|---|---|---|---|
| pH | 7.25 ± 0.01 | 7.26 ± 0.01 | NSa |
| HCO3 (mm) | 24.97 ± 0.39 | 24.06 ± 0.6 | NS |
| Na+ (mm) | 144.5 ± 0.72 | 143.3 ± 0.6 | NS |
| K+ (mm) | 4.6 ± 0.15 | 4.79 ± 0.17 | NS |
| Ca2+ (mm) | 1.22 ± 0.01 | 1.19 ± 0.01 | NS |
| Glucose (mg/dl) | 201.5 ± 13.7 | 201.8 ± 9.2 | NS |
| HCT (%) | 41.6 ± 1.80 | 42.7 ± 1.31 | NS |
| Hb (g/dl) | 14.13 ± 0.61 | 14.52 ± 0.4 | NS |
a NS, no significant difference between Romk+/+ and Romk−/− mice.
FIGURE 3.
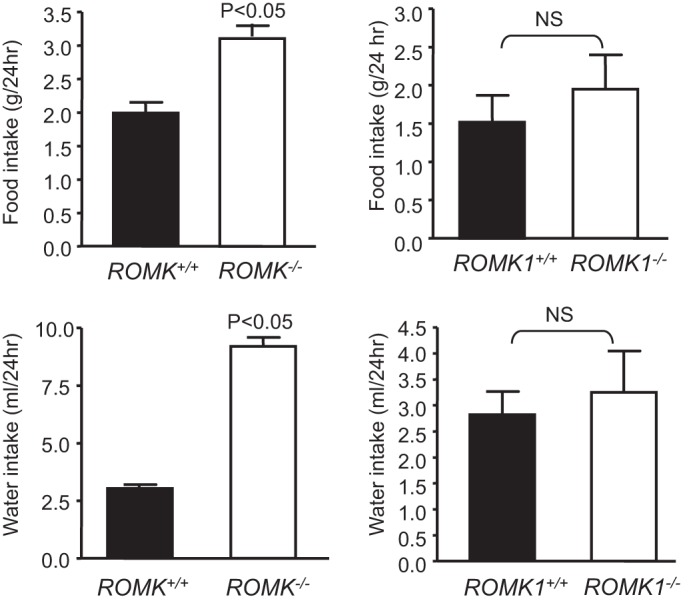
Comparison of food and water intake in the total Romk and Romk1 knock-out with their wild-type control. Food and water intake were measured by metabolic cage and animals were housed singly. n = 9 in Romk and n = 13 in Romk1 groups. Both food and water intake were elevated by 3-fold in Romk KO compared with their control, but there was no difference between Romk1 KO and WT mice.
FIGURE 4.
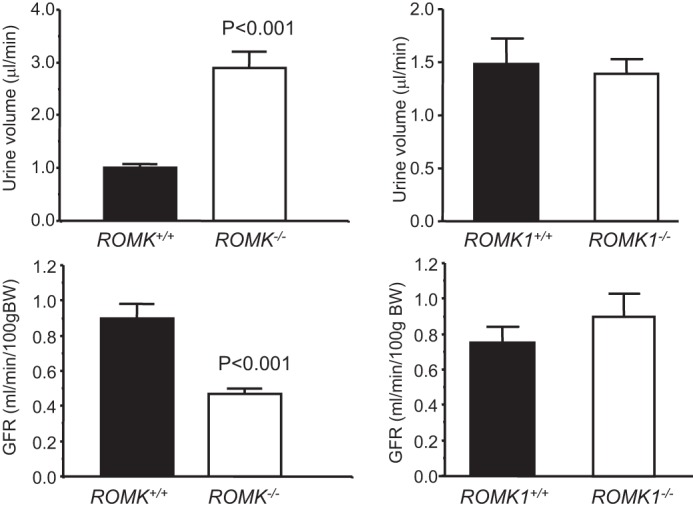
Comparison of urine output and GFR between Romk and Romk1 knock-out mice with their wild-type control. GFR and urine volume were measured by inulin clearance in anesthetized mice. n = 9 in Romk mice and n = 13 in Romk1 mice. Urine volume was higher in total Romk KO mice but it was no difference in Romk1 KO mice compared with their WT control. These results are consistent with the metabolic cage measurements. The GFR was lower in Romk KO mice and there was no difference in Romk1 KO mice, compared with their WT control.
FIGURE 5.
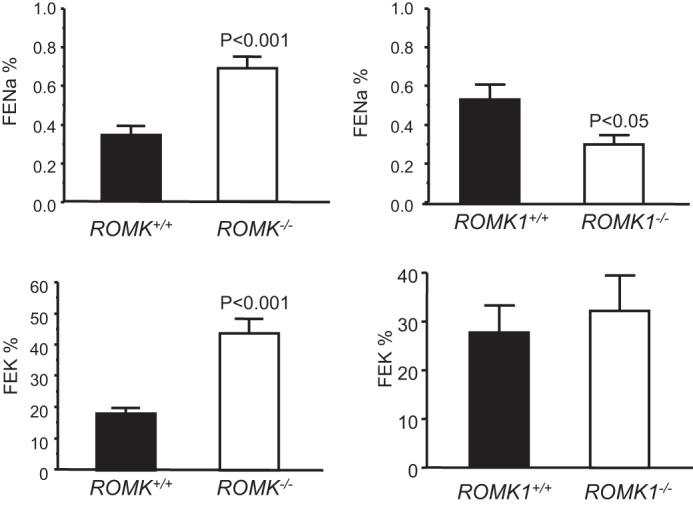
Comparison of fractional Na (FENa) and K (FEK) excretion between the Romk and Romk1 knock-out mice. FENa and FEK were measured by inulin clearance in anesthetized mice. Both FENa and FEK were higher in total Romk KO mice, but there was no difference in Romk1 KO mice compared with their WT control.
ROMK1 Knock-out Mice Do Not Reduce NKCC2 Activity
Because the phenotype of salt and water wasting is due to reduction of NKCC2-mediated NaCl absorption in Romk−/− mice (1, 5), we investigated whether NKCC2 activity is also altered in Romk1−/− mice. We examined the effect of furosemide (a NKCC2 inhibitor) on Na+ and K+ excretion by renal clearance to assess the NKCC2 activity in Romk1+/+ and Romk1−/− mice. The urine volume of GFR, ENa, and EK, as well as FENa and FEK before and after administration of furosemide (30 mg/kg intravenously) was measured. As previously reported, furosemide induced a significant diuretic and natriuretic effect with mild reductions of GFR in the control mice (5). The new observation is that furosemide also produced a significant diuretic and natriuretic effect in Romk1−/− mice. We calculated the increment of Na and K excretion and compared these volumes between Romk1+/+ and Romk1−/− mice. As shown in Fig. 6, the fold-changes of ENa, EK, FENa, and FEK by furosemide are similar and there is no significant difference between Romk1+/+ and Romk1−/− mice. The fold-increase by furosemide of the urine volume is slightly higher (13.02 ± 1.75 versus 7.98 ± 1.84; n = 9, p > 0.05) in Romk−/− than in Romk+/+. The increment of ENa was also slightly higher, 12.77 ± 2.22 versus 7.66 ± 2.37, but this difference was not statistically significant. These results show inhibition of NKCC2 by furosemide produced the same diuretic and natriuretic effects in Romk1+/+ and Romk1−/− mice that indicated no reductions of NKCC2 activity in the Romk1−/− mice.
FIGURE 6.
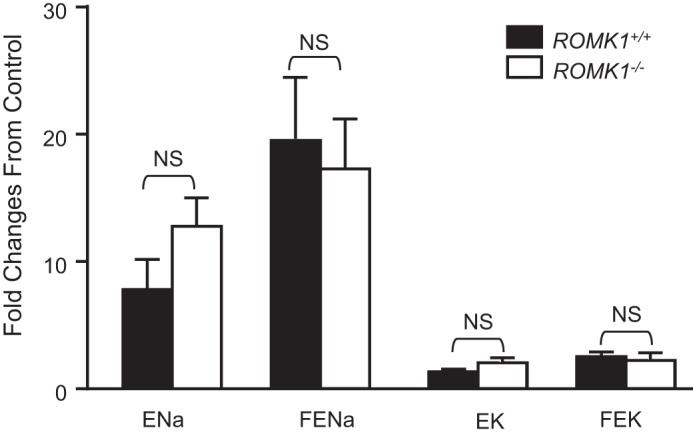
Comparison of furosemide-induced natriuretic effect and K excretion. The fold-changes of fractional Na and K excretion were compared with the mean of two urine collections before administration of the NKCC2 inhibitor Furosemide (30 mg/kg intravenous bolus injection). Furosemide significantly increased urine output (UV) and Na excretion in both Romk1 WT and KO mice. There was no reduction of the fold-changes in furosemide increased Na excretion.
High K Intake Causes Hyperkalemia and Impaired ROMK Trafficking
To investigate the role of ROMK1 in the regulation of K+ balance, we performed metabolic studies and examined plasma electrolyte levels after animals were treated with a 10% high K+ diet for 14 days. Table 4 summarizes the results from metabolic studies and Table 5 shows plasma electrolytes and acid-base parameters measured after animals were treated with a high K diet. Fig. 7 is the comparison of plasma K levels between groups. Under normal K+ conditions, plasma K+ was slightly higher in Romk1−/− mice compared with the Romk1+/+ (4.8 versus 4.6 mm n = 13), but the difference was not significant. Under high K+ conditions, Romk1−/− mice show significantly higher plasma K+ (5.52 versus 4.45 mm, n = 19, p < 0.0001) compared with their littermate Romk1+/+. Other parameters examined using the metabolic cage, such as body weight, urine volume, and food and water intake, indicated no significant different between Romk1+/+ and Romk1−/− mice. These results indicate a defect in high K+-stimulated K+ secretion in Romk1−/− mice.
TABLE 4.
Metabolic study on Romk1+/+ and Romk1−/− mice with 10% high K diet
After animals treated with 10% high K diet they were housed in a metabolic cage and 24 h urine and stool samples were collected and food and water intake were measured.
| Romk1+/+ (n = 10) | Romk1−/− (n = 9) | Significance | |
|---|---|---|---|
| Body weight (g) | 22.8 ± 0.75 | 23.9 ± 0.84 | NSa |
| Food intake (g/24 h) | 3.32 ± 0.44 | 3.62 ± 0.22 | NS |
| Water intake (g/24 h) | 13.49 ± 1.41 | 13.42 ± 0.63 | NS |
| Urine (ml/24 h) | 9.58 ± 1.15 | 9.47 ± 0.57 | NS |
| Stool (g/24 h) | 0.74 ± 0.13 | 1.01 ± 0.10 | NS |
| ENa (μEq/24 h) | 403.8 ± 14.98 | 376.33 ± 5.18 | NS |
| EK (μEq/24 h) | 3620.1 ± 119.9 | 3408.8 ± 96.9 | NS |
a NS, no significant difference between Romk1+/+ and Romk1−/− mice.
TABLE 5.
Plasma electrolytes and acid-base parameters in Romk1+/+ and Romk1−/− mice with 10% KCl diet
Blood was collected by retro-orbital bleeding and samples were measured immediately by an iSTAT-meter (n: number of animals).
| Romk1+/+ (n = 17) | Romk1−/− (n = 19) | Significance | |
|---|---|---|---|
| pH | 7.26 ± 0.01 | 7.21 ± 0.02 | p < 0.05 |
| HCO3− (mm) | 24.12 ± 0.72 | 23.03 ± 0.47 | NSa |
| Na+ (mm) | 147.12 ± 0.61 | 147.63 ± 0.47 | NS |
| K+ (mm) | 4.45 ± 0.14 | 5.52 ± 0.19 | p < 0.0001 |
| Ca2+ (mm) | 1.23 ± 0.02 | 1.23 ± 0.02 | NS |
| Glucose (mg/dl) | 124.29 ± 8.61 | 122 ± 5.95 | NS |
| HCT (%) | 42.29 ± 0.82 | 41.05 ± 0.41 | NS |
| Hb (g/dl) | 14.38 ± 0.28 | 13.96 ± 0.14 | NS |
a NS, no significant difference between Romk1+/+ and Romk1−/− mice.
FIGURE 7.
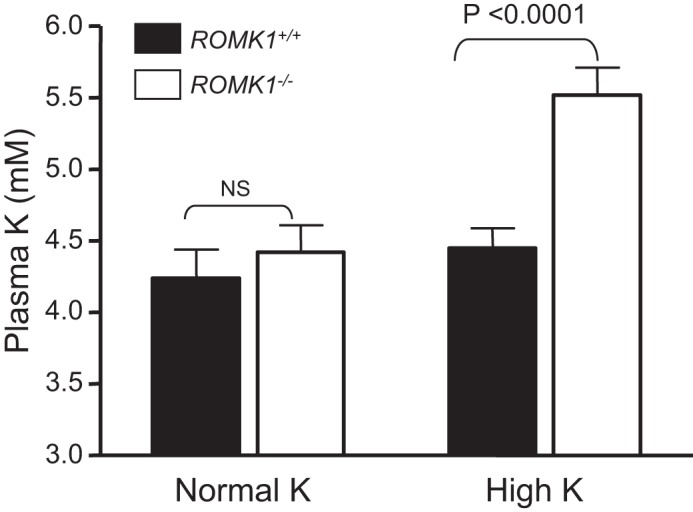
Plasma K concentrations in Romk1+/+ and Romk1−/− mice under the conditions of normal diet and high K (10% K) treatment for 14 days before measurement. The K concentrations were measured by flame spectrometer. Romk1−/− mice exhibited hyperkalemia after they were treated with a high K diet, but not in the WT control.
The ROMK channel distribution under a high K+ condition was examined by immunofluorescence (IF). The high K+ intake-induced ROMK channel distribution in TAL and CCD was compared between Romk1+/+ and Romk1−/− mice. Because no ROMK isoform-specific antibody is available, IF staining of ROMK was used to examine the channel distribution in the kidney. Fig. 8 shows ROMK staining clearly in the apical membrane of medullary thick ascending limb (mTAL) and no difference between Romk1+/+ and Romk1−/− KO mice, consistent with Romk1 not being expressed in the TAL. Similar results were also seen in the TAL (Fig. 9). Shown in Fig. 9, ROMK intensity was distributed in the apical membrane of the CCD in WT mice, suggesting the high K+ intake shifted ROMK to the apical membrane and increased its activity to secrete more K+ and maintain the K+ balance. In contrast, ROMK staining showed less condensation to the luminal membrane of the collecting duct in the Romk1−/− compared with the WT mice (Figs. 9 and 10). In combination with other experimental results, high K+ intake induces hyperkalemia (Fig. 7), and high K intake does not normally increase the channel density in Romk1−/− mice (Table 6). This result suggests an important role of ROMK1 in mediating ROMK2 distribution to the apical membranes in response to a high K+ diet.
FIGURE 8.
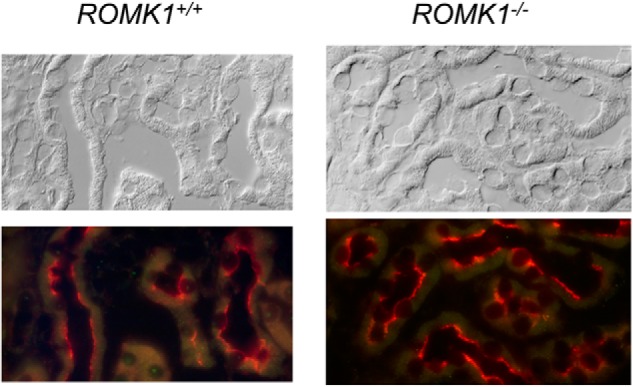
ROMK localization in MTAL of Romk1+/+ and Romk1−/− mice kidney. ROMK staining is in red, clearly distributed in the apical membrane of the TAL and shows no difference of IF staining intensity between WT and KO mice kidneys, consistent with the finding that ROMK1 is not expressed in the TAL (9).
FIGURE 9.
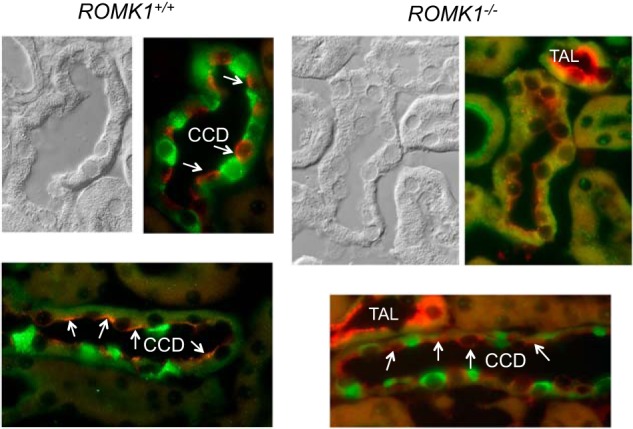
ROMK localization in the kidney of Romk1+/+ and Romk1−/− mice after treatment with a high K diet. ROMK staining is red and H-ATPase is green. ROMK is clearly stained in the apical membrane of the principal cells (negatively stained with H-ATPase, a maker of the intercalated cells) and the TAL of Romk1−/− mice. ROMK staining was condensed (arrows) at the apical membrane of the CCD in WT control, but was more diffused (arrows) in the CCD in Romk1−/− mice compared with Romk1+/+ mice. This is consistent with the high K intake and cannot normally increase ROMK channel density in Romk1−/− mice (see Table 6) and causes hyperkalemia.
FIGURE 10.
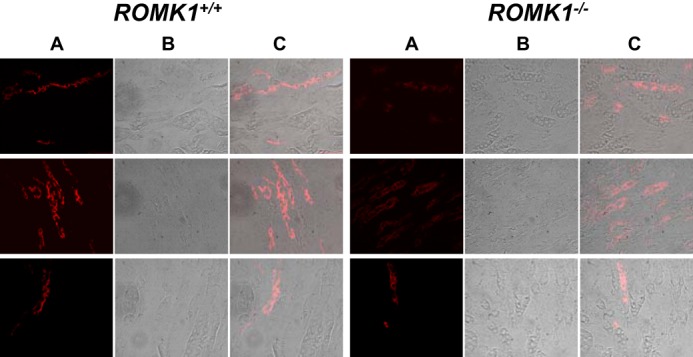
ROMK localization in the kidney of Romk1+/+ and Romk1−/− mice after treatment with a high K diet. A, ROMK antibody staining (red); B, image taken with transmitted light shows tubule structure; C, merged image shows both IF staining and tubule structures. ROMK staining is more condensed in the luminal membrane of the kidney tubule in Romk1+/+ (left) than Romk1−/− (right) mice.
TABLE 6.
Patches showing ROMK activity in the apical membrane of CCD under normal or high potassium diet in Romk1+/+ and Romk1−/− mice
SK channel activity was examined by patch clump in the split opened collecting tubules isolated from Romk1+/+ and Romk1−/− mice.
| CCD |
Romk1+/+ |
Romk1−/− |
||
|---|---|---|---|---|
| Normal K | High K | Normal K | High K | |
| Mouse number | 3 | 17 | 6 | 15 |
| Total number of patches | 12 | 73 | 24 | 72 |
| No. of patches with channels | 5 | 52 | 14 | 35 |
| % of patches with channel | 42% | 71% | 58% | 49% |
| Channel number/patch | 1.4 ± 0.24 | 2.9 ± 0.19a | 1.7 ± 0.13 | 1.8 ± 0.13 |
a Significant from normal K+ diet p < 0.05.
Impaired Up-regulation of SK Channel Activity by High K Intake
We have previously demonstrated the absence of SK activity in apical membranes of thick ascending limb and CCD in Romk knock-out mice (3, 4). We now investigated whether the ROMK channel property was altered in Romk1 knock-out mice. Because ROMK1 is not expressed in the TAL, we examined ROMK channel activity in the CCD in Romk1 knock-out mice. The SK channel activity was measured by patch clamping with single channel recording in the split opened collecting tubule, and animals were treated with normal K diet. Fig. 11 shows the SK channel activity at different pipette holding voltages with 140 mm KCl in the pipette and 140 mm NaCl + 5 mm KCl in bath recorded using different holding potentials (−V) in a cell-attached patch and the I-V curve. The channel open probability (Po) is 0.88 ± 0.09 with one open time (To) and one closed time (Tc), 25 ± 0.28 and 1.81 ± 0.23, respectively. Channel slop conductance (G) is 32.27 ± 0.57 pS (−V between −40 to −80 mV). The volume of Po, To, Tc, and Tc was 0.88 ± 0.17, 24.49 ± 0.29, 1.84 ± 0.17, and 31.13 ± 0.58, respectively, in the CCD of Romk WT mice (4). The data show no difference in 35 pS K+ channel activity in the CCD between Romk1+/+ and Romk1−/− mice while on a normal K+ diet.
FIGURE 11.
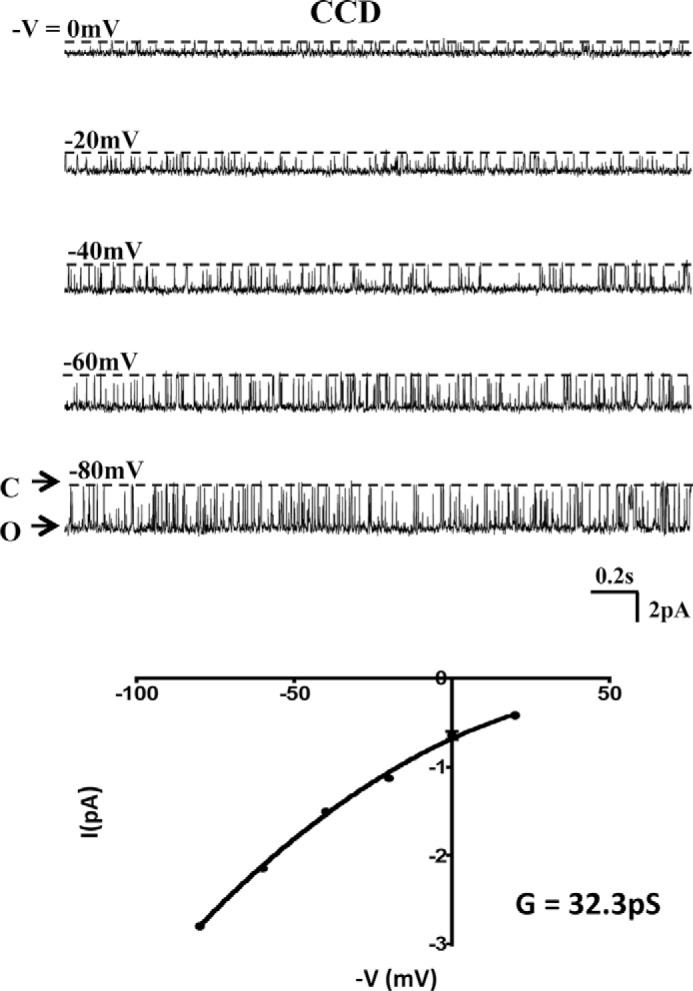
SK channel activity in the CCD apical membrane of Romk1−/− mice with normal K diet. A, representative SK single channel recordings are shown in different pipette holding potentials (−V) in cell-attached patch. C and O indicate channel open and closed states. B, SK channel I-V curve. Channel slop conductance (G) is 32.27 ± 0.57 pS. There is no difference with WT mice (see Ref. 3). Although there were no differences in channel properties between Romk1−/− and WT CCD apical membranes, channel density increased significantly in Romk1+/+ mice, but not in Romk1−/− mice, in response to a high K diet (see Table 6).
We next measured SK channel activity in the CCD of animals treated with normal and 10% high K diet. These data are summarized in Table 6. In WT mice, high K intake significantly increased the channel number per patch and the % of patches with channel. As shown in Table 6, the channel number per patch increased from 1.4 to 2.9 (p < 0.05) and the % of patches with channel increased from 42 to 71% (p < 0.05) in Romk1+/+ mice when treated with high K diet. In contrast, the channel number per patch was 1.7 and 1.8 and the % of patches with channel was 58 and 49% in Romk1−/− mice, when animals were treated with normal and high K diet, respectively. These results show that the high K intake was not able to up-regulate the SK activity in the CCD. Because K+ excretion is depending upon the K+ channel activity, the impaired up-regulation of channel activity by high K+ causes hyperkalemia in Romk1−/− mice.
Ion Transporters Expression
The salt and water wasting in Romk Bartter syndrome is induced by the lost function of the Na-K-2Cl-cotransporter (NKCC2) due to impaired ROMK channel activity. The major compensatory mechanism of increased salt absorption is by up-regulation of the Na/Cl-cotransporter (NCC) (17). We have also reported that the expression level of NKCC2 was reduced and the NCC increased significantly in the total Romk−/− mice kidney (6). Therefore we examined Nkcc2 and Ncc expression in Romk1−/− mice kidneys. The expression level of Romk2 in Romk1−/− mice was also measured and compared with Romk1+/+ mice. The expression levels of the Nkcc2, Ncc, and Romk2 were measured by real-time RT-PCR in whole kidney tissues. As shown in Fig. 12, there is no reduction of Nkcc2 mRNA expression, but it was 10% higher (1.90 ± 0.18 versus 1.72 ± 0.18; p > 0.05) compared with the WT. In addition, there is no increase in the NCC expression, but the Ncc expression level was 40% lower (0.69 ± 0.09 versus 1.16 ± 0.13) in Romk1−/− mice compared with the Romk1+/+ control. The Romk2 expression level was the same (1.03 ± 0.05 versus 1.02 ± 0.05; p > 0.05) in Romk1−/− and the Romk1+/+ control. These results are consistent with the previous finding that ROMK1 is not expressed in the TAL (9) and does not alter NKCC2 function as measured by renal clearance (Fig. 6).
FIGURE 12.
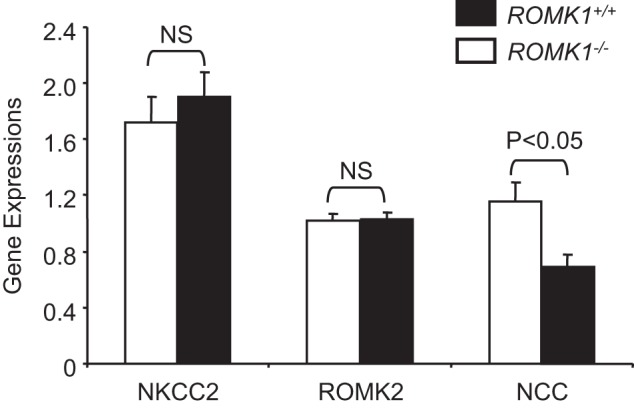
Gene expression in Romk1+/+ and Romk1−/− mice. The levels of Nkcc2, Romk2, and Ncc were measured in the kidneys of Romk1+/+ and Romk1−/− mice by Q-PCR. *, p < 0.05 compared with wild-type mice.
Discussion
ROMK forms both 70 and 30 pS apical K channels in the TAL and CCD, which play an important role in K+ recycling, supporting sodium and chloride absorption in the TAL, and regulation of K+ secretion in the CD. Three major ROMK isoforms were identified in the kidney: ROMK (1–3), with different lengths of the NH2 terminus (8, 18, 19). ROMK2 has the shortest N terminus, whereas ROMK1 adds an additional 19 (rat) or 20 (mouse) residues. In addition to the difference in NH2 terminus, they are also differentially expressed along the nephron from the TAL to the OMCD. In the rat, ROMK1 is expressed in the CCD and OMCD, whereas ROMK2 is expressed along the distal nephron including mTAL, CTAL, DCT, and CCD; ROMK3 is expressed in mTAL, cTAL, and DCT (9). The OMCD cells appear to express only the ROMK1 transcript (9). The general single channel properties (measured from the oocyte expression with single channel recording) of ROMK1, -2, and -3 isoforms are similar (20, 21). However, the specific functional and regulation consequences of the different ROMK isoforms have not been fully elucidated in vivo. Studies of the functional role of each ROMK isoform in vivo are largely limited due to their structural similarity, and no one has been able to produce isoform-specific antibodies. The successfully generated Romk1 knock-out mice enable us to use this tool to explore the functional role of ROMK1 in regulation of kidney electrolyte transport and the difference with the total Romk knock-out mice.
First we focused on the study of major renal phenotypes in vivo and examined whether Bartter phenotypes exist in ROMK1 KO mice. Second, we examined the regulation of ROMK channel activity and localization by high K intake. Our experimental results from both metabolic cage and renal clearance studies showed no Bartter phenotype of salt and water wasting induced by higher urine output and Na and K excretion, have demonstrated that electrolytes and acid-base parameters are normal, and there is no difference with the Romk1 WT mice. This is not surprising, because ROMK1 is not expressed in the TAL and the major cause of Bartter syndrome is due to loss of function of the NKCC2 in the TAL (1). The absence of Bartter phenotype also confirmed the previous ROMK isoforms localization studies, which showed that ROMK1 is not expressed in the TAL (9). Renal clearance experiments showed no reduction of furosemide-induced diuretic and natriuretic effect in Romk1−/− mice, which is different from the significant reductions of NKCC2 expression and function in all ROMK isoforms knock-out mice (5). The Q-PCR result shows no reduction of Nkcc2 expression and no increase in Ncc expression in Romk1−/− mice (Fig. 12). These results indicate the functional role of ROMK1 in salt and water homeostasis differs with ROMK2 and -3, and there is no role of ROMK1 in the modulation of NKCC2 activity. Our experimental results show, however, a significant hyperkalemia, which appeared in Romk1 KO mice after they were treated with high K diet (Fig. 7 and Table 5). In contrast, the WT control mice had only a mild increase of plasma K that did not reach the level of hyperkalemia. It has been demonstrated that ROMK1 is exclusively expressed in the connecting tubule and CCD (9), suggesting it plays an important role in K balance. The stimulation of tyrosine phosphorylation of ROMK1 facilitates channel internalization, and high K intake inhibits tyrosine phosphorylation and increases surface expression and the channel activity of ROMK (12, 22, 23). This is evidence that this is the major regulatory mechanism of K balance during high K intake or K restriction. However, because SK channel properties from all three ROMK isoforms formed channels, which are similar, there is no way to distinguish which isoform is functional and whether they interact with each other. Our results show impaired high K-stimulated ROMK channel activity and more surface localization of Romk2 in Romk1−/− mice, suggesting Romk1 is the K-regulated isoform. Although ROMK2 is also localized in the connecting tubule and CCD, it is not regulated by K, and without Romk1, Romk2 cannot overcome the problem of K imbalance.
The CNT and cortical collecting ducts respond promptly to changes in dietary K+ intake: an increase in K+ intake stimulates, whereas a decrease in K+ intake reduces K+ secretion (23–25). These changes in K+ secretion (and excretion) are paralleled by changes in 30 pS K+ channel activity in apical membranes of principal cells outlined in a previous report and our current study (23, 26). A series of approaches, including patch clamp experiments, confocal microscopy, and biochemical studies (23, 26, 27) have demonstrated that stimulation of PTK (by a low K+ diet) enhances endocytosis of 30 pS K+ channels in principal cells. In contrast, inhibition of PTK (high K+ diet) has the opposite effect, leading to increased channel activity (28, 29). Endocytosis of romk channels is a dynamin-dependent process using clathrin-coated pits (30). Although both ROMK1 and ROMK2 transcripts are expressed in the CNT and CCD (9), only the ROMK1 isoform, which is exclusively expressed in these nephron segments, is regulated by PTK (31, 32). PTK-stimulated endocytosis of ROMK1 in oocytes and HEK cells requires phosphorylation of the C-terminal consensus motif (Tyr-337 in ROMK1) (31). Because all ROMK isoforms (1–3) have a C-terminal PTK phosphorylation motif, the reason for the isoform specificity of regulation by PTK likely involves the unique ROMK1 NH2 terminus. Consistent with this view, the 30 pS K+ channel formed by ROMK2 and ROMK3 in TAL cells is not regulated by this kinase (33) and absence of high K stimulated 30 pS K+ channel activity in Romk1−/− mice (Table 6).
The unique structural difference between ROMK1 and ROMK2 is that ROMK1 extended N-terminal with specific binding sites of hormones and protein kinase. For example, the ROMK1 channel is sensitive to arachidonic acid (20, 21), but arachidonic acid has little to no effect on ROMK2 and ROMK3 (20). ROMK1 channel activity could also be regulated by monoubiquitination, and the ubiquitin binding site is on lysine 22 on the N terminus of ROMK1 (12). Lysine at position 80 on the N terminus of ROMK1 is primarily responsible for conferring pH sensitivity as a mutation of this residue abolished pH dependence (34). ROMK endocytosis regulated by PTK/PTP occurs only with the ROMK1 isoform in Xenopus laevis oocytes or ROMK1-transfected HEK cells (31). We have demonstrated that ROMK2 is expressed with normal channel properties in the absence of ROMK1, but ROMK2 channels do not undergo accelerated exocytosis during adaptation to a high K diet, which causes hyperkalemia. Our results are consistent with previous reports from in vitro studies, and we are the first to demonstrate the functional difference between ROMK1 and ROMK2 in regulation of Na and K homeostasis in vivo. No specific role for the extended N terminus of ROMK3 has yet been identified, and we were not able to detect any ROMK3 expression in the kidneys of either WT, as reported previously (35), or Romk1 KO mice by Q-PCR.
In summary, we have demonstrated differences in the functional roles of ROMK1 and ROMK2 in the regulation of NaCl and K+ homeostasis in vivo. Such variations are the result of ROMK1 and ROMK2 localization and structural differences; therefore animal knockouts of Romk1 do not produce Bartter phenotype and ROMK1 is critical in response to high K intake-stimulated K+ secretion in the collecting tubule. Whether K+ secretion is altered at the tubular level and whether BK channel is also up-regulated in the Romk1 KO mice, as we found in the total Romk KO mice (7), needs to be further investigated.
Author Contributions
S. C. H., G. G., E. B., W. W., and T. W. conceived and coordinated the study. K. D. generated the ROMK1 KO mouse; K. D., Q. Y., and T. W. performed metabolic and renal clearance; M. L. performed patch clamp, S. C. H. and K. D. performed IF staining, and L. W. performed Q-PCR experiments. H. H. and J. G. performed sample measurements and genotyping. T. W. wrote the paper. All authors (except S. C. H. who passed away) reviewed the results and approved the final version of the manuscript.
Acknowledgments
We thank the National Institutes of Health for their continued support of this research enabling us to complete this work after the passing of S. C. Hebert and Leah Sanders for editing this manuscript.
This work was supported by United States Public Health Service Grants RO1-DK54999 (to T. W. and S. H.), RO1-DK099284 (to T. W. and L. P.), and DK 54983 (to W. W.) from the National Institutes of Health, NIDDK. No conflicts of interest, financial or otherwise, are declared by the authors.
- ROMK
- renal outer medullary potassium
- TAL
- thick ascending limb
- CD
- collecting duct
- Q-PCR
- quantitative PCR
- GFR
- glomerular filtration rate
- CCD
- cortical collecting duct
- OMCD
- outer medullary collecting duct
- IF
- immunofluorescence
- mTAL
- medullary TAL
- SK
- small conductance K+ channel
- NKCC2
- Na-K-2Cl cotransporter
- NCC
- Na/Cl cotransporter
- PTP
- protein-tyrosine phosphatase
- PTK
- protein-tyrosine kinase
- FE
- fractional excretion.
References
- 1. Hebert S. C. (2003) Bartter syndrome. Curr. Opin. Nephrol. Hypertens. 12, 527–532 [DOI] [PubMed] [Google Scholar]
- 2. Lorenz J. N., Baird N. R., Judd L. M., Noonan W. T., Andringa A., Doetschman T., Manning P. A., Liu L. H., Miller M. L., and Shull G. E. (2002) Impaired renal NaCl absorption in mice lacking the ROMK potassium channel, a model for type II Bartter's syndrome. J. Biol. Chem. 277, 37871–37880 [DOI] [PubMed] [Google Scholar]
- 3. Lu M., Wang T., Yan Q., Yang X., Dong K., Knepper M. A., Wang W., Giebisch G., Shull G. E., and Hebert S. C. (2002) Absence of small conductance K+ channel (SK) activity in apical membranes of thick ascending limb and cortical collecting duct in ROMK (Bartter's) knockout mice. J. Biol. Chem. 277, 37881–37887 [DOI] [PMC free article] [PubMed] [Google Scholar]
- 4. Lu M., Wang T., Yan Q., Wang W., Giebisch G., and Hebert S. C. (2004) ROMK is required for expression of the 70-pS K channel in the thick ascending limb. Am. J. Physiol. Renal Physiol. 286, F490–F495 [DOI] [PubMed] [Google Scholar]
- 5. Cantone A., Yang X., Yan Q., Giebisch G., Hebert S. C., and Wang T. (2008) Mouse model of type II Bartter's syndrome: I. upregulation of thiazide-sensitive Na-Cl cotransport activity. Am. J. Physiol. Renal Physiol. 294, F1366–F1372 [DOI] [PubMed] [Google Scholar]
- 6. Wagner C. A., Loffing-Cueni D., Yan Q., Schulz N., Fakitsas P., Carrel M., Wang T., Verrey F., Geibel J. P., Giebisch G., Hebert S. C., and Loffing J. (2008) Mouse model of type II Bartter's syndrome: II. altered expression of renal sodium- and water-transporting proteins. Am. J. Physiol. Renal Physiol. 294, F1373–F1380 [DOI] [PubMed] [Google Scholar]
- 7. Bailey M. A., Cantone A., Yan Q., MacGregor G. G., Leng Q., Amorim J. B., Wang T., Hebert S. C., Giebisch G., and Malnic G. (2006) Maxi-K channels contribute to urinary potassium excretion in the ROMK-deficient mouse model of type II Bartter's syndrome and in adaptation to a high-K diet. Kidney Int. 70, 51–59 [DOI] [PubMed] [Google Scholar]
- 8. Ho K., Nichols C. G., Lederer W. J., Lytton J., Vassilev P. M., Kanazirska M. V., and Hebert S. C. (1993) Cloning and expression of an inwardly rectifying ATP-regulated potassium channel. Nature 362, 31–38 [DOI] [PubMed] [Google Scholar]
- 9. Boim M. A., Ho K., Shuck M. E., Bienkowski M. J., Block J. H., Slightom J. L., Yang Y., Brenner B. M., and Hebert S. C. (1995) ROMK inwardly rectifying ATP-sensitive K+ channel: II. cloning and distribution of alternative forms. Am. J. Physiol. 268, F1132–F1140 [DOI] [PubMed] [Google Scholar]
- 10. Beesley A. H., Ortega B., and White S. J. (1999) Splicing of a retained intron within ROMK K+ channel RNA generates a novel set of isoforms in rat kidney. Am. J. Physiol. 276, C585–592 [DOI] [PubMed] [Google Scholar]
- 11. Lin D. H., Sterling H., Yang B., Hebert S. C., Giebisch G., and Wang W. H. (2004) Protein tyrosine kinase is expressed and regulates ROMK1 location in the cortical collecting duct. Am. J. Physiol. Renal Physiol. 286, F881–F892 [DOI] [PMC free article] [PubMed] [Google Scholar]
- 12. Lin D. H., Sterling H., and Wang W. H. (2005) The protein tyrosine kinase-dependent pathway mediates the effect of K intake on renal K secretion. Physiology 20, 140–146 [DOI] [PubMed] [Google Scholar]
- 13. Giebisch G., Klein-Robbenhaar G., Klein-Robbenhaar J., Ratheiser K., and Unwin R. (1993) Renal and extrarenal sites of action of diuretics. Cardiovasc. Drugs Ther. 7, 11–21 [DOI] [PubMed] [Google Scholar]
- 14. Lu M., MacGregor G. G., Wang W., and Giebisch G. (2000) Extracellular ATP inhibits the small-conductance K channel on the apical membrane of the cortical collecting duct from mouse kidney. J. Gen. Physiol. 116, 299–310 [DOI] [PMC free article] [PubMed] [Google Scholar]
- 15. Du Z., Wan L., Yan Q., Weinbaum S., Weinstein A. M., and Wang T. (2012) Regulation of glomerulotubular balance: II: impact of angiotensin II on flow-dependent transport. Am. J. Physiol. Renal Physiol. 303, F1507–F1516 [DOI] [PMC free article] [PubMed] [Google Scholar]
- 16. Yan Q., Yang X., Cantone A., Giebisch G., Hebert S., and Wang T. (2008) Female ROMK null mice manifest more severe Bartter II phenotype on renal function and higher PGE2 production. Am. J. Physiol. Regul. Integr Comp. Physiol. 295, R997–R1004 [DOI] [PMC free article] [PubMed] [Google Scholar]
- 17. Wang T. (2012) Renal outer medullary potassium channel knockout models reveal thick ascending limb function and dysfunction. Clin. Exp. Nephrol. 16, 49–54 [DOI] [PubMed] [Google Scholar]
- 18. Shuck M. E., Bock J. H., Benjamin C. W., Tsai T. D., Lee K. S., Slightom J. L., and Bienkowski M. J. (1994) Cloning and characterization of multiple forms of the human kidney ROM-K potassium channel. J. Biol. Chem. 269, 24261–24270 [PubMed] [Google Scholar]
- 19. Seldin D. W., and Giebisch G. H. (2000) The Kidney: Physiology and Pathophysiology, 3rd Ed., pp. 2v (xxiv, 2942, I-2984 p), Lippincott Williams & Wilkins, Philadelphia, PA [Google Scholar]
- 20. Macica C. M., Yang Y., Hebert S. C., and Wang W. H. (1996) Arachidonic acid inhibits activity of cloned renal K+ channel, ROMK1. Am. J. Physiol. 271, F588–F594 [DOI] [PubMed] [Google Scholar]
- 21. Macica C. M., Yang Y., Lerea K., Hebert S. C., and Wang W. (1998) Role of the NH2 terminus of the cloned renal K+ channel, ROMK1, in arachidonic acid-mediated inhibition. Am. J. Physiol. 274, F175–F181 [DOI] [PubMed] [Google Scholar]
- 22. Wang W. H. (2006) Regulation of ROMK (Kir1.1) channels: new mechanisms and aspects. Am. J. Physiol. Renal Physiol. 290, F14–F19 [DOI] [PMC free article] [PubMed] [Google Scholar]
- 23. Wei Y., Bloom P., Lin D., Gu R., and Wang W. H. (2001) Effect of dietary K intake on apical small-conductance K channel in CCD: role of protein tyrosine kinase. Am. J. Physiol. Renal Physiol. 281, F206–F212 [DOI] [PubMed] [Google Scholar]
- 24. Linas S. L., Peterson L. N., Anderson R. J., Aisenbrey G. A., Simon F. R., and Berl T. (1979) Mechanism of renal potassium conservation in the rat. Kidney Int. 15, 601–611 [DOI] [PubMed] [Google Scholar]
- 25. Malnic G., Klose R. M., and Giebisch G. (1964) Micropuncture study of renal potassium excretion in the rat. Am. J. Physiol. 206, 674–686 [DOI] [PubMed] [Google Scholar]
- 26. Wang W., Lerea K. M., Chan M., and Giebisch G. (2000) Protein tyrosine kinase regulates the number of renal secretory K channels. Am. J. Physiol. Renal Physiol. 278, F165–171 [DOI] [PubMed] [Google Scholar]
- 27. Chu P. Y., Quigley R., Babich V., and Huang C. L. (2003) Dietary potassium restriction stimulates endocytosis of ROMK channel in rat cortical collecting duct. Am. J. Physiol. Renal Physiol. 285, F1179–F1187 [DOI] [PubMed] [Google Scholar]
- 28. Wang W. (2004) Regulation of renal K transport by dietary K intake. Annu. Rev. Physiol. 66, 547–569 [DOI] [PubMed] [Google Scholar]
- 29. Giebisch G. (2001) Renal potassium channels: function, regulation, and structure. Kidney Int. 60, 436–445 [DOI] [PubMed] [Google Scholar]
- 30. Zeng W. Z., Babich V., Ortega B., Quigley R., White S. J., Welling P. A., and Huang C. L. (2002) Evidence for endocytosis of ROMK potassium channel via clathrin-coated vesicles. Am. J. Physiol. Renal. Physiol. 283, F630–F639 [DOI] [PubMed] [Google Scholar]
- 31. Sterling H., Lin D. H., Gu R. M., Dong K., Hebert S. C., and Wang W. H. (2002) Inhibition of protein-tyrosine phosphatase stimulates the dynamin-dependent endocytosis of ROMK1. J. Biol. Chem. 277, 4317–4323 [DOI] [PMC free article] [PubMed] [Google Scholar]
- 32. Moral Z., Dong K., Wei Y., Sterling H., Deng H., Ali S., Gu R., Huang X. Y., Hebert S. C., Giebisch G., and Wang W. H. (2001) Regulation of ROMK1 channels by protein-tyrosine kinase and -tyrosine phosphatase. J. Biol. Chem. 276, 7156–7163 [DOI] [PMC free article] [PubMed] [Google Scholar]
- 33. Gu R. M., Wei Y., Falck J. R., Krishna U. M., and Wang W. H. (2001) Effects of protein tyrosine kinase and protein tyrosine phosphatase on apical K+ channels in the TAL. Am. J. Physiol. Cell Physiol. 281, C1188–C1195 [DOI] [PubMed] [Google Scholar]
- 34. Rapedius M., Haider S., Browne K. F., Shang L., Sansom M. S., Baukrowitz T., and Tucker S. J. (2006) Structural and functional analysis of the putative pH sensor in the Kir1.1 (ROMK) potassium channel. EMBO Rep. 7, 611–616 [DOI] [PMC free article] [PubMed] [Google Scholar]
- 35. Dvoryanchikov G., Sinclair M. S., Perea-Martinez I., Wang T., and Chaudhari N. (2009) Inward rectifier channel, ROMK, is localized to the apical tips of glial-like cells in mouse taste buds. J. Comp. Neurol. 517, 1–14 [DOI] [PMC free article] [PubMed] [Google Scholar]