Abstract
Past studies of radiation belt relativistic electrons have favored active storm time periods, while the effects of small geomagnetic storms (D s t > −50 nT) have not been statistically characterized. In this timely study, given the current weak solar cycle, we identify 342 small storms from 1989 through 2000 and quantify the corresponding change in relativistic electron flux at geosynchronous orbit. Surprisingly, small storms can be equally as effective as large storms at enhancing and depleting fluxes. Slight differences exist, as small storms are 10% less likely to result in flux enhancement and 10% more likely to result in flux depletion than large storms. Nevertheless, it is clear that neither acceleration nor loss mechanisms scale with storm drivers as would be expected. Small geomagnetic storms play a significant role in radiation belt relativistic electron dynamics and provide opportunities to gain new insights into the complex balance of acceleration and loss processes.
Keywords: radiation belt dynamics, solar wind, geomagnetic storms, geosynchronous relativistic electron flux
Key Points
Radiation belt relativistic electron response to small storms is as extreme as to large storms
Small storms are slightly less/more likely to enhance/deplete electrons than large storms
Nevertheless, electron response does not scale with size of storm, even for very small storms
1. Introduction
Since the turn of the century, interest in the dynamic behavior of the radiation belts has grown immensely (for reviews, see Millan and Baker [2012], Millan and Thorne [2007], and Hudson et al. [2008]). It is well known that processes leading to radiation belt relativistic electron enhancements also lead to greater losses [e.g., Turner et al., 2014]. Sometimes acceleration dominates, and at other times loss, to either the magnetopause or atmosphere (precipitation), dominates. In fact, it is exactly this interplay between the various acceleration, loss, and transport mechanisms that brings about the wide range of responses in the radiation belts. New missions, such as the Van Allen Probes, are making extraordinarily detailed measurements of the particle and wave environment throughout the radiation belts. Yet solar cycle 24 has proven to be very weak, producing many fewer large geomagnetic disturbances than previous solar cycles.
In a precursor to this study, Reeves et al. [2003] statistically investigated the change of relativistic electron flux levels at geosynchronous due to moderate and large geomagnetic storms, those with minimum disturbance storm time (D s t) index less than −50 nT [Gonzalez et al., 1994]. (Hereafter, these storms will collectively be referred to as “large.”) They found that large geomagnetic storms result in flux enhancements 53% of the time, no change to the flux level 28% of the time, and flux depletions 19% of the time.
Small geomagnetic storms (minimum D s t > −50 nT) can also result in significant enhancement or depletion of radiation belt electrons. For example, on 14 February 2009 a small geomagnetic storm (minimum D s t −36 nT) resulted in prolonged enhancement of relativistic electrons at geosynchronous orbit by several orders of magnitude (Figure 1). Concurrent with this small storm, electron precipitation was detected by a Balloon Array for Radiation‐belt Relativistic Electron Losses (BARREL) payload [Millan et al., 2013] located at the Southern Hemispheric magnetic foot point of the radiation belts. More recent studies have even reported dramatic radiation belt activity during nonstorm times [e.g., Schiller et al., 2014; Su et al., 2014], underscoring the importance of investigating electron dynamics even during geomagnetically quiet times.
Figure 1.
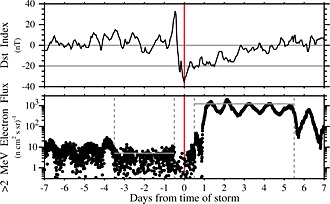
Example of a small storm during a BARREL test flight. Two weeks of data are plotted, centered on the time of storm, 14 February 2009 1500 UT, which is marked by a vertical red line. (top) D s t; horizontal lines mark 0 nT and −20 nT as a guide. D s t dropped 69 nT to a minimum of −36 nT. (bottom) Geosynchronous GOES 11 > 2 MeV electron flux; dashed vertical lines mark the prestorm and poststorm periods, and horizontal lines mark the corresponding 90th percentile maximum flux.
Therefore, it is essential to understand the statistical response of relativistic electrons in the radiation belts to small geomagnetic storms. To date, no such study has been performed. Here we extend the analysis of electron response to geomagnetic storms to include the smallest storms.
2. Determining Changes in Relativistic Electron Flux
The method used in the present study closely follows that of Reeves et al. [2003] and analyzes the same period beginning in October 1989 and ending in October 2000. We begin by identifying small geomagnetic storms using 1 h resolution D s t data. The time of the storm is defined as the time of minimum D s t.
We use an automated storm‐finding algorithm with three relatively simple criteria. The first criterion serves to select times for which D s t is at a minimum value. The second criterion restricts the identification to small geomagnetic storms. The third criterion requires a preceding sharp and significant drop in D s t. The criteria are as follows: (1) D s t must be the first occurrence of the global minimum during a period extending 16 h prior and 16 h after; (2) D s t must be between −50 nT and −20 nT, inclusive; and (3) D s t must decrease by at least 27 nT in the preceding 12 h.
These criteria together select times for which D s t shows similar characteristics as during large geomagnetic storms, namely, a sharp drop that indicates the start of the storm main phase followed by a recovery period extending several days or longer. Sometimes, a sudden storm commencement is indicated by a sharp rise in D s t prior to the drop. These criteria, in particular the third, have been empirically fine tuned to ensure nonstorm fluctuations in D s t do not trigger false identification of small storms while maximizing the identification of real storms. The vast majority of potential storms with smaller drops in D s t do not display storm‐like D s t signatures, while those with larger drops do. The list of identified small storms has been manually verified for several randomly selected 1 year periods.
Further, we modify the criteria to similarly identify large geomagnetic storms to allow for a direct comparison with Reeves et al. [2003] to validate our method. The first criterion remains the same. Obviously, the second criterion is changed to require D s t be less than −50 nT. The third criterion is changed to require a drop of at least 55 nT in the preceding 16 h. Our automatic identification of large storms is in excellent agreement with the storms identified by Reeves et al. [2003] (>80% commonality).
Figure 2 shows the D s t signature of all identified storms, small and large, for the 2 week period centered on the time of storm, with the median and upper and lower quartile levels overlaid as black lines. For both sets of storms, there are occurrences when a given storm is closely preceded or followed by another storm. To assess the effect this may have, we create subgroups of “isolated” storms. These are storms that are separated temporally from any other storm, whether small or large, by at least 5 days.
Figure 2.
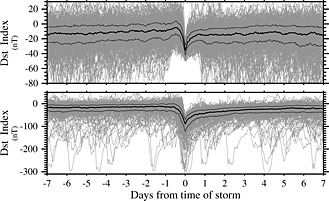
D s t signatures for all (top) small and (bottom) large storms included in this study are plotted for two weeks centered on the time of storm. Median as well as upper and lower quartile levels for D s t are plotted in black lines.
To quantify the change in relativistic electron flux, we use Los Alamos National Laboratory (LANL) geosynchronous (L ≈6.6) satellite 1.8–3.5 MeV electron flux data from the Energy Spectrometer for Particles instrument [Meier et al., 1996]. One hour resolution data are weighted by each of the five satellite's lifetime average flux values and then averaged across all satellites to create one consistent time series. We then compare the 90th percentile maximum flux value in the poststorm period (0.5–5.5 days after) to that of the prestorm period (3.5–0.5 days before). See Figure 1 for graphical illustration. If the poststorm/prestorm flux ratio is greater than 2, we determine that the storm resulted in flux enhancement. If the flux change ratio is less than 0.5, the storm resulted in flux depletion. If the flux change is within a factor of 2, the storm resulted in “no change” to the electron flux.
Radiation belt electron fluxes vary by energy and L shell. Reeves et al. [2003] showed, however, that the probability a storm will result in an enhancement or depletion is independent of L shell. Relativistic electron flux at geosynchronous also varies in local time due to magnetic field asymmetries. Since we use only the maximum flux to quantify change, and since both prestorm and poststorm periods are several days long, this diurnal variation has little impact on the present study. Use of the 90th percentile maximum flux further minimizes the impact of brief flux measurement increases that may be caused by the field asymmetry.
We also use solar wind speed data from the OMNI database. We determine the maximum solar wind speed during each storm, from the beginning of the prestorm period through the end of the poststorm period. We then compare the relativistic electron flux change for storms during various solar wind speed ranges, as in Reeves et al. [2003].
3. Results
We identify 342 small geomagnetic storms between October 1989 and October 2000 for which geosynchronous LANL 1.8–3.5 MeV electron flux data are available. We similarly identify 234 large geomagnetic storms. Figure 3 shows the 90th percentile poststorm flux versus 90th percentile prestorm flux for all small and large storms. Each dot represents one storm. These two distributions are quite similar. We make three significant observations. First, regardless of the size of the geomagnetic storm, a very wide range of geosynchronous relativistic electron responses are possible. Second, there is no correlation between prestorm and poststorm flux levels; in other words, any poststorm flux level can be preceded by any prestorm flux level for any size of storm. Finally, though not explicitly shown, the distributions of poststorm absolute flux levels are nearly identically distributed for small and large storms.
Figure 3.
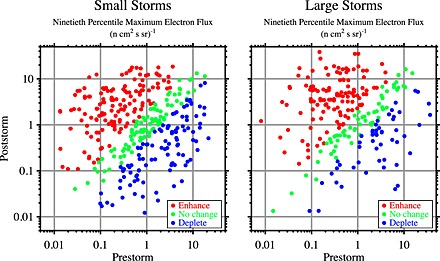
Distributions of 90th percentile maximum electron flux for small and large storms. Poststorm flux is plotted on the ordinate, and prestorm flux is plotted on the abscissa. Each storm for which LANL 1.8–3.5 MeV geosynchronous electron flux data are available is represented by a dot. Color helps differentiate between storms that result in enhancement (red), no change (green), or depletion (blue) of relativistic electron flux.
Of the 342 small geomagnetic storms, 42% result in enhancement, 26% result in no change, and 32% result in depletion of relativistic electron flux. The large storms identified in this study result in flux enhancement/no change/depletion 52%/26%/22% of the time, respectively. The proportions for large storms are in excellent agreement with Reeves et al. [2003], providing confidence in our new storm‐finding technique and analysis. These results are summarized in the top portion of Table 1. Overall, small storms show very similar proportions of flux enhancement/no change/depletion as large storms, though small storms are slightly less likely to result in enhancement and slightly more likely to result in depletion.
Table 1.
Small and Large Storm Relativistic Electron Response
| 342 Small Storms | 234 Large Storms | |
|---|---|---|
| Flux enhancement | 144 (42%) | 121 (52%) |
| No change in flux | 90 (26%) | 61 (26%) |
| Flux depletion | 108 (32%) | 52 (22%) |
| 91 Isolated Small Storms | 71 Isolated Large Storms | |
| Flux enhancement | 30 (33%) | 36 (51%) |
| No change in flux | 27 (30%) | 16 (23%) |
| Flux depletion | 34 (37%) | 19 (27%) |
For small and large storms, the ranges of possible flux change are equally as wide and similarly distributed. Figures 4a and 4b show histograms of flux change ratios for small and large storms. Figure 4c shows cumulative distribution function (CDF) curves for small (black) and large (red) storms. These CDF curves represent the probability that a storm has a flux change ratio less than a certain value. The largest vertical difference between two CDF curves and the sizes of the corresponding subsets are used in a Kolmogorov‐Smirnov test to determine the statistical likelihood that the difference between the distributions is random. In Figure 4c, the largest difference between the curves is 13%, and the difference between the distributions is unlikely to be random (< 2%). In other words, though not huge, the difference between the distributions of flux change ratios for small and large storms is statistically significant.
Figure 4.
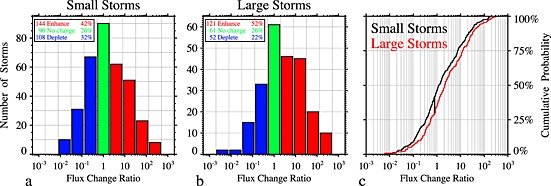
Histograms of the flux change ratios for (a) small and (b) large storms. Color is used to more clearly indicate enhancement/no change/depletion events. (c) Cumulative distribution function curves for small (black) and large (red) storms show the probability (ordinate) that a storm from a given subset will result in a flux change ratio equal to or less than a given value (abscissa). The dark vertical line marks the maximal difference between the two distributions (here 13%). The statistical likelihood that the difference between these two distributions is random is less than 2%.
We similarly analyze electron flux response to isolated storms. Of the 91 isolated small storms, 33%/30%/37% are found to result in enhancement/no change/depletion of relativistic electron fluxes, respectively. For the 71 isolated large storms, the corresponding proportions are 51%/23%/27%. (See the bottom half of Table 1.) The biggest change when considering only isolated storms is that the proportion of small storms that enhance flux decreases. Also, both small and large storms show a slight increase in the proportion of storms that result in flux enhancement. Despite the smaller sample sizes, the difference between the flux change ratio distributions for isolated small and isolated large storms is statistically significant (chance random < 3%).
Flux enhancements are correlated with periods of faster solar wind for large storms [Reeves et al., 2003]. We find that small storms exhibit the same correlation even more strongly. Figure 5 shows CDF curves of the flux change ratios for small and large storms, each binned by maximum solar wind speed during the storm. The maximal difference between any two curves for small storms is 43%, and the probability that this is random is less than 0.004%. For large storms, the maximal difference is 31% and the probability that this is random is less than 2% (again, in excellent agreement with Reeves et al. [2003]).
Figure 5.
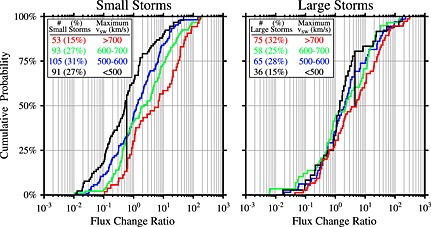
CDF curves for small and large storms, each broken into four subgroups by maximum solar wind speed (km/s) during the entire storm period: < 500 in black, 500–600 in blue, 600–700 in green, and > 700 in red. The largest vertical difference between any two curves in each plot is marked by a thick vertical black line. In both plots, this largest vertical difference is between the subgroups occurring during the fastest and slowest solar wind conditions. The largest vertical difference for small storms is 43% (chance random < 0.004%) and for large storms is 31% (chance random < 2%).
4. Discussion
We have examined the relativistic electron response at geosynchronous orbit for 342 small geomagnetic storms between 1989 and 2000. We have demonstrated that even though D s t remains above −50 nT, small storms have important effects on radiation belt relativistic electron fluxes. As a validation of our method, we identified 234 large storms during the same period and successfully reproduced results of Reeves et al. [2003].
Contrary to what is often expected, the effects on radiation belt relativistic electron fluxes of small geomagnetic storms are comparable with those of large storms. Overall, the enhancement/no change/depletion proportions are very similar for small and large storms. Flux enhancements and depletions can be equally as extreme, and further, both small and large storms result in similarly distributed poststorm flux levels.
To rule out the possibility that the effects of small storms are merely the lingering effects of storms that occur in quick succession, we similarly analyzed isolated storms. We found that similar results generally hold true. The enhancement/no change/depletion proportions remain nearly the same for the isolated subset of large storms. Though their enhancement/depletion proportions are slightly more skewed than those for all small storms, isolated small storms exhibit the same very wide range of possible effects on radiation belt electrons. Thus, the effects of small storms are real and nonnegligible.
We have also shown that faster solar wind conditions increase the likelihood of a flux enhancement for all storms. As the horizontal separation of CDF curves in Figure 5 shows, faster solar wind drivers are not merely more likely to result in flux enhancements, but stronger flux enhancements. That this is much more evident for small storms suggests that the effects of solar wind drivers might be more easily distinguishable during less geomagnetically disturbed times. Nonetheless, as other studies confirm [e.g., Kilpua et al., 2015; Reeves et al., 2011], all classes of solar wind drivers can produce electron flux enhancement, no change, or depletion.
There remains a difference between the distributions of flux changes for small versus large storms. Small storms are less likely to result in flux enhancements and more likely to result in flux depletions than large storms. Though statistically significant, this difference is not large, indicating that the response to small and large storms is similar in both cases. The trend is slightly exaggerated for isolated storms, though the much smaller sample sizes limit conclusive interpretation. What is most remarkable is that the distributions of flux changes for small and large storms are so similar and equally as wide.
5. Conclusion
This study demonstrates that for all geomagnetic storms, even the smallest storms, the D s t index is a poor predictor of relativistic electron dynamics in the radiation belts. Perhaps this should not come as a surprise. D s t is often thought of as a proxy for ring current ions, though other currents may also contribute significantly to D s t [Zhao et al., 2015]. In contrast, the processes that lead to relativistic electron acceleration, loss, and transport depend heavily on the electron seed and core populations as well as waves, some of which depend on source electrons (several to tens of keV electrons).
One might expect that with less intense geomagnetic activity, radiation belt response would also be less intense. Indeed, many phenomena do scale with D s t, for example, number and intensity of injections, generation of waves, erosion of the plasmasphere, and radial diffusion. In other words, one might expect the enhancement and depletion of radiation belt electrons to be less extreme for small storms, even if the corresponding proportions are roughly the same as for large storms. Instead, we find that neither the range nor the proportions of possible radiation belt responses scale with size of storm. This emphasizes the fact that radiation belt dynamics is highly complex, and we fundamentally do not understand how radiation belt responses scale with the drivers.
Recent studies have begun to investigate more closely the complete narrative of electron acceleration or loss in the radiation belts [e.g., Boyd et al., 2014; Breneman et al., 2015; Jaynes et al., 2015]. In addition to more accurately determining the causes of acceleration or loss, new studies must also separately quantify the amount of acceleration and loss during events. Since multiple processes may occur simultaneously, often with competing effects, this can be a difficult task.
Small storms play a larger role in radiation belt dynamics than previously thought. Further, small storms occur when the magnetosphere is less disturbed, by definition, and thus provide opportunities to more clearly analyze cause and effect relationships as well as quantify acceleration and/or loss. This becomes even more significant in light of the relatively quiet geomagnetic conditions of solar cycle 24. Our storm‐finding algorithm applied to January 2008 through October 2015 identifies less than half as many large storms (72) than the corresponding period following the start of solar cycle 23 in May 1996 (157). Given the plethora of new data sources and tools that can powerfully address this issue, now is a fantastic time to be investigating the causes of radiation belt relativistic electron acceleration and loss as well as the delicate balance between these competing mechanisms.
Acknowledgments
This research was supported in part by the BARREL NASA grant NNX08AM58G. B.A. thanks the New Hampshire Space Grant Consortium for support, as well as A. Halford, M. McCarthy, and L. Woodger for numerous conversations that enhanced the present study. The authors thank the World Data Center for Geomagnetism, Kyoto, and the Hermanus, Honolulu, Kakioka, San Juan, and INTERMAGNET observatories for providing the D s t index. We thank the Goddard Space Flight Center Space Physics Data Facility for use of their OMNIWeb Plus service to access OMNI data and CDAWeb service to access NOAA GOES data. Data from the LANL‐GEO SOPA instrument were provided by the U.S. Department of Energy's Los Alamos National Laboratories and are available upon request from Geoff Reeves (reeves@lanl.gov).
Anderson, B. R. , Millan R. M., Reeves G. D., and Friedel R. H. W. (2015), Acceleration and loss of relativistic electrons during small geomagnetic storms, Geophys. Res. Lett., 42, 10,113–10,119, doi:10.1002/2015GL066376.
References
- Boyd, A. J. , Spence H. E., Claudepierre S. G., Fennell J. F., Blake J. B., Baker D. N., Reeves G. D., and Turner D. L. (2014), Quantifying the radiation belt seed population in the 17 March 2013 electron acceleration event, Geophys. Res. Lett., 41, 2275–2281, doi:10.1002/2014GL059626. [Google Scholar]
- Breneman, A. W. , et al. (2015), Global‐scale coherence modulation of radiation‐belt electron loss from plasmaspheric hiss, Nature, 523, 193–195, doi:10.1038/nature14515. [DOI] [PubMed] [Google Scholar]
- Gonzalez, W. D. , Joselyn J. A., Kamide Y., Kroehl H. W., Rostoker G., Tsurutani B. T., and Vasyliunas V. M. (1994), What is a geomagnetic storm?, J. Geophys. Res., 99, 5771–5792, doi:10.1029/93JA02867. [Google Scholar]
- Hudson, M. K. , Kress B. T., Mueller H.‐R., Zastrow J. A., and Blake J. B. (2008), Relationship of the Van Allen radiation belts to solar wind drivers, J. Atmos. Sol. Terr. Phys., 70, 708–729, doi:10.1016/j.jastp.2007.11.003. [Google Scholar]
- Jaynes, A. N. , et al. (2015), Source and seed populations for relativistic electrons: Their roles in radiation belt changes, J. Geophys. Res. Space Physics, 120, 7240–7254, doi:10.1002/2015JA021234. [Google Scholar]
- Kilpua, E. K. J. , Hietala H., Turner D. L., Koskinen H. E. J., Pulkkinen T. I., Rodriguez J. V., Reeves G. D., Claudepierre S. G., and Spence H. E. (2015), Unraveling the drivers of the storm time radiation belt response, Geophys. Res. Lett., 42, 3076–3084, doi:10.1002/2015GL063542. [Google Scholar]
- Meier, M. M. , Belian R. D., Cayton T. E., Christensen R. A., Garcia B., Grace K. M., Ingraham J. C., Laros J. G., and Reeves G. D. (1996), The energy spectrometer for particles (esp): Instrument description and orbital performance, in Workshop on the Earth's Trapped Particle Environment, AIP Conf. Proc., vol. 383, edited by Reeves G. D., pp. 203–210, Am. Inst. Phys, New York, doi:10.1063/1.51533. [Google Scholar]
- Millan, R. M. , and Baker D. N. (2012), Acceleration of particles to high energies in Earth's radiation belts, Space Sci. Rev., 173, 103–131, doi:10.1007/s11214-012-9941-x. [Google Scholar]
- Millan, R. M. , and Thorne R. M. (2007), Review of radiation belt relativistic electron losses, J. Atmos. Terr. Phys., 69, 362–377, doi:10.1016/j.jastp.2006.06.019. [Google Scholar]
- Millan, R. M. , et al. (2013), The balloon array for RBSP relativistic electron losses (BARREL), Space Sci. Rev., 179, 503–530, doi:10.1007/s11214-013-9971-z. [Google Scholar]
- Reeves, G. D. , McAdams K. L., Friedel R. H. W., and O'Brien T. P. (2003), Acceleration and loss of relativistic electrons during geomagnetic storms, Geophys. Res. Lett., 30(10), 1529, doi:10.1029/2002GL016513. [DOI] [PMC free article] [PubMed] [Google Scholar]
- Reeves, G. D. , Morley S. K., Friedel R. H. W., Henderson M. G., Cayton T. E., Cunningham G., Blake J. B., Christensen R. A., and Thomsen D. (2011), On the relationship between relativistic electron flux and solar wind velocity: Paulikas and Blake revisited, J. Geophys. Res., 116, A02213, doi:10.1029/2010JA015735. [Google Scholar]
- Schiller, Q. , Li X., Blum L., Tu W., Turner D. L., and Blake J. B. (2014), A nonstorm time enhancement of relativistic electrons in the outer radiation belt, Geophys. Res. Lett., 41, 7–12, doi:10.1002/2013GL058485. [Google Scholar]
- Su, Z. , et al. (2014), Nonstorm time dynamics of electron radiation belts observed by the Van Allen Probes, Geophys. Res. Lett., 41, 229–235, doi:10.1002/2013GL058912. [Google Scholar]
- Turner, D. L. , et al. (2014), Competing source and loss mechanisms due to wave‐particle interactions in Earth's outer radiation belt during the 30 September to 3 October 2012 geomagnetic storm, J. Geophys. Res. Space Physics, 119, 1960–1979, doi:10.1002/2014JA019770. [Google Scholar]
- Zhao, H. , et al. (2015), The evolution of ring current ion energy density and energy content during geomagnetic storms based on Van Allen Probes measurements, J. Geophys. Res. Space Physics, 120, 7493–7511, doi:10.1002/2015JA021533. [Google Scholar]


