

Summary
B7‐2–/– non‐obese diabetic (NOD) mice develop a spontaneous autoimmune polyneuropathy (SAP) that mimics the progressive form of chronic inflammatory demyelinating polyradiculoneuropathy (CIDP). In this study, we focused on the role of regulatory T cells (Tregs) and regulatory B cells (Bregs) in SAP. We found that deletion of B7‐2 in female NOD mice led to a lower frequency and number of Tregs and Bregs in spleens and lymph nodes. Tregs but not Bregs suppressed antigen‐stimulated splenocyte proliferation, whereas Bregs inhibited the T helper type 1 (Th1) cytokine response. Both Tregs and Bregs induced an increase in CD4+interleukin (IL)−10+ cells, although less effectively in the absence of B7‐2. Adoptive transfer studies revealed that Tregs, but not Bregs, suppressed SAP, while Bregs attenuated disease severity when given prior to symptom onset. B cell deficiency in B cell‐deficient (muMT)/B7‐2–/– NOD mice prevented the development of SAP, which would indicate that the pathogenic role of B cells predominates over its regulatory role in this model. We conclude that Bregs and Tregs control the immunopathogenesis and progression of SAP in a non‐redundant fashion, and that therapies aimed at expansion of Bregs and Tregs may be an effective approach in autoimmune neuropathies.
Keywords: Bregs, CIDP, co‐stimulatory molecules, Guillain–Barré syndrome, Tregs
Introduction
Autoimmunity arises when there is a break in self‐tolerance resulting in persistent autoreactive T cells and B cells. Tolerance to self‐antigens is generated through two basic mechanisms: (a) elimination of self‐reactive cells in thymus during selection and (b) generation of peripheral regulatory lymphocytes to control self‐reactive cells that escape the thymus. Included in the complex network of regulatory T cells (Tregs) are CD4+ Tregs [CD4+CD25+forkhead box protein 3 (FoxP3+)], type 1 regulatory (Tr1) cells [interleukin (IL)−10+, FoxP3–], T helper type 3 (Th3) cells [transforming growth factor (TGF‐β+)], CD8+ Tregs, CD1‐restricted natural killer (NK) T cells and T cells with γ/δ receptors 1. The identification of CD25 and subsequently FoxP3 as markers for CD4+ Tregs has greatly facilitated studies of their crucial role in suppressing autoimmune diseases, their mechanisms of action and factors regulating their homeostasis 2, 3, 4, 5. Similar to Tregs, a variety of regulatory B cells (Bregs) has been described. Tedder and colleagues have identified a subset of IL‐10‐producing B cells (B10 cells) within the CD1dhi CD5+ B cell population that inhibit contact hypersensitivity responses 6. B10 cells share certain phenotypical markers with B1‐a cells, marginal zone (MZ) B cells and transitional 2‐MZ precursor (T2‐MZP) B cells, which are also capable of producing IL‐10 7.
CD4+ Tregs suppress immune responses by modulation of antigen‐presenting cell (APC) maturation and function, production of anti‐inflammatory cytokines such as IL‐10, TGF‐β and IL‐35, induction of effector T cell apoptosis and disruption of metabolic pathways 8. Bregs promote T cell differentiation towards a regulatory phenotype instead of Th1 and Th17 cells 9, 10. B10 cells negatively regulate the ability of dendritic cells (DCs) to present antigens as well as suppress Th1 and Th17 responses in animal models of autoimmune diseases 11, 12. Similar to Tregs, some Bregs express TGF‐β and IL‐35 in addition to IL‐10 13. Unlike Tregs, a Breg‐specific transcription factor has yet to be identified.
Most animal studies of the role of Tregs or Bregs in central nervous system (CNS) and peripheral nervous system (PNS) inflammation have been carried out in induced experimental models such as autoimmune encephalomyelitis (EAE) and experimental autoimmune neuritis (EAN) 11, 14, 15, 16. The goal of this study was to investigate the role of CD4+ Tregs and CD1dhi CD5+ Bregs in a spontaneous autoimmune polyneuropathy (SAP) in B7‐2–/– non‐obese diabetic (NOD) mice. SAP is characterized by progressive weakness, electrophysiological findings of demyelinating features and axonal loss as well as presence of inflammatory cells in sections of sciatic nerves and dorsal root ganglia 17, 18. These findings mimic those of human chronic inflammatory demyelinating polyradiculoneuropathy (CIDP), although the latter can be relapsing–remitting or progressive. SAP is mediated by myelin P0‐reactive Th1 cells and at least two epitopes are involved: P0 (180–199) and P0 (1–25) 17, 19, 20, 21. More recently, we have demonstrated that absence of B7‐2 on DCs leads to impaired capacity to induce tolerance to P0, which can be restored by preconditioning with IL‐10. Adoptive transfer (AT) of IL‐10‐conditioned DCs leads to increased CD4+ Tregs and B10 cells in vivo 22. Whether CD4+ Tregs and Bregs/B10 cells share overlapping or distinct functions in SAP has not been investigated. For subsequent sections, CD19+ CD1dhiCD5+ B cells will be referred to simply as Bregs. B10 cells are defined as IL‐10+ B cells detected after 4–5 h exposure to lipopolysaccharide (LPS) and leucocyte activation cocktail as described originally 6. Here, we provide evidence that Bregs and Tregs control the immunopathogenesis and progression of SAP in a distinct manner.
Materials and methods
Animals, clinical and electrophysiological assessment
Wild‐type (WT) NOD, B7‐2–/– NOD, FoxP3‐enhanced green fluorescent protein‐fused to cre recombinase sequence (eGFP‐Cre) NOD mice (Jackson Laboratory, Bar Harbor, ME, USA), and B cell‐deficient (muMT) NOD mice (generously provided by Dr A. Chervonsky, The University of Chicago) were housed and bred in pathogen‐free conditions in the Animal Barrier Facility. All animal use procedures were conducted in strict accordance with the National Institutes of Health and University of Chicago institutional guidelines. In addition, muMT/B7‐2–/– NOD mice were generated by crossing B7‐2–/– NOD mice with muMT NOD mice. Female B7‐2–/– NOD mice were used in this study unless stated otherwise. For clinical assessment, the following scale was used: 0, normal; 0·5, mild ruffled coat; 1, less active or flaccid tail; 1·5, one leg is curled in when held by tail; 2, mild paraparesis (both legs curled in); 2·5, drags one leg; 3, severe paraparesis (drags both legs); 3·5, severe quadriparesis; and 4, death. Grip strength testing consisted of five separate measurements in each of two trials per session using a grip strength meter (Columbus Instruments, Columbus, OH, USA). Results of two trials were averaged for each mouse per session. After the last grip strength measurement, electrophysiological studies of sciatic nerves were performed as described in our previous publications 22, 23. Latencies, conduction velocities and peak to peak amplitudes were measured. Results from stimulation of bilateral sciatic nerves were averaged for each animal, with ‘n’ representing the number of animals in each study group.
In‐vitro co‐cultures and cell proliferation studies
Splenocyte proliferation was determined using [3H]‐thymidine incorporation assay as described previously 20. Cells were stimulated with P0 (180–199) (20 μg/ml) or P0–ECD (20 μg/ml) for 72 h. On day 3, cultures were pulsed for 16 h with 1 μCi methyl‐[3H]‐thymidine. The stimulation index was defined by counts per minute (cpm) in the presence of antigen divided by cpm in the absence of antigen. P0 peptide (180–199) and P0‐ECD were purchased from Genscript (Piscataway, NJ, USA).
For Treg‐CD4+ T cell and Breg‐CD4+ T cell co‐cultures, Tregs (CD4+CD25+) and Bregs (CD19+CD1dhiCD5+) were sorted from splenocytes and lymph node (LN) cells using a BD fluorescence activated cell sorter (FACS)Aria cell sorter BD Biosciences (San Jose, CA, USA). Tregs were added to 5 × 10⁴ effector T cells (CD4+CD25– T cells from SAP mice) at varying ratios in the presence of 20 μg/ml P0 (180–189) and irradiated APCs (50, 000) for 3 days in RPMI‐1640 with 10% serum. Bregs were added to SAP CD4+CD25– T cells at a 1 : 1 ratio. On day 3, co‐cultures were pulsed for 16 h with 1 μCi methyl‐[3H]‐thymidine for proliferation studies.
For T cell cytokine profile in co‐culture studies, Tregs and Bregs were sorted from splenocytes and LN cells of 2‐month‐old WT and B7‐2–/– NOD mice at 10 days post‐immunization with 200 µg P0 (180–199). Tregs or Bregs were co‐cultured with 5 × 10⁴ effector T cells (CD4+CD25– T cells from SAP mice) at a 1 : 1 ratio in the presence of P0 (180–199) and irradiated APCs (50, 000). For Breg‐CD4 co‐cultures, LPS (100 ng/ml) was also added. On day 3, leucocyte activation cocktail was added during the last 4 h prior to intracellular cytokine staining for flow cytometry.
Flow cytometry and intracellular cytokine staining
Single‐cell suspensions from spleens and LNs were stained at 4°C using predetermined optimal concentrations of antibodies for 30 min. Cells with the forward‐ and side‐scatter properties of lymphocytes were analysed using the Fortessa flow cytometer (BD Bioscience, San Jose, CA, USA). Background staining was assessed using isotype‐matched control (Ctrl) antibodies. For intracellular cytokine staining, splenocytes (1 × 10⁶/well) in 96‐well plates were stimulated at 37°C in a humidified CO2 incubator for 4 h with leucocyte activation cocktail (BD Pharmingen, San Jose, CA, USA). This was followed by staining for cell surface CD4 and intracellular interferon (IFN)‐γ, IL‐17 or IL‐10 using the Intracellular Cytokine Staining Starter Kit (BD Pharmingen, San Diego, CA, USA). The percentage of IFN‐γ‐, IL‐17‐ and IL‐10‐producing CD4+ T cells was analysed by Fortessa flow cytometer and FlowJo software (TreeStar Inc., Ashland, OH, USA). For the detection of CD4+ Tregs, splenocytes were stained with fluorescein isothiocyanate (FITC)‐conjugated anti‐mouse CD4 and APC‐conjugated anti‐mouse CD25 antibodies, fixed, permeabilized and subsequently stained with phycoerythrin (PE)‐conjugated anti‐mouse FoxP3 antobody (eBioscience, San Diego, CA, USA).
With regard to B10 cells, splenocytes were incubated for 4 h in 96‐well plates with LPS (10 μg/ml) in addition to leucocyte activation cocktail. Cells were then stained with V450‐conjugated anti‐mouse CD19 antibody followed by fixation and permeabilization using a Cytofix Kit prior to staining with PE‐conjugated anti‐mouse IL‐10 antibody (BD Biosciences).
AT studies
A BD FACSAria cell sorter was used to sort CD4+ eGFP+ (Tregs), CD4+eGFP– cells, Bregs (CD19+CD1dhiCD5+) and non‐Bregs (CD19+CD1d–CD5–) from splenocytes and LN cells of 2‐month‐old Foxp3‐eGFP‐Cre NOD mice immunized with P0 (200 μg) followed by pertussis toxin (500 ng) on days 1 and 3 (killed at day 20). Approximately 1 × 10⁶ sorted cells were injected via tail vein into 6‐month‐old female B7‐2–/– NOD mice for suppression studies and 5‐month‐old female B7‐2–/– NOD mice for prevention studies. Serial clinical assessments, grip strength measurements and electrophysiology were performed as described previously 22, 24. Animals were euthanized at the end of study duration for immunological studies.
Data analysis
Results from clinical severity, immunological studies, grip strength measurements and electrophysiology are expressed as mean ± standard error of the mean (s.e.m.). Statistical significance for these data was determined by analysis of variance (anova) followed by Student's t‐test and the Bonferroni method for multiple group experiments. Significance levels were set at P < 0·05.
Results
Altered proportion and function of CD4+ Tregs and Bregs in B7‐2–/– NOD mice
B7‐2–/– NOD mice usually start to develop progressive limb weakness ∼ 6 months of age. By 8 months, 100% of female B7‐2–/– NOD mice would exhibit clinical and electrophysiological findings of SAP 17. In contrast, the incidence of SAP was lower in male B7‐2–/– NOD mice (Fig. 1a,b). Flow cytometry was performed to investigate whether the development of SAP correlates with changes in the frequency/number of CD4+ Tregs and Bregs in the spleen and peripheral LN (inguinal and axillary). Compared to the female WT NOD mice, there was a decrease in %CD4+ Tregs in the spleen and LN of female B7‐2–/– NOD mice at 8 months, while a reduction was noted only in the LN, but not in the spleen of male B7‐2–/– NOD mice (Fig. 1c). In comparison, the percentage of Bregs was decreased in the spleen and LN of both female and male B7‐2–/– NOD mice (Fig. 1d). However, the calculated number of Tregs and Bregs was reduced only in female but not in male B7‐2–/– NOD mice due to a slightly higher number of total splenocytes and LN cells from the latter. There was no difference in the % CD4+ T cells or CD19+ B cells among the three groups (data not shown). In subsequent experiments, only female B7‐2–/– and WT NOD mice were used.
Figure 1.
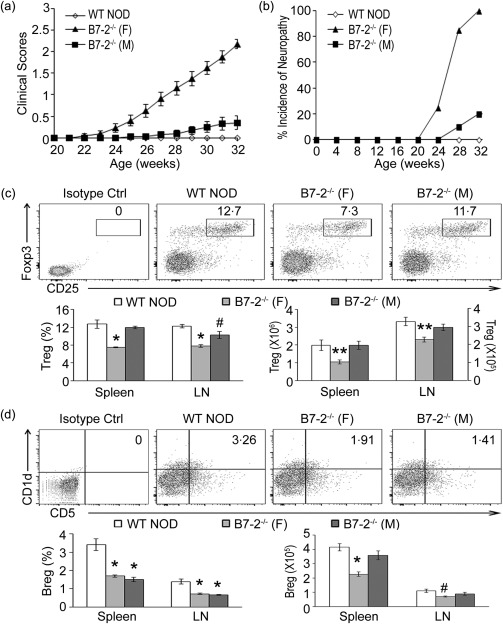
Lower frequency and number of regulatory T cells (Tregs) and regulatory B cells (Bregs) in female B7‐2–/– non‐obese diabetic (NOD) mice compared to wild‐type (WT) NOD mice. (a,b) Clinical severity and incidence of spontaneous autoimmune polyneuropathy (SAP) in female versus male B7‐2–/– NOD mice (n = 20 for each group). (c). Examples of scatterplots showing decreased percentage of splenic CD4+ Treg [CD25+forkhead box protein 3 (FoxP3)+/CD4+ T cells] in 8‐month‐old female B7‐2–/– NOD mice but not in male B7‐2–/– NOD mice. Total splenocytes or lymph node (LN) cells were gated on lymphocytes, followed by gating on CD4, and subsequent analysis for CD25 and FoxP3 expression. Lower panel: bar graphs indicate mean ± standard error of the mean (s.e.m.) percentage and number of CD4+ Tregs in spleen and LN. *P < 0·0005, #P < 0·03; **P <0·01 (n = 6). (d) Examples of scatterplots showing decreased percentage of splenic Bregs (CD1dhiCD5+/CD19+ B cells) in both female and male B7‐2‐–/– NOD mice (8 months). Total splenocytes or LN cells were gated on lymphocytes, followed by gating on CD19 and subsequent analysis of CD1d and CD5 expression. Lower panel: bar graphs indicate mean ± s.e.m. percentage and number of Bregs in spleen and LN. *P < 0·002; #P < 0·02 (n = 8–9 for %Breg, and n = 3–4 for Breg number).
We examined the ability of CD4+ Tregs to suppress T cell proliferation at varying Treg‐CD4+ T cell ratios (1 : 20, 1 : 5, 1 : 1). As shown in Fig. 2a, CD4+ Tregs from 3‐month‐old WT and B7‐2–/– NOD mice were equally effective in inhibiting the proliferation of effector T cells (CD4+CD25– T cells from symptomatic SAP mice) in the presence of 20 µg/ml P0 (190–199). In contrast to Tregs, Bregs had no effect on T cell proliferation when cultured at a 1 : 1 ratio (Fig. 2b).
Figure 2.
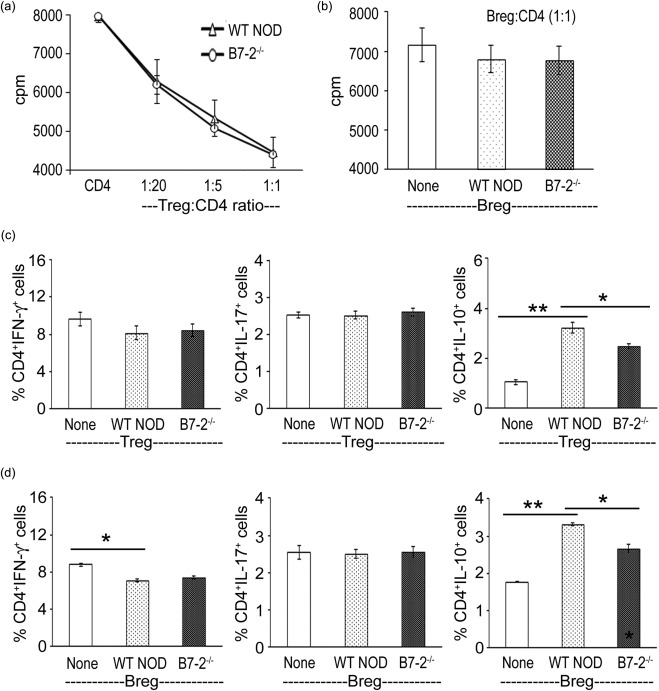
Effect of CD4+ regulatory T cells (Tregs) and regulatory B cells (Bregs) on T cell function in vitro. (a) Wild‐type (WT) and B7‐2–/– Tregs suppressed T cell proliferation with similar efficacy in vitro. CD4+CD25+ Tregs from 3‐month‐old female mice were co‐cultured with CD4+CD25– T cells from spontaneous autoimmune polyneuropathy (SAP) mice (8 months) in the presence of 20 μg/ml P0 (180–189) and irradiated antigen‐presenting cells (APCs) (50 000) for 3 days. Proliferation was measured by [3H]‐thymidine incorporation (n = 3). (b) WT and B7‐2–/– Bregs (CD19+CD1dhi CD5+) did not suppress the proliferation of CD4+CD25– T cells at a 1 : 1 ratio (n = 3). (c) WT and B7‐2–/– Tregs had no effect on CD4+interferon (IFN)‐γ or CD4+interleukin (IL)−17+ cells, but increased the percentage of CD4+IL‐10+ T cells in co‐cultures. Experimental conditions were the same as in (a), except that Tregs were obtained from WT or B7‐2–/– NOD mice killed at 10 days post‐immunization with P0 (180–199). Treg : CD4 ratio was 1 : 1. *P < 0·02; **P < 0·0005 (n = 3). (d) WT and B7‐2–/– Bregs induced a decrease in CD4+IFN‐γ+ T cells and increase in CD4+IL‐10+ T cells in co‐cultures. Bregs sorted from immunized animals were co‐cultured with CD4+CD25– T cells at a : 1 ratio for 3 days in the presence of P0 (180–199), lipopolysaccharide (LPS) (100 ng/ml) and irradiated antigen‐presenting cells (APCs) (50 000). *P < 0·002; **P < 0·0001 (n = 3).
To increase the proportion of antigen‐specific Tregs and Bregs for T cell cytokine experiments, Tregs and Bregs were sorted from splenocytes and LN cells of WT or B7‐2–/– NOD mice (2 months) at day 10 post‐immunization with P0 (180–199). At a 1 : 1 Treg : CD4 ratio, Tregs had no effect on CD4+IFN‐γ+ or CD4+IL‐17+ T cells, but induced an increase in CD4+IL‐10+ T cells, albeit to a lesser extent by B7‐2–/– Tregs compared to WT Tregs (Fig. 2c). In comparison, both WT and B7‐2–/– Bregs induced a decrease in CD4+IFN‐γ+ T cells and an increase in CD4+IL‐10+ T cells; the latter to a lesser extent by B7‐2–/– Bregs compared to WT Bregs. The percentage of CD4+IL‐17+ cells was not affected by the presence of Bregs in co‐cultures (Fig. 2d). Thus, Tregs and Bregs from B7‐2–/– NOD mice were less effective than those from WT NOD mice in inducing or maintaining CD4+IL‐10+ T cells.
Efficacy of Tregs and Bregs at controlling early and late phases of SAP
To investigate the in‐vivo effects of CD4+ Tregs, we utilized Foxp3‐eGFP‐Cre NOD mice as the source of CD4+FoxP3+ (eGFP+) and CD4+FoxP3– (eGFP–) T cells. Splenic CD4+eGFP+ cells were first confirmed to be > 95% FoxP3+ by flow cytometry (data not shown). Foxp3‐eGFP‐Cre NOD mice immunized with P0 (200 µg/ml) were used as donor mice, which exhibited mild weakness with a clinical score of 1·5 ± 0·15 (n = 15). At day 20 post‐immunization, animals were euthanized for sorting of Tregs and Bregs from splenocytes and LN cells. We compared the capacity of WT NOD Tregs and Bregs (1 × 10⁶) to suppress SAP in AT experiments. Recipient female B7‐2–/– NOD mice (6 months old) were divided into three groups: group A received PBS injections (no AT); group B received Tregs (CD4+eGFP+) designated as Treg (AT); and group C received CD4+eGFP– cells, designated as CD4+eGFP– (AT). Clinical assessment (clinical score and grip strength measurements) revealed that the progression of SAP was halted by AT of Tregs, but not by CD4+eGFP– T cells (Fig. 3a). Clinical stabilization was confirmed by electrophysiological studies showing dramatic improvement in distal latencies, conduction velocities and distal amplitudes of sciatic motor response (Fig. 3a). In contrast to Tregs, AT of Bregs did not suppress disease in recipient SAP mice (n = 5) (Supporting information, Fig. S1).
Figure 3.
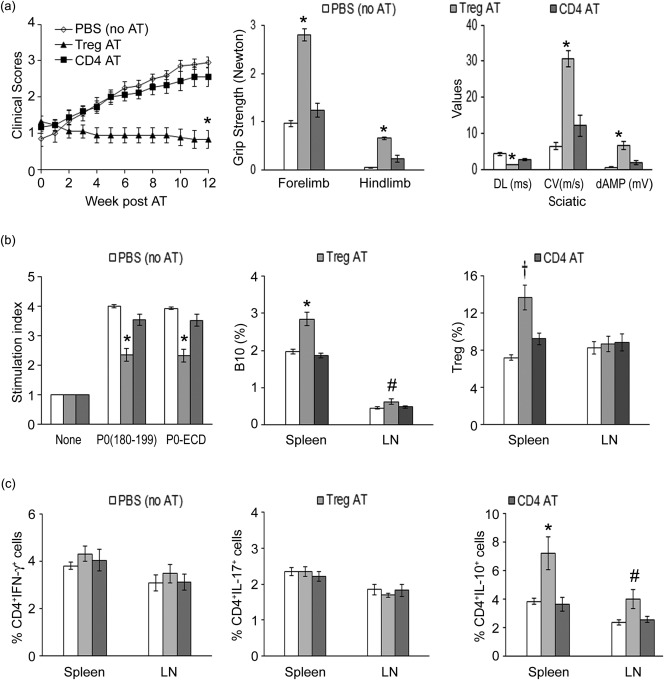
Suppression of spontaneous autoimmune polyneuropathy (SAP) by adoptive transfer (AT) of wild‐type CD4+ regulatory T cells (Treg) into symptomatic B7‐2–/– non‐obese diabetic mice (NOD) mice. (a) Clinical severity. CD4+ enhanced green fluorescent protein (eGFP+) (Treg) and CD4+eGFP– cells were sorted from splenocytes and LN cells of 2‐month‐old forkhead box protein 3 (FoxP3)‐eGFP‐Cre NOD mice at day 20 post‐immunization with P0 (200 μg). Recipient mice (6‐month‐old female B7‐2–/– NOD mice) were injected with 1 × 10⁶ sorted cells via tail vein. Comparing Treg (AT) versus CD4+eGFP– (AT) or phosphate‐buffered saline (PBS) (no AT), *P < 0·0002 (n = 9‐10) for clinical scores (left panel), grip strength measurements (middle panel) and all parameters of sciatic motor responses (right panel). DL = distal latency; CV = conduction velocity; dAMP = distal amplitude. Grip strength measurements and sciatic nerve electrophysiology were performed at 12 weeks post‐AT. (b) Splenocyte proliferation, B10 cells and Tregs at 12 weeks post‐AT. Left panel: splenocyte proliferation based on [3H]‐thymidine incorporation. (Antigen): 20 μg/ml; treatment duration: 72 h. *P < 0·0005 (n = 9–10) comparing Treg (AT) versus the other two groups. Middle panel: B10 cells. *P < 0·0005 for splenic B10 cells; #P < 0·05 for LN B10 cells (n = 6). Right panel: Tregs. †P < 0·008 (n = 6) for splenic Tregs. (c) T cell cytokine profile at 12 weeks post‐AT. Comparing Treg (AT) versus the other two groups, *P < 0·01 for splenic CD4+IL‐10+ cells and # P < 0·04 for LN CD4+IL‐10+ cells (n = 6).
Animals from AT experiments were euthanized at 12 weeks post‐transfer (∼9 months of age) for immunological studies. Splenocyte proliferation‐induced by 20 µg/ml P0 (180–199) or P0‐ECD was decreased in Treg (AT) group compared to the other two groups. This was accompanied by increased B10 cells (CD19+IL10+) in the spleen and LN, and increased Tregs in the spleen of animals in Treg (AT) group (Fig. 3b). There was no difference in the percentage of CD4+IFN‐γ+ T cells or CD4+IL‐17+ T cells among these three groups. However, there was an increase in CD4+IL‐10+ T cells in the spleen and LN from the Treg (AT) group (Fig. 3c).
Given that Bregs did not suppress SAP when AT was performed after disease onset, we examined whether transfer of these cells before the onset of symptoms would prevent the development of SAP or attenuate disease severity. Recipient B7‐2–/– NOD mice (5 months old) were divided into three groups: group A received PBS injections (no AT); group B received Bregs (CD19+CD1dhiCD5+), designated as Breg (AT); and group C received CD19+CD1d–CD5– cells, designated as non‐Breg (AT). As shown in Fig. 4a, AT of Bregs at 5 months could attenuate the disease severity based on clinical scores, grip strength measurements and electrophysiological parameters. In the Breg AT group, there was attenuated antigen‐specific splenocyte proliferation, increased percentages of both B10 cells and Tregs in the spleen and LN of recipient mice. There was no difference in the percentage of CD4+IFN‐γ+ T cells or CD4+IL‐17+ T cells among these three groups. However, there was an increase in CD4+IL‐10+ T cells in the spleen and LN of Breg (AT) group, but not in the other two groups.
Figure 4.
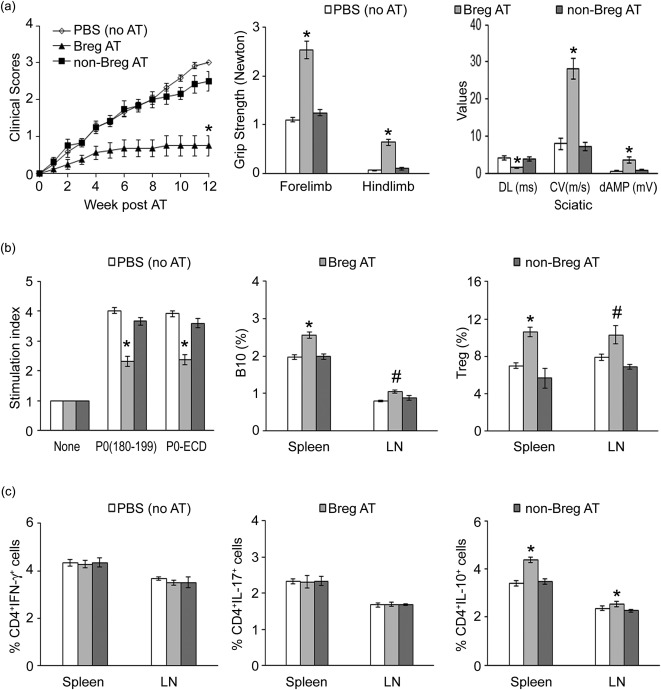
Prevention of spontaneous autoimmune polyneuropathy (SAP) by adoptive transfer (AT) of wild‐type regulatory B cells (Breg) into asymptomatic B7‐2–/– non‐obese diabetic (NOD) mice. (a) Clinical severity. Bregs (CD19+CD1dhiCD5+) and non‐Bregs (CD19+CD1d–CD5–) were sorted from splenocytes and lymph node (LN) cells of 2‐month‐old WT NOD mice at day 20 post‐immunization with P0 (200 μg), and 1 × 10⁶ sorted cells were injected via tail vein into 5‐month‐old female B7‐2–/– NOD mice. Comparing Breg (AT) versus non‐Breg (AT) or phosphate‐buffered saline (PBS) (no AT), *P < 0·0005 (n = 6–8) for clinical scores (left panel), grip strength measurements (middle panel) and all the parameters of sciatic motor responses. (b) Splenocyte proliferation, B10 cells and regulatory T cells (Tregs) at 12 weeks post‐AT. Left panel: splenocyte proliferation based on [3H]‐thymidine incorporation. [Ag]: 20 μg/ml; treatment duration: 72 h. *P < 0·0002 (n = 6–8). Middle panel: B10 cells. *P < 0·0002 for splenic B10 cells; #P < 0·03 for LN B10 cells (n = 6). Right panel: Tregs. *P < 0·0002 for splenic Tregs, #P < 0·03 for LN Treg cells (n = 6). (c) T cell cytokine profile at 12 weeks post‐AT. *P < 0·0001 (n = 6) for spleen and LN CD4+IL‐10+ cells.
To determine whether a positive regulatory or a negative regulatory role of B cells predominates in SAP, we compared the severity of neuropathy in B7‐2–/– versus muMT/B7‐2–/– NOD mice. Homozygous muMT mice lack mature B cells due to disruption of the gene encoding the heavy chain immunoglobulin (Ig)M 25. Figure 5a confirms the absence of B cells (CD19+) and IgM in muMT/B7‐2–/– NOD mice. The latter exhibited a slightly higher frequency of CD4+ Tregs in the spleen and LN compared to B7‐2–/– NOD mice (Fig. 5b). CD4+ Tregs from muMT/B7‐2–/– mice were as effective as those from B7‐2–/– mice in suppressing the proliferation of effector T cells from SAP mice (Fig. 5c). In addition, they were slightly more potent in shifting the cytokine profile from Th1 to CD4+IL10+ cells in co‐cultures (Fig. 5d). As depicted in Fig. 5e, the lack of mature B cells prevented the development of SAP. Electrophysiological studies showed markedly improved conduction parameters, although a mild slowing of conduction velocity (CV) was still observed (Fig. 5f). These findings suggest that the pathogenic role of B cells predominates over its negative regulatory role in SAP, and that lack of B cells did not inhibit the generation or function of Tregs.
Figure 5.
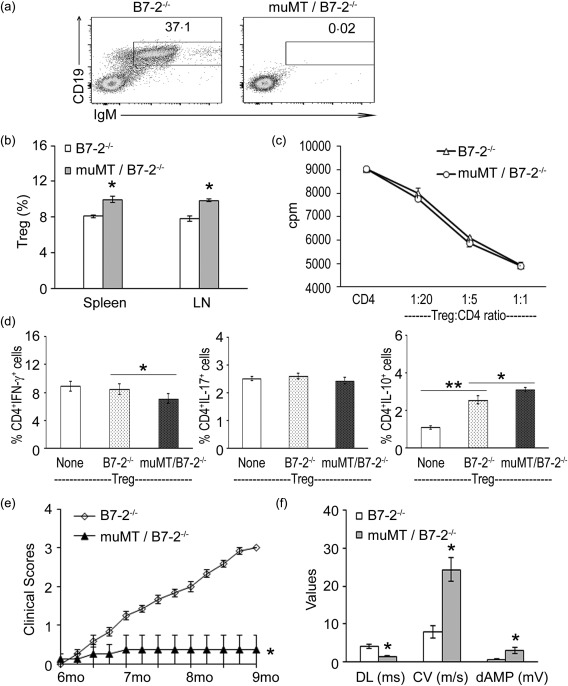
Absence of B cells inhibits the development of spontaneous autoimmune polyneuropathy (SAP). (a) Examples of scatterplots confirming the lack of B cells [CD19+immunoglobulin (Ig)M+] in B cell‐deficient (muMT)/B7‐2–/– non‐obese diabetic (NOD) mice. (b) Modest increase in the frequency of Tregs in muMT/B7‐2–/– mice compared to that from B7‐2–/– NOD mice. *P < 0·001 (n = 3). (c) Tregs from B7‐2–/– and muMT/B7‐2–/– mice suppressed T cell proliferation with similar efficacy in vitro (n = 3). Experimental conditions were as described in Fig. 2a. (d) Tregs from muMT/B7‐2–/– mice decreased the percentage of CD4+interferon (IFN)‐γ T cells, and led to a greater increase in the percentage of CD4+interleukin (IL)−10+ T cells in co‐cultures when compared to Tregs from B7‐2–/– mice. *P < 0·02 and **P < 0·002 (n = 3). Experimental conditions were as described in Fig. 2c. (e) Clinical severity.*P < 0·00001 for B7‐2–/– versus muMT/B7‐2–/–. (f). Sciatic nerve electrophysiology. *P < 0·003 for all parameters comparing B7‐2 KO versus muMT (n = 5–6).
Discussion
B7‐2–/– NOD mice exhibit enhanced autoreactivity to myelin P0 starting at 4 months, yet they do not develop weakness till ∼6 months of age. The delayed onset suggests that the initial expansion of P0‐reactive T cells is kept in check by regulatory mechanisms. The high incidence of SAP in female B7‐2–/– NOD mice is associated with decreased frequency and number of Tregs and Bregs in the spleen and LN. In male B7‐2–/– NOD mice, the number of Tregs and Bregs was not reduced significantly, as might have been expected from altered frequency of Bregs and LN Tregs. There is some evidence that both sex hormones and microbiota contribute to gender bias in autoimmunity in NOD mice 26. Testosterone treatment induces expansion of Tregs and modulates FoxP3 expression 27. Depletion of Tregs with anti‐CD25 antibody in male B10.S mice prior to immunization with PLP139‐151 results in increased susceptibility to EAE 28. Earlier studies suggest that androgens can also induce immune deviation from a Th1 to a Th2 phenotype 29, 30.
We found that CD4+ Tregs but not Bregs suppressed T cell proliferation induced by myelin P0 (180–199). Conversely, Bregs were more effective than Tregs in attenuating the Th1 cytokine response, while both of them can induce an increase in CD4+IL‐10+cells in co‐cultures. In‐vitro data indicate that the absence of B7‐2 did not affect function of Tregs or Bregs in most assays except for diminished capacity to induce CD4+IL‐10+ cells. IL‐10 production in T cells is not limited to Tregs, Th2 cells and Tr1 cells, as Th1 and Th17 cells may produce IL‐10 under certain circumstances as part of a negative feedback regulation of CD4+ effector response 31. Our findings on Tregs in B7‐2–/– NOD mice are in agreement with those reported by other investigators 32. It is well‐recognized that the B7‐1/B7‐2:CD28/CTLA4 pathway plays a crucial role not only for optimal T cell activation but also for the homeostasis of Tregs 33, 34. B7‐1 and B7‐2 contribute equally to the development of Tregs in the thymus, whereas B7‐2 appears more important than B7‐1 in regulating the peripheral homeostasis of Tregs 35. Whether B7 molecules are required for the generation of Bregs has not been as well investigated. One study reported that addition of B7‐1/B7‐2 blocking antibodies decreases the number of IL‐10 producing B cells in co‐cultures with primed myelin antigen‐specific T cells lines, although the effect is not as robust as blocking the inducible co‐stimulatory–inducible co‐stimulatory ligand (ICOS–ICOSL) pathway 36. Our finding that the frequency and number of Bregs is lower in the spleen and LN of female B7‐2–/– NOD mice compared to WT mice suggests that B7‐2 is important for the generation or maintenance of Bregs, although the exact mechanism remains to be determined.
We found that SAP can be suppressed by AT of CD4+ Tregs from mice immunized with P0. This therapeutic effect was associated with decreased antigen‐specific splenocyte proliferation and with increased frequencies of B10 cells, CD4+IL‐10+ cells and splenic CD4+ Tregs. There were no changes in the frequencies of Th1 or Th17 cells in recipient mice. The role of Tregs has been demonstrated in EAE and EAN, where recovery correlates with the accumulation of Tregs within the CNS and sciatic nerves, respectively 15, 37. Depletion of CD25+ Tregs inhibits the recovery, while AT of Tregs attenuates the disease severity and promotes recovery in EAE, which is IL‐10‐dependent 14, 37, 38, 39. Early depletion but not late depletion of Tregs with anti‐CD25 antibodies leads to deterioration of EAN in SJL mice and adoptive transferred neuritis 16. That progression of SAP can be halted by transfer of Tregs after disease onset in our study would support the concept that the number of Tregs could determine whether inflammatory neuropathy would become chronic/progressive or monophasic with recovery. Reduced levels or impaired function of Tregs have been reported in Guillain‐Barré syndrome (GBS) and CIDP, with improvement upon treatment with intravenous gammaglobulin noted in one GBS study 40, 41, 42, 43.
Whether there is altered number or function of Bregs in GBS, CIDP or EAN has not been studied systematically. In experimental models, the regulatory role of B cells was supported by data showing failure of recovery from EAE in B cell‐deficient mice, in mice with IL‐10–/– B cells, or upon B cell depletion with anti‐CD20 antibody prior to EAE induction 44, 45, 46, 47. Whether Bregs can prevent or suppress disease may vary depending on the experimental model. We found that Bregs prevent but do not suppress SAP, which is in agreement with work by other investigators showing that Bregs control the initiation but not the late phase of EAE 11. Conversely, Bregs are capable of preventing and suppressing experimental autoimmune myasthenia gravis (EAMG), which may be due partly to its ability to suppress anti‐AChR antibody production by B cells 48.
We found that AT of Tregs or Bregs into recipient mice led to expansion of both regulatory cell types. Whether the homeostasis or activation of Tregs and Bregs is influenced by each other has been an area of intense research. There is some evidence that CD4+ Tregs induce and maintain B10 cells in vitro via CD5–CD72 interaction 49. Conversely, some studies support the concept that Bregs are necessary for the generation and/or protective function of Tregs 50, 51, 52. The regulatory function of B cells has been attributed to B7 molecules or to glucocorticoid‐induced TNF receptor (TNFR) ligand 53, 54, 55. Other studies revealed that B cells are not necessary for Treg proliferation and accumulation in the CNS or for its suppressive function during EAE, in spite of lower frequency of CD103– Tregs in secondary lymphoid organs in B cell‐deficient mice 56. We found that the absence of B cells did not hamper the generation or maintenance of CD4+ Tregs in NOD mice. To the contrary, there was a slightly higher frequency of CD4+ Tregs in muMT/B7‐2–/– NOD mice compared to B7‐2–/– NOD mice. In vitro, CD4+ Tregs from muMT/B7‐2–/– NOD mice exhibited a greater capacity to shift cytokine profile from Th1 to CD4+IL‐10+ T cells compared to those from B7‐2–/– NOD cells, while both were equally effective in suppressing proliferation of SAP effector T cells.
That muMT/B7‐2–/– NOD mice are protected against SAP is consistent with our data from B cell depletion with anti‐CD19 antibody 24. These findings indicate that B cells are critical APCs required for optimal stimulation of P0‐reactive T cells. B cell‐deficient mice are resistant to most, if not all, spontaneous autoimmune diseases such as diabetes or thyroiditis 57, 58, 59. However, diabetes and thyroiditis can be induced in these mice by transient depletion of Tregs with anti‐CD25 antibody, suggesting that Tregs control autoimmunity in the absence of B cells 59, 60. Recent studies revealed that Tregs from B cell‐deficient mice and WT mice differ in their immunophenotypical properties, with the former being more effective at suppressing spontaneous autoimmune thyroiditis 61.
In summary, we found that: (1) lower frequency and number of both Tregs and Bregs were observed consistently in female B7‐2–/– NOD mice, but less so in males; (2) Tregs and Bregs from B7‐2–/– mice were less effective than those from WT mice in the induction or maintenance of CD4+IL‐10+ cells; and (3) Tregs but not Bregs suppressed SAP when transferred after disease onset; however, Bregs were effective in controlling the early or initiation phase. These findings highlight the crucial role of Bregs and Tregs in maintaining immune homeostasis in SAP. Therapies aimed at expansion of these regulatory lymphocytes could be an effective approach in inflammatory neuropathies and other autoimmune diseases.
Disclosure
The authors do not have any disclosures to declare.
Supporting information
Fig. S1. Adoptive transfer of regulatory B cells (Bregs) after symptom onset did not attenuate the severity of spontaneous autoimmune polyneuropathy (SAP). Female B7‐2–/– non‐obese diabetic (NOD) mice (6 months old) were injected intravenously with 1 × 10⁶ sorted wild‐type (WT) Bregs or non‐Bregs (n = 5). (a) Clinical scores. (b) Grip strength measurements.
Acknowledgements
This work was supported by National Institute of Health Grant R01 NS064059 to B. Soliven and by a pilot grant from the GBS/CIDP Foundation International. We would like thank Danuta Dukala for her assistance in the early stage of the project. S. Q. designed and performed most of the experiments, J. R. S. and P. M. A. participated in some studies, B. S. supervised the study and wrote the paper together with S. Q.
References
- 1. Shevach EM. From vanilla to 28 flavors: multiple varieties of T regulatory cells. Immunity 2006; 25:195–201. [DOI] [PubMed] [Google Scholar]
- 2. Sakaguchi S, Sakaguchi N, Asano M, Itoh M, Toda M. Immunologic self‐tolerance maintained by activated T cells expressing IL‐2 receptor alpha‐chains (CD25). Breakdown of a single mechanism of self‐tolerance causes various autoimmune diseases. J Immunol 1995; 155:1151–64. [PubMed] [Google Scholar]
- 3. Fontenot JD, Gavin MA, Rudensky AY. Foxp3 programs the development and function of CD4+CD25+ regulatory T cells. Nat Immunol 2003; 4:330–6. [DOI] [PubMed] [Google Scholar]
- 4. Khattri R, Cox T, Yasayko SA, Ramsdell F. An essential role for Scurfin in CD4+CD25+ T regulatory cells. Nat Immunol 2003; 4:337–42. [DOI] [PubMed] [Google Scholar]
- 5. Hori S, Nomura T, Sakaguchi S. Control of regulatory T cell development by the transcription factor Foxp3. Science 2003; 299:1057–61. [DOI] [PubMed] [Google Scholar]
- 6. Yanaba K, Bouaziz JD, Haas KM, Poe JC, Fujimoto M, Tedder TF. A regulatory B cell subset with a unique CD1dhiCD5+ phenotype controls T cell‐dependent inflammatory responses. Immunity 2008; 28:639–50. [DOI] [PubMed] [Google Scholar]
- 7. Mauri C, Bosma A. Immune regulatory function of B cells. Annu Rev Immunol 2012; 30:221–41. [DOI] [PubMed] [Google Scholar]
- 8. Vignali DA, Collison LW, Workman CJ. How regulatory T cells work. Nat Rev Immunol 2008; 8:523–32. [DOI] [PMC free article] [PubMed] [Google Scholar]
- 9. Sun CM, Deriaud E, Leclerc C, Lo‐Man R. Upon TLR9 signaling, CD5+ B cells control the IL‐12‐dependent Th1‐priming capacity of neonatal DCs. Immunity 2005; 22:467–77. [DOI] [PubMed] [Google Scholar]
- 10. Carter NA, Rosser EC, Mauri C. Interleukin‐10 produced by B cells is crucial for the suppression of Th17/Th1 responses, induction of T regulatory type 1 cells and reduction of collagen‐induced arthritis. Arthritis Res Ther 2012; 14:R32. [DOI] [PMC free article] [PubMed] [Google Scholar]
- 11. Matsushita T, Horikawa M, Iwata Y, Tedder TF. Regulatory B cells (B10 cells) and regulatory T cells have independent roles in controlling experimental autoimmune encephalomyelitis initiation and late‐phase immunopathogenesis. J Immunol 2010; 185:2240–52. [DOI] [PMC free article] [PubMed] [Google Scholar]
- 12. Yoshizaki A, Miyagaki T, DiLillo DJ et al Regulatory B cells control T‐cell autoimmunity through IL‐21‐dependent cognate interactions. Nature 2012; 491:264–68. [DOI] [PMC free article] [PubMed] [Google Scholar]
- 13. Rosser EC, Mauri C. Regulatory B cells: origin, phenotype, and function. Immunity 2015; 42:607–12. [DOI] [PubMed] [Google Scholar]
- 14. Kohm AP, Carpentier PA, Anger HA, Miller SD. Cutting edge: CD4+CD25+ regulatory T cells suppress antigen‐specific autoreactive immune responses and central nervous system inflammation during active experimental autoimmune encephalomyelitis. J Immunol 2002; 169:4712–6. [DOI] [PubMed] [Google Scholar]
- 15. Zhang Z, Zhang ZY, Fauser U, Schluesener HJ. Distribution of Foxp3(+) T‐regulatory cells in experimental autoimmune neuritis rats. Exp Neurol 2009; 216:75–82. [DOI] [PubMed] [Google Scholar]
- 16. Meyer zu Horste G, Cordes S, Mausberg AK et al FoxP3+ regulatory T cells determine disease severity in rodent models of inflammatory neuropathies. PLOS ONE 2014; 9:e108756. [DOI] [PMC free article] [PubMed] [Google Scholar]
- 17. Salomon B, Rhee L, Bour‐Jordan H et al Development of spontaneous autoimmune peripheral polyneuropathy in B7‐2‐deficient NOD mice. J Exp Med 2001; 194:677–84. [DOI] [PMC free article] [PubMed] [Google Scholar]
- 18. Yadav D, Judkowski V, Flodstrom‐Tullberg M et al B7‐2 (CD86) controls the priming of autoreactive CD4 T cell response against pancreatic islets. J Immunol 2004; 173:3631–9. [DOI] [PubMed] [Google Scholar]
- 19. Bour‐Jordan H, Thompson HL, Bluestone JA. Distinct effector mechanisms in the development of autoimmune neuropathy versus diabetes in nonobese diabetic mice. J Immunol 2005; 175:5649–55. [DOI] [PubMed] [Google Scholar]
- 20. Kim HJ, Jung CG, Jensen MA, Dukala D, Soliven B. Targeting of myelin protein zero in a spontaneous autoimmune polyneuropathy. J Immunol 2008; 181:8753–60. [DOI] [PMC free article] [PubMed] [Google Scholar]
- 21. Louvet C, Kabre BG, Davini DW et al A novel myelin P0‐specific T cell receptor transgenic mouse develops a fulminant autoimmune peripheral neuropathy. J Exp Med 2009; 206:507–14. [DOI] [PMC free article] [PubMed] [Google Scholar]
- 22. Quan S, Kim HJ, Dukala D, Sheng JR, Soliven B. Impaired dendritic cell function in a spontaneous autoimmune polyneuropathy. J Immunol 2015; 194:4175–84. [DOI] [PMC free article] [PubMed] [Google Scholar]
- 23. Kim HJ, Jung CG, Dukala D et al. Fingolimod and related compounds in a spontaneous autoimmune polyneuropathy. J Neuroimmunol 2009; 214:93–100. [DOI] [PMC free article] [PubMed] [Google Scholar]
- 24. Abraham PM, Quan S, Dukala D, Soliven B. CD19 as a therapeutic target in a spontaneous autoimmune polyneuropathy. Clin Exp Immunol 2014; 175:181–91. [DOI] [PMC free article] [PubMed] [Google Scholar]
- 25. Kitamura D, Roes J, Kuhn R, Rajewsky K. A B cell‐deficient mouse by targeted disruption of the membrane exon of the immunoglobulin mu chain gene. Nature 1991; 350:423–6. [DOI] [PubMed] [Google Scholar]
- 26. Yurkovetskiy L, Burrows M, Khan AA et al Gender bias in autoimmunity is influenced by microbiota. Immunity 2013; 39:400–12. [DOI] [PMC free article] [PubMed] [Google Scholar]
- 27. Walecki M, Eisel F, Klug J et al Androgen receptor modulates Foxp3 expression in CD4+CD25+Foxp3+ regulatory T‐cells. Mol Biol Cell 2015; 26:2845–57. [DOI] [PMC free article] [PubMed] [Google Scholar]
- 28. Reddy J, Waldner H, Zhang X et al. Cutting edge: CD4+CD25+ regulatory T cells contribute to gender differences in susceptibility to experimental autoimmune encephalomyelitis. J Immunol 2005; 175:5591–5. [DOI] [PubMed] [Google Scholar]
- 29. Bebo BF Jr, Schuster JC, Vandenbark AA, Offner H. Androgens alter the cytokine profile and reduce encephalitogenicity of myelin‐reactive T cells. J Immunol 1999; 162:35–40. [PubMed] [Google Scholar]
- 30. Liva SM, Voskuhl RR. Testosterone acts directly on CD4+ T lymphocytes to increase IL‐10 production. J Immunol 2001; 167:2060–7. [DOI] [PubMed] [Google Scholar]
- 31. Ng TH, Britton GJ, Hill EV, Verhagen J, Burton BR, Wraith DC. Regulation of adaptive immunity; the role of interleukin‐10. Front Immunol 2013; 4:129. [DOI] [PMC free article] [PubMed] [Google Scholar]
- 32. Bour‐Jordan H, Salomon BL, Thompson HL, Szot GL, Bernhard MR, Bluestone JA. Costimulation controls diabetes by altering the balance of pathogenic and regulatory T cells. J Clin Invest 2004; 114:979–87. [DOI] [PMC free article] [PubMed] [Google Scholar]
- 33. Sharpe AH, Freeman GJ. The B7‐CD28 superfamily. Nat Rev Immunol 2002; 2:116–26. [DOI] [PubMed] [Google Scholar]
- 34. Salomon B, Lenschow DJ, Rhee L et al B7/CD28 costimulation is essential for the homeostasis of the CD4+CD25+ immunoregulatory T cells that control autoimmune diabetes. Immunity 2000; 12:431–40. [DOI] [PubMed] [Google Scholar]
- 35. Zeng M, Guinet E, Nouri‐Shirazi M. B7‐1 and B7‐2 differentially control peripheral homeostasis of CD4(+)CD25(+)Foxp3(+) regulatory T cells. Transpl Immunol 2009; 20:171–9. [DOI] [PubMed] [Google Scholar]
- 36. Correale J, Farez M, Razzitte G. Helminth infections associated with multiple sclerosis induce regulatory B cells. Ann Neurol 2008; 64:187–99. [DOI] [PubMed] [Google Scholar]
- 37. McGeachy MJ, Stephens LA, Anderton SM. Natural recovery and protection from autoimmune encephalomyelitis: contribution of CD4+CD25+ regulatory cells within the central nervous system. J Immunol 2005; 175:3025–32. [DOI] [PubMed] [Google Scholar]
- 38. Zhang X, Koldzic DN, Izikson L et al IL‐10 is involved in the suppression of experimental autoimmune encephalomyelitis by CD25+CD4+ regulatory T cells. Int Immunol 2004; 16:249–56. [DOI] [PubMed] [Google Scholar]
- 39. Furtado GC, Olivares‐Villagomez D, Curotto de Lafaille MA, Wensky AK, Latkowski JA, Lafaille JJ. Regulatory T cells in spontaneous autoimmune encephalomyelitis. Immunol Rev 2001; 182:122–34. [DOI] [PubMed] [Google Scholar]
- 40. Pritchard J, Makowska A, Gregson NA, Hayday AC, Hughes RA. Reduced circulating CD4+CD25+ cell populations in Guillain‐Barre syndrome. J Neuroimmunol 2007; 183:232–8. [DOI] [PubMed] [Google Scholar]
- 41. Harness J, McCombe PA. Increased levels of activated T‐cells and reduced levels of CD4/CD25+ cells in peripheral blood of Guillain–Barre syndrome patients compared to controls. J Clin Neurosci 2008; 15:1031–5. [DOI] [PubMed] [Google Scholar]
- 42. Chi LJ, Wang HB, Zhang Y, Wang WZ. Abnormality of circulating CD4(+)CD25(+) regulatory T cell in patients with Guillain‐Barre syndrome. J Neuroimmunol 2007; 192:206–14. [DOI] [PubMed] [Google Scholar]
- 43. Chi LJ, Wang HB, Wang WZ. Impairment of circulating CD4+CD25+ regulatory T cells in patients with chronic inflammatory demyelinating polyradiculoneuropathy. J Peripher Nerv Syst 2008; 13:54–63. [DOI] [PubMed] [Google Scholar]
- 44. Wolf SD, Dittel BN, Hardardottir F, Janeway CA Jr. Experimental autoimmune encephalomyelitis induction in genetically B cell‐deficient mice. J Exp Med 1996; 184:2271–8. [DOI] [PMC free article] [PubMed] [Google Scholar]
- 45. Fillatreau S, Sweenie CH, McGeachy MJ, Gray D, Anderton SM. B cells regulate autoimmunity by provision of IL‐10. Nat Immunol 2002; 3:944–50. [DOI] [PubMed] [Google Scholar]
- 46. Matsushita T, Yanaba K, Bouaziz JD, Fujimoto M, Tedder TF. Regulatory B cells inhibit EAE initiation in mice while other B cells promote disease progression. J Clin Invest 2008; 118:3420–30. [DOI] [PMC free article] [PubMed] [Google Scholar]
- 47. Weber MS, Prod'homme T, Patarroyo JC et al Bcell activation influences T‐cell polarization and outcome of anti‐CD20 B‐cell depletion in central nervous system autoimmunity. Ann Neurol 2010; 68:369–83. [DOI] [PMC free article] [PubMed] [Google Scholar]
- 48. Sheng JR, Quan S, Soliven B. CD1d(hi)CD5+ B cells expanded by GM‐CSF in vivo suppress experimental autoimmune myasthenia gravis. J Immunol 2014; 193:2669–77. [DOI] [PMC free article] [PubMed] [Google Scholar]
- 49. Zheng M, Xing C, Xiao H et al Interaction of CD5 and CD72 is involved in regulatory T and B cell homeostasis. Immunol Invest 2014; 43:705–16. [DOI] [PubMed] [Google Scholar]
- 50. Sun JB, Flach CF, Czerkinsky C, Holmgren J. B lymphocytes promote expansion of regulatory T cells in oral tolerance: powerful induction by antigen coupled to cholera toxin B subunit. J Immunol 2008; 181:8278–87. [DOI] [PubMed] [Google Scholar]
- 51. Amu S, Saunders SP, Kronenberg M, Mangan NE, Atzberger A, Fallon PG. Regulatory B cells prevent and reverse allergic airway inflammation via FoxP3‐positive T regulatory cells in a murine model. J Allergy Clin Immunol 2010; 125:1114–24 e8. [DOI] [PubMed] [Google Scholar]
- 52. Carter NA, Vasconcellos R, Rosser EC et al Mice lacking endogenous IL‐10‐producing regulatory B cells develop exacerbated disease and present with an increased frequency of Th1/Th17 but a decrease in regulatory T cells. J Immunol 2011; 186:5569–79. [DOI] [PubMed] [Google Scholar]
- 53. Mann MK, Maresz K, Shriver LP, Tan Y, Dittel BN. B cell regulation of CD4+CD25+ T regulatory cells and IL‐10 via B7 is essential for recovery from experimental autoimmune encephalomyelitis. J Immunol 2007; 178:3447–56. [DOI] [PubMed] [Google Scholar]
- 54. Ray A, Basu S, Williams CB, Salzman NH, Dittel BN. A novel IL‐10‐independent regulatory role for B cells in suppressing autoimmunity by maintenance of regulatory T cells via GITR ligand. J Immunol 2012; 188:3188–98. [DOI] [PMC free article] [PubMed] [Google Scholar]
- 55. Xing C, Ma N, Xiao H et al Critical role for thymic CD19+CD5+CD1dhiIL‐10+ regulatory B cells in immune homeostasis. J Leukoc Biol 2015; 97:547–56. [DOI] [PMC free article] [PubMed] [Google Scholar]
- 56. Hoehlig K, Shen P, Lampropoulou V et al Activation of CD4(+) Foxp3(+) regulatory T cells proceeds normally in the absence of B cells during EAE. Eur J Immunol 2012; 42:1164–73. [DOI] [PubMed] [Google Scholar]
- 57. Serreze DV, Fleming SA, Chapman HD, Richard SD, Leiter EH, Tisch RM. B lymphocytes are critical antigen‐presenting cells for the initiation of T cell‐mediated autoimmune diabetes in nonobese diabetic mice. J Immunol 1998; 161:3912–8. [PubMed] [Google Scholar]
- 58. Greeley SA, Moore DJ, Noorchashm H et al Impaired activation of islet‐reactive CD4 T cells in pancreatic lymph nodes of B cell‐deficient nonobese diabetic mice. J Immunol 2001; 167:4351–7. [DOI] [PubMed] [Google Scholar]
- 59. Ellis JS, Wan X, Braley‐Mullen H. Transient depletion of CD4+ CD25+ regulatory T cells results in multiple autoimmune diseases in wild‐type and B‐cell‐deficient NOD mice. Immunology 2013; 139:179–86. [DOI] [PMC free article] [PubMed] [Google Scholar]
- 60. Marino E, Villanueva J, Walters S, Liuwantara D, Mackay F, Grey ST. CD4(+)CD25(+) T‐cells control autoimmunity in the absence of B‐cells. Diabetes 2009; 58:1568–77. [DOI] [PMC free article] [PubMed] [Google Scholar]
- 61. Ellis JS, Braley‐Mullen H. Regulatory T cells in B‐cell‐deficient and wild‐type mice differ functionally and in expression of cell surface markers. Immunology 2015; 144:598–610. [DOI] [PMC free article] [PubMed] [Google Scholar]
Associated Data
This section collects any data citations, data availability statements, or supplementary materials included in this article.
Supplementary Materials
Fig. S1. Adoptive transfer of regulatory B cells (Bregs) after symptom onset did not attenuate the severity of spontaneous autoimmune polyneuropathy (SAP). Female B7‐2–/– non‐obese diabetic (NOD) mice (6 months old) were injected intravenously with 1 × 10⁶ sorted wild‐type (WT) Bregs or non‐Bregs (n = 5). (a) Clinical scores. (b) Grip strength measurements.