

Abstract
Solid electrolytes with sufficiently high conductivities and stabilities are the elusive answer to the inherent shortcomings of organic liquid electrolytes prevalent in today’s rechargeable batteries. We recently revealed a novel fast-ion-conducting sodium salt, Na2B12H12, which contains large, icosahedral, divalent B12H122− anions that enable impressive superionic conductivity, albeit only above its 529 K phase transition. Its lithium congener, Li2B12H12, possesses an even more technologically prohibitive transition temperature above 600 K. Here we show that the chemically related LiCB11H12 and NaCB11H12 salts, which contain icosahedral, monovalent CB11H12− anions, both exhibit much lower transition temperatures near 400 K and 380 K, respectively, and truly stellar ionic conductivities (> 0.1 S cm−1) unmatched by any other known polycrystalline materials at these temperatures. With proper modifications, we are confident that room-temperature-stabilized superionic salts incorporating such large polyhedral anion building blocks are attainable, thus enhancing their future prospects as practical electrolyte materials in next-generation, all-solid-state batteries.
Graphical abstract
Above their order-disorder transitions, both LiCB11H12 and NaCB11H12 electrolytes exhibit solid-state conductivities easily exceeding 0.1 S cm−1, unmatched by any other known polycrystalline materials at these temperatures.
Introduction
Based on their ability to form entropy-driven, cation- and anion-disordered structures, some complex hydride salts such as LiBH4 and Na2BH4NH2 have been found to exhibit impressive ionic conductivity,1,2 meriting their consideration as technologically useful solid-state electrolytes3,4 and jumpstarting further efforts to find even more promising ionic conductors within this broad class of materials.5 More recently, the disordered phases of polyhedral boron-hydrogen compounds of Na containing the relatively stable dodecahydro-closo-dodecaborate (B12H122−) and decahydro-closo-decaborate (B10H102−) anions have proved to be quite remarkable superionic conductors,6,7,8,9 likely aided in part by the capacious interstitial corridors for cation transport afforded by the sublattice of unusually large quasispherical anions. Indeed, above their respective transition temperatures of ≈529 K and 373 K, Na2B12H12 exhibits a conductivity of 0.1 S cm−1 near 540 K,8 whereas Na2B10H10 exhibits a conductivity of 0.01 S cm−1 near 383 K.9 Both Li2B12H12 and Li2B10H10 have also been shown to undergo similar order-disorder transitions but only at temperatures well above 600 K, and although not yet confirmed, likely also become superionic.6,7,10,11
In spite of such compounds possessing the requisite conductivities for incorporation as electrolytes in next-generation, all-solid-state rechargeable batteries, it is highly desirable from a technology perspective to be able to stabilize the disordered superionic phase closer to or below room temperature, e.g., via tailored chemical modifications that lead to either lower thermodynamically dictated (Ttrans ≈ ΔHtrans/ΔStrans) phase-transition temperatures or a kinetics-inhibited low-temperature trapping of the high-temperature disorder. For instance, Na2B10H10 can be considered as an anion-modified form of Na2B12H12, yielding a smaller transition enthalpy change ΔHtrans and thus a lower Ttrans, assuming a less-compound-dependent (order-disorder) entropy change ΔStrans. Partially substituting Li for Na or halogenating the B12H122− anion has also been shown to change the transition temperature, but in the opposite direction.12 Na2BH4NH2 is one example of a room-temperature fast-ion conductor enabled by a “freezing in” of its high-temperature disordered structure down to low temperatures.2,13 Another related example of trapping is the room-temperature stabilization of the high-temperature superionic disordered Na3PS4 phase by crystallization from glassy Na3PS4.14,15
One obvious chemical modification of potential interest involves the alteration of the B12H122− anion itself. For example, replacing one {B–H} vertex with an isoelectronic {C–H} group yields the structurally similar icosahedral monocarba-closo-dodecaborate anion (CB11H12−; see Fig. 1). The resulting reduced anion valency for CB11H12− compared to B12H122− leads to a halving of the number of monovalent cations required for charge neutrality of the corresponding salt compounds, LiCB11H12 and NaCB11H12. A thorough review of the chemistry of the CB11H12− anion16 suggests that it is a relatively weakly binding and chemically inert anion,17 and indeed it’s potential as a viable liquid electrolyte component for Mg batteries has already been explored.18 Yet information on the properties of its anhydrous salt compounds is generally lacking. One study for CsCB11H12 reported an endothermic transition peak (upon heating) centered at around 564 K by differential scanning calorimetry (DSC) and confirmed a phase change by X-ray powder diffraction (XRPD) to what was suggested to be a high-temperature orthorhombic structure.19 There was no clear evidence as to the nature of this supposedly disordered phase. Yet, based on an analogous structural study of Cs2B12H12 (which exhibits a similar cation/anion size ratio),20 such a phase does not necessarily possess any cation vacancies, which are paramount for fast-ion conduction. In contrast, our previous experience indicates that the formation of cation-vacancy-rich disordered structures with such large anions seems to be more common when the smaller Li+ and Na+ cations are involved.6,9,10 This proclivity likely has something to do with the smaller cations favoring lower cation coordination. 11,12,21,22,23 In particular, the typical interstitial tetrahedral sites formed by the anions are too large for the diminutive Li+ and Na+ cations, forcing them to move laterally from the centers toward one of the four trigonal hollows to maximize their stability. Disorder transitions from these lower-coordination ordered structures tend to be of first-order and involve a dramatic increase in anion orientational mobility, which may further ameliorate the cation translational mobility within the anion sublattice.8,9,24 Hence, the potential effects of the different anion valency and 1:1 cation/anion ratio on Ttrans and ionic conductivity, and the natures of the corresponding ordered and disordered LiCB11H12 and NaCB11H12 structures are intriguing and worthy of exploration.
Fig. 1.

Relative geometries of the B12H122− and CB11H12− anions with boron, carbon, and hydrogen atoms denoted by green, brown, and white spheres, respectively. Numbers indicate the relative Mulliken charges associated with the structurally distinct atoms of the isolated anions as determined by first-principles calculations described in the text.
In this paper, we report our results concerning the structural, dynamical, and conductive properties of LiCB11H12 and NaCB11H12. We have found respective transition temperatures of around 400 K and 380 K, which are substantially lower than those for the analogous Li2B12H12 and Na2B12H12 compounds. At room temperature, LiCB11H12 and NaCB11H12 exhibit ordered orthorhombic structures. Above these transition temperatures, the cation-vacancy-rich, disordered cubic phases for both compounds with their unusually high anion orientational mobility exhibit, to the best of our knowledge, unparalleled superionic Li+ and Na+ conductivities compared to the values reported for all other known solid polycrystalline materials at similar temperatures, polyhedral-anion-based or otherwise.
Experimental
For neutron scattering measurements, aqueous lithium and sodium monocarba-closo-dodecaborates LiCB11H12 and NaCB11H12 were each formed by first preparing (H3O)CB11H12 from trimethylammonium monocarba-closo dodecaborate [(CH3)3NH]CB11H12 (Katchem25) by a procedure described in detail elsewhere,9 then neutralizing the (H3O)CB11H12 with either 0.1 M 7LiOH (Cambridge Isotope Laboratories, 99.9+ % 7Li) or NaOH until a pH of 7 was reached. Finally, anhydrous LiCB11H12 and NaCB11H12 were obtained from these respective aqueous solutions, first using a rotary evaporator at room temperature to form a hydrated solid, followed by dehydration under vacuum at 433 K and 330 K, respectively, for 16 h. Boron-11 enrichment, although also desirable for neutron scattering measurements, was not considered in this study because of the added complication of needing 11B-enriched starting materials to synthesize the CB11H12− anions. (N.B., both 6Li and 10B present in natural Li and B are strong neutron absorbers). For all other non-neutron-related measurements, we used separate batches of LiCB11H12 (with no 7Li enrichment) and NaCB11H12 obtained directly from Katchem.
Both anhydrous compounds were structurally characterized in quartz capillaries by XRPD using a Rigaku Ultima III X-ray diffractometer with a Cu-Kα source (λ=1.5418 Å). Elevated sample temperatures were enabled by a custom-designed, calibrated radiative/convective heat source. Differential scanning calorimetry measurements were made with a Netzsch (STA 449 F1 Jupiter) TGA-DSC under He flow with Al sample pans. Neutron scattering measurements were performed at the National Institute of Standards and Technology Center for Neutron Research. Neutron vibrational spectroscopy (NVS) measurements were performed at 4 K using thin flat-plate sample geometries and scattering in reflection on the Filter-Analyzer Neutron Spectrometer (FANS).26 The Cu(220) monochromator was used with pre- and post-collimations of 20′ of arc, yielding a full-width-at-half-maximum (FWHM) energy resolution of about 3 % of the neutron energy transfer. Quasielastic neutron scattering (QENS) measurements were performed using the same sample geometries on the Disc Chopper Spectrometer (DCS),27 utilizing incident neutrons at 4.1 Å (4.87 meV) with respective resolutions of 87.3 μeV and 184.4 μeV FWHM for NaCB11H12 and LiCB11H12. Spectra were collected in reflection over a useful momentum transfer (Q) range of around 1.0 Å−1 to 2.88 Å−1. The instrument resolution function was determined from QENS spectra at 200 K. The neutron scattering data were analyzed using the DAVE software package.28 XRPD structural refinements were performed using either GSAS29 or Fullprof software.30
Ionic conductivities were determined in heating and cooling runs repeatedly in the temperature range from room temperature to 433 K for LiCB11H12 and to 393 K for NaCB11H12 by the AC complex impedance method with a two-probe technique using a HIOKI 3532-80 chemical impedance meter over a frequency range of 4 Hz to 1 MHz with an input voltage perturbation of 150 mV. All measurements were performed under Ar. The powder sample was pressed into a pellet of 8 mm in diameter and approximately 2.7 mm in thickness without sintering. The pellet densities were about 1.05 g cm−3 and 1.13 g cm−3, which is more than 94 % of the density calculated from the lattice parameters. Li and Au foils were used as electrodes for LiCB11H12 and NaCB11H12, respectively, and mechanically fixed onto both faces of the pellet.
LiCB11H12 was used in preliminary battery tests. TiS2 (99.9 %, Sigma-Aldrich) and LiCB11H12 powders were mixed in a 1:1 mass ratio by an agate mortar in an agate pestle, and then used as a composite positive electrode. 25 mg of LiCB11H12 and 6 mg of the composite positive electrode powders were separately placed in an 8-mm-diameter die and then uniaxially pressed at 190 MPa. Li foil was used as a negative electrode and placed opposite of the positive electrode. The assembled bulk-type, all-solid-state TiS2/Li battery, namely TiS2/LiCB11H12 | LiCB11H12 | Li, was placed in a stainless-steel electrochemical cell with an 8-mm-diameter Teflon® guide, as schematically illustrated elsewhere.3 All of the procedures for the battery assemblies were carried out in an Ar-filled glove box. The battery test was carried out at 403 K with a 0.2 C charge rate (C-rate), corresponding to 285 μA cm−2, in the voltage range of 1.75 V to 2.6 V using a 580 battery test system (Scribner Associates).
To assist the structural refinements, first-principles calculations were performed within the plane-wave implementation of the generalized gradient approximation to Density Functional Theory (DFT) using a Vanderbilt-type ultrasoft potential with Perdew–Burke–Ernzerhof exchange correlation.31 A cutoff energy of 544 eV and a 2×2×1 k-point mesh (generated using the Monkhorst-Pack scheme) were used and found to be enough for the total energy to converge within 0.01 meV/atom. For comparison with the NVS measurements, the phonon densities of states (PDOSs) were calculated from the DFT-optimized structures using the supercell method (2×2×1 cell size) with finite displacements.32,33 They were weighted to take into account the H, 7Li, Na, C, and B total neutron scattering cross sections, appropriately averaged over Q-space, and convoluted with the instrumental resolution. The PDOS of the isolated CB11H12− anion was also calculated for comparison, using a 30×30×30 supercell and full C5v molecular symmetry. Mulliken atomic charges (shown in Fig. 1) were determined from these DFT calculations for the isolated CB11H12− anion as well as from those for the related B12H122− anion using the same-size supercell and its full Ih molecular symmetry.
All structural depictions were made using the VESTA (Visualization for Electronic and Structural Analysis) software.34 For all figures, standard uncertainties are commensurate with the observed scatter in the data, if not explicitly designated by vertical error bars.
Results and Discussion
Figure 2 shows DSC scans for LiCB11H12 and NaCB11H12, indicating a clear hysteretic phase change based on the respective endothermic (upon heating) and exothermic (upon cooling) enthalpic features. Here, they occur roughly near 395 K and 383 K for LiCB11H12 and near 380 K and 354 K for NaCB11H12, dramatically lower than their respective Li2B12H12 and Na2B12H12 analogs6 and suggestive of relatively lower enthalpic changes. As evidenced for NaCB11H12 during a later DSC cycle and for all the polyhedral borate salts, these temperatures can vary9 by more than 10 K depending on the cycling parameters and the maximum temperature employed, and seem to be intimately related to morphological changes that can occur with cycling, such as particle sintering or size reduction. We note that the inherent hystereses for these systems mean that the high-temperature phases can remain stable some degrees below the quoted Ttrans values, which often refer to the values observed upon heating.
Fig. 2.

Sequential heating (5 K min−1)/cooling (≤2 K min−1) DSC scans for (a) LiCB11H12 and (b) NaCB11H12 for two different cycles, the red curves measured after previously heating to 733 K. Arrows denote heating and cooling segments.
The room-temperature X-ray powder diffraction (XRPD) patterns and structural model fits for LiCB11H12 and NaCB11H12 are shown in Fig. 3. At room temperature, LiCB11H12 and NaCB11H12 were both indexed to orthorhombic structures. The approximate structural details for each compound were determined using direct space methods under the same most probable space group of Pca21 (No. 29). DFT calculations were then individually performed to optimize the CB11H12− rigid-body geometries with respect to the relative C, B, and H positions. Final Rietveld structural refinements35 of the lattice constants and cation and anion coordinates were carried out using the DFT-optimized CB11H12− rigid bodies. Full crystallographic details can be found in the CIF files in the Electronic Supplementary Information (ESI).
Fig. 3.

Experimental (circles), fitted (line), and difference (line below observed and calculated patterns) XRPD profiles for orthorhombic LiCB11H12 (top) and NaCB11H12 (bottom) at room temperature (CuKα radiation). Vertical bars indicate the calculated positions of the Bragg peaks. a=9.6668(5) Å, b=9.4892(5) Å and c= 9.7273(5) Å for LiCB11H12; a= 9.7821(4) Å, b= 9.6254(4) Å, and c= 10.0928(4) Å for NaCB11H12. Insets depict the corresponding structures. Red, yellow, brown, green, and white spheres denote Li, Na, C, B, and H atoms, respectively.
The Fig. 3 insets depict the similar orthorhombic structures for LiCB11H12 and NaCB11H12. In both of these ordered structures, the C atoms are not orientationally disordered amongst the various icosahedral vertices. Rather, there is a preferred vertex position for the C atom within the structures. As can be seen in Fig. 1, although the C atom has a markedly larger negative Mulliken charge than the other B atoms of the CB11H12− anion, its covalently bonded H atom has about a fivefold larger positive Mulliken charge than those for the other B-bonded H atoms. This anomalously large positive charge has a major influence on the lowest-energy orientation established by the anion and the particular crystallographic position of its C atom. As such, it is most energetically favorable for these particular H atoms to maximize their distance from the surrounding cations,16,36 as is observed here both experimentally and by our DFT calculations.
The neutron vibrational spectra for LiCB11H12 and NaCB11H12 at 4 K are shown in Fig. 4 and are compared with the simulated PDOSs based on the DFT-optimized, XRPD-refined structures as well as that for the isolated CB11H12− anion. Due to the relatively large neutron scattering cross-section for H atoms compared to Li, Na, C, and B atoms, the spectrum is dominated by the various optical vibrational modes involving H-atom displacements. Hydrogen stretching modes are at higher energies and are outside the measured energy range. There is good agreement between the experimental and simulated spectra, providing further credence to the refined structures. As suggested by the simulated PDOS of the isolated CB11H12− anion in Fig. 4 and borne out by PDOS results for other polyhedral hydroborate salts,37 the neutron vibrational spectrum is typically found to be sensitive to the crystal structure arrangement.
Fig. 4.

Neutron vibrational spectra (black) of LiCB11H12 and NaCB11H12 at 4 K compared to the simulated one+two-phonon densities of states from first-principles phonon calculations of the optimized orthorhombic structures (red), and the isolated CB11H12− anion (blue). Simulated one-phonon densities of states are depicted in grey. (N.B., 1 meV ≈ 8.066 cm−1.)
Further information about the characters and energies of the different LiCB11H12 and NaCB11H12 phonon modes contributing to the simulated PDOSs can be found in the animation files in the ESI.38
Figure 5 shows representative XRPD refinement results for the high-temperature disordered phase of LiCB11H12. (See Fig. S1 in the ESI for the NaCB11H12 refinement results.) Two different schematic views (lower inset and top) illustrate the primary disordered face-centered-cubic (fcc) structure found for both LiCB11H12 (at 430 K) and NaCB11H12 (at 356 K). The orientationally disordered anion arrangements are akin to the high-temperature disordered structures observed for Li2B12H12, Na2B10H10, and one of the high-temperature polymorphs of Na2B12H12,6,9 and provide a network of ample interstitial space with relatively more cation vacancies than Li2B12H12 and Na2B12H12 for facile cation transport. Although we observe only fcc structures at these temperatures, additional XRPD measurements indicate the gradual competing appearance of other similar-energy (and clearly similarly conductive) disordered polymorphs for NaCB11H12 at longer times and/or at higher temperatures (see Fig. S2 in the ESI), which is not uncommon.6 It is possible that LiCB11H12 also possesses different polymorphs at higher temperatures above 430 K.
Fig. 5.

(bottom) experimental (circles), fitted (line), and difference (line below observed and calculated patterns) XRPD profiles for the high-temperature, disordered, face-centered-cubic (fcc) structure for LiCB11H12 at 430 K (CuKα radiation), with a= 9.9355(6)Å. Vertical bars indicate the calculated positions of the Bragg peaks (with about 5 % orthorhombic phase still present). NaCB11H12 at 356 K is isostructural with a= 10.066(3) Å. Inset is a schematic view of the disordered structure along a principal axis. Orange, green, and white spheres denote Li/Na, C/B, and H atoms, respectively. (top) An alternate view without the H atoms, better indicating the cation channels. N.B., the disordered cation positions reflect likely locations based on favorable interstitial volumes and previous neutron diffraction results for similarly disordered Na2B10H10.9,21 Moreover, multiple distinct B/C and H positions are only meant to mimic the average, spherically isotropic, anion orientational disorder present in these materials.
Preliminary QENS measurements for both LiCB11H12 and NaCB11H12 confirm the orders of magnitude leaps in anion orientational mobilities to between 1010 and 1011 reorientational jumps s−1 in the disordered phases, as reflected in Fig. 6 by the transformation from purely resolution-limited elastic component peaks at 200 K to ones with significant quasielastic broadening at 433 K and 375 K, respectively. For both materials, the observed fraction of scattering that is quasielastic above Q = 1 Å−1 appears to be of the order of 0.8 or more, suggesting that we are observing anion small-angle-jump reorientations akin to that observed for Na2B12H12,24 which is thought to entail a distribution of individual anion motions ranging from one-axis to multi-axis reorientations. A comparison of a simple one-Lorentzian fit of the broad component for NaCB11H12 in Fig. 6b to that for Na2B10H10 under identical conditions of temperature, Q, and instrumental resolution suggests that reorientational jump frequencies for the CB11H12− anions may be on the order of 60% higher than those for the B10H102− anions.9 (N.B., Na2B12H12 is not normally in its disordered phase at 375 K and is therefore less straightforward to compare.) Of course, this comparison assumes similar reorientational mechanisms and ignores the reality that the mechanism-dependent broadening for these highly disordered anions is actually comprised of more than one Lorentzian component.24 A more rigorous comparison and analysis confirming our observations awaits further QENS measurements using 11B-enriched materials in combination with parallel NMR studies. If these higher relative CB11H12− orientational mobilities compared to the analogous B10H102− (and B12H122−) anions are indeed the case, they are likely a consequence of relatively weaker cation-anion (coulombic) interactions as well as, on average, one-half fewer near-neighbor cations for the CB11H12− anion.
Fig. 6.
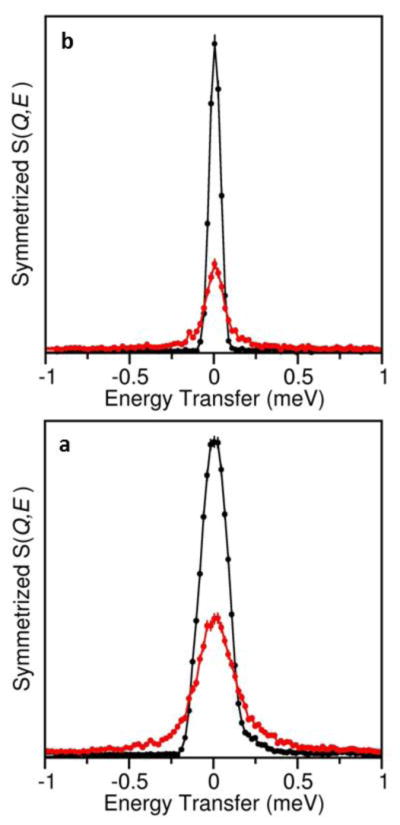
QENS spectra at Q=1.35 A−1 showing the anion-reorientation-induced broadening in red for (a) LiCB11H12 (at 433 K) and (b) NaCB11H12 (at 375 K) compared to the resolution-limited elastic-scattering peaks in black observed at 200 K, below the order-disorder phase transitions. (N.B., lower instrumental resolution was used for LiCB11H12, as detailed in the Experimental Section.)
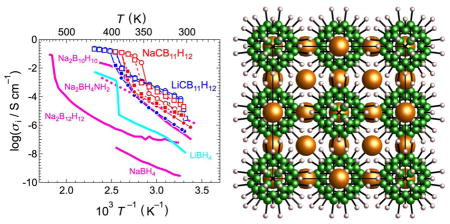
Figure 7 summarizes the conductivity-related results for both compounds. The ac impedance spectra of the symmetric cells for the LiCB11H12 and the NaCB11H12 electrolytes are characteristic of pure ionic conductors. (N.B., characteristic of all these disordered polyhedral-anion-based compounds, the anions can be considered translationally immobile compared to the rapidly diffusing cations.7,9 Moreover, additional dc conductivity measurements indicate that electronic conduction is also relatively negligible, confirming near-unity cation transport numbers.) As shown in Fig. 7a, the Li-symmetric cell for LiCB11H12 had a parallel circuit of a resistor and a capacitor (semi-circle) at T ≤ 393 K while only ohmic resistance appeared at T ≥ 403 K. On the other hand, a spike appeared after the semi-circle or ohmic resistance when using a Au-symmetric cell with this electrolyte (Au-symmetric cell data not shown) as well as with the NaCB11H12 electrolyte (Fig. 7b) owing to interface resistance. Thus, the semi-circle and ohmic resistance appearing in the complex plane could be assigned to the total electrolyte resistances contributed by the bulk and grain boundaries. At elevated temperatures, conductivity jumps appeared for both materials accompanied by the order–disorder transition completed at 393 K to 403 K for LiCB11H12 and 373 K to 383 K for NaCB11H12. σLi+ for LiCB11H12 and σNa+ for NaCB11H12 are ≥ 0.15 S cm−1 at T ≥ 403 K and ≥0.12 S cm−1 at T ≥ 383 K, respectively, with low activation energies of 0.22 eV. The high-temperature ionic conductivities are the greatest among polycrystalline electrolytes investigated thus far, complex hydrides (Fig. 7c) or otherwise (Fig. 7d). Indeed, Li+ conductivity for LiCB11H12 appears to surpass even that of the best known material, Li10GeP2S12 (which has a similar activation energy of 0.25 eV, Fig. 7d).39 Na+ conductivity for NaCB11H12 is even more impressive, being an order of magnitude higher than that of its closest competitor, Na2B10H10,9 and almost 50× better (at 363 K) than the best Na3PS4-based glass ceramic.14,40
Fig. 7.

Complex impedance plots of (a) Li-symmetric cell using the LiCB11H12 electrolyte and (b) Au-symmetric cell using the NaCB11H12 electrolyte measured at various temperatures during 2nd heating. (c) Ionic conductivities of species i (i = Li+ and Na+) of LiCB11H12 (blue) and NaCB11H12 (red) as a function of inverse temperature. Circles and squares denote the conductivities of the respective 1st and 2nd temperature cycles. Closed and open symbols denote respective heating and cooling processes. The ionic conductivities are compared to other related materials: Na2B12H12,8 Na2B10H10,9 Na2BH4NH2,2 NaBH4,2 and LiBH4.1 (d) Comparison of ionic conductivities for LiCB11H12 and NaCB11H12 (during 2nd heating) with other known polycrystalline superionic conductors such as: Li10GeP2S12,39 Li7P3S11 glass-ceramic,41 Li0.325Ge0.25P0.75S4,42 Li0.34La0.51TiO2.94,43 Li7La3Zr2O12,44 Li1.3Al0.3Ti1.7(PO4)3,45 Na3PS4 glass-ceramic,14 polycrystalline β-/β″-alumina mixture,46 and Na3Zr1.917Si1.667P1.333O12.47
It should be noted that the intermediate conductivities observed between around 323 K and the higher-temperature transitions for both compounds in Fig. 7c upon temperature cycling are likely due to the premature formation or lingering of some superionic disordered material, as evidenced by parallel XRPD measurements during similar temperature-cycling algorithms. Such idiosyncrasies in the phase behaviors of the polyhedral borates are known to be sensitive to the particular morphological details of the materials.6,8,9
The order-of-magnitude higher Na+ conductivity for NaCB11H12 (and LiCB11H12) compared to Na2B10H10, despite the similar high-temperature structures, is quite striking, leading one to reasonably speculate on the origins of such differences. Indeed, differences in anion charges, anion orientational mobilities, the number of cation vacancies, and lattice constants all might contribute to more favorable conductivities for the present compounds. In particular, the halved (monovalent) anion charge might lead to a decreased barrier for cation jumps through the anion sublattice due to decreased coulombic interactions. A relatively weaker Li+-anion interaction is indeed suggested for the CB11H12− anion from comparative mass spectrometry results and cluster calculations for both Li2B12H12 and LiCB11H12 moieties.48,49 Also, the 1:1 cation:anion ratio means that there are relatively half as many cations in the LiCB11H12 and NaCB11H12 structures and therefore more available cation vacancies per unit cell. This would diminish the effects of possible cation-site blocking that might hinder cation transport. Moreover, the potentially more orientationally mobile CB11H12− anions might further assist cation transport by acting as better “lubricants“ or cooperative (barrier-lowering) partners as cations attempt to move past them.8,24 Lastly, even though the CB11H12− and B10H102− anions are of similar size, the fcc lattice constant for NaCB11H12 at 356 K is already over 2 % larger than that for Na2B10H10 at 410 K,21 possibly providing a little more space for cation transport. As a result of all these factors, the Li+ and Na+ cations more rapidly migrate through the vacancy-rich three-dimensional sublattices of the high-symmetry cubic crystal structures that prevail in these materials. Hence, Both LiCB11H12 and NaCB11H12 exhibit liquid-like high ionic conductivities, as in the classical silver superionic conductor, α-AgI (σAg+ ≥ 1.3 S cm−1 at T ≥ 420 K).50,51 A clearer understanding of the roles and importance of these various factors on the ultimate conductivity attainable in the superionic phases of this general class of compounds still awaits a thorough theoretical analysis of the different solid-state disordered systems accompanied by more experimental studies.
As a representative test of electrochemical stability, LiCB11H12 was incorporated into a positive electrode layer comprised of a hand-mixed TiS2/LiCB11H12 powder in a 1:1 mass ratio. This positive electrode layer was part of a bulk-type, all-solid-state TiS2/LiCB11H12 | LiCB11H12 | Li battery with LiCB11H12 acting as the electrolyte separator. This cell was operated repeatedly at 403 K and 0.2 C. It had approximately 175 mAh g−1 discharge capacity during operation with approximately 95 % coulombic efficiency (ratio of discharge to charge capacities) after the 3rd cycle. Figure 8 illustrates discharge–charge profiles over five cycles, which suggest that the LiCB11H12 is reasonably stable with respect to TiS2 and Li over this voltage range. We consider this first rudimentary attempt to incorporate LiCB11H12 into a working battery as promising. As with all other new solid electrolyte materials, clearly many more electrochemical studies are warranted and need to be done to determine the optimal battery chemistries, configurations, and cycling conditions that can take full advantage of these polyhedral-anion-based salts, which is beyond the scope of this paper. Nonetheless, these preliminary results suggest that, besides their impressive conductivities, this class of complex hydrides comprised of highly stable aromatic-like52 polyhedral anions, including B12H122−, B10H102−, and CB11H12−, has the potential for good electrochemical compatibility with commercial cathode materials, which will be critical for any eventual use in next generation, all-solid-state batteries.
Fig. 8.

Discharge–charge profiles over five cycles of the bulk-type all-solid-state 50 wt. % TiS2/LiCB11H12 | LiCB11H12 | Li battery operated at 403 K and 0.2 C.
Conclusions
This work shows that LiCB11H12 and NaCB11H12 undergo order-disorder phase transitions near 400 K and 380 K, respectively, which are substantially lower than those for the analogous Li2B12H12 and Na2B12H12 compounds. Above these transition temperatures, the cation-vacancy-rich, disordered phases for both compounds with their unusually high anion orientational mobility exhibit unparalleled superionic Li+ and Na+ conductivities compared to the values reported for all other known solid polycrystalline Li+ and Na+ conducting materials.
Concerning other ongoing tangential studies, we have found that the stability range of the disordered phases for the broad class of polyhedral borate materials including the present materials can potentially be extended to lower temperatures via ball-milling, the details of which will be the subject of a separate publication. These morphological modifications can lead to dramatically improved bulk conductivities down to room temperature and below. Hence, the room-temperature conductivities of ball-milled LiCB11H12 and NaCB11H12 compounds have the potential to benefit significantly from the presence of such stabilized phases, and experiments are currently underway to explore this further.
Based on our current and past findings and the potential for further improvements via an assortment of possible additional morphological, chemical, or substitutional modifications, we believe that there are a large variety of intriguing new compounds and hybrid materials involving such large polyhedral anions still to be explored, and we anticipate that an optimized electrolyte from this class of materials will be considered one of the more promising for use in future, all-solid-state, energy conversion and storage devices.
Supplementary Material
Broader Context.
With the expanding interest in electric vehicles, the management of renewable energy, and other greener technologies in today’s world, the need for improved energy-storage devices that deliver more power with higher capacities is ever increasing. Moreover, there is a growing desire to improve on the versatility, safety, and cycle-life afforded by the current device technologies, which typically incorporate organic-based liquid electrolytes. Hence there has been a general push to eliminate these liquid electrolytes in favor of all-solid-state devices using safe, stable, solid-state electrolytes. Until recently, the latter materials under consideration have been more ceramic or polymer-based. Complex hydride materials, and more recently, large-polyhedral-anion-based materials such as LiCB11H12 and NaCB11H12 reported here are emerging as intriguing alternatives to these more traditional candidates. We believe that this newer class of solid-state electrolytes show great promise and deserves increased scrutiny as viable components of next-generation energy-storage devices.
Acknowledgments
This work was performed, in part, in collaboration between members of IEA HIA Task 32 – Hydrogen-based Energy Storage. The authors gratefully acknowledge support from DOE EERE through Grant No. DE-EE0002978; the Integrated Materials Research Center for the Low-Carbon Society (LC-IMR), Tohoku University; the Advanced Low Carbon Technology Research and Development Program (ALCA) from the Japan Science and Technology Agency (JST); and JSPS KAKENHI under Grant Nos. 25220911 and 26820311. This work utilized facilities supported in part by the NSF under Agreement No. DMR-0944772. The authors thank J. B. Leão for his technical assistance with the elevated-temperature XRPD measurements.
Footnotes
Author contributions
W.S.T. performed the XRPD and DSC measurements/analyses. V.S. performed the sample syntheses/analyses. W.Z. performed the DFT calculations. H.W. also performed XRPD analyses. A.U. performed the battery test/analysis. M.M. performed the conductivity measurements/analysis. S.O. organized the electrochemical tests. T.J.U. initiated the study, performed the neutron scattering measurements/analyses, and wrote the paper with contributions from all other authors.
References
- 1.Matsuo M, Nakamori Y, Orimo S, Maekawa H, Takamura H. Appl Phys Lett. 2007;91:224103. [Google Scholar]
- 2.Matsuo M, Kuromoto S, Sato T, Oguchi H, Takamura H, Orimo S. Appl Phys Lett. 2012;100:203904. [Google Scholar]
- 3.Unemoto A, Yasaku S, Nogami G, Tazawa M, Taniguchi M, Matsuo M, Ikeshoji T, Orimo S. Appl Phys Lett. 2014;105:083901. [Google Scholar]
- 4.Matsuo M, Orimo S. Adv Energ Mater. 2011;1:161–172. [Google Scholar]
- 5.Unemoto A, Matsuo M, Orimo S. Adv Funct Mater. 2014;24:2267–2279. [Google Scholar]
- 6.Verdal N, Her J-H, Stavila V, Soloninin AV, Babanova OA, Skripov AV, Udovic TJ, Rush JJ. J Solid State Chem. 2014;212:81–91. [Google Scholar]
- 7.Skripov AV, Babanova OA, Soloninin AV, Stavila V, Verdal N, Udovic TJ, Rush JJ. J Phys Chem C. 2013;117:25961–25968. [Google Scholar]
- 8.Udovic TJ, Matsuo M, Unemoto A, Verdal N, Stavila V, Skripov AV, Rush JJ, Takamura H, Orimo S. Chem Commun. 2014;50:3750–3752. doi: 10.1039/c3cc49805k. [DOI] [PubMed] [Google Scholar]
- 9.Udovic TJ, Matsuo M, Tang WS, Wu H, Stavila V, Soloninin AV, Skoryunov RV, Babanova OA, Skripov AV, Rush JJ, Unemoto A, Takamura H, Orimo S. Adv Mater. 2014;26:7622–7626. doi: 10.1002/adma.201403157. [DOI] [PubMed] [Google Scholar]
- 10.Paskevicius M, Pitt MP, Brown DH, Sheppard DA, Chumphongphan S, Buckley CE. Phys Chem Chem Phys. 2013;15:15825–15828. doi: 10.1039/c3cp53090f. [DOI] [PubMed] [Google Scholar]
- 11.Wu H, Tang WS, Stavila V, Zhou W, Rush JJ, Udovic TJ. J Phys Chem C. 2015;119:6481–6487. [Google Scholar]
- 12.Tang WS, Udovic TJ, Stavila V. J Alloys Compds. doi: 10.1016/j.jallcom.2015.01.061. [DOI] [Google Scholar]
- 13.Soloninin AV, Babanova OA, Medvedev EY, Skripov AV, Matsuo M, Orimo S. J Phys Chem C. 2014;118:14805–14812. [Google Scholar]
- 14.Hayashi A, Noi K, Sakuda A, Tatsumisago M. Nat Commun. 2012;3:856. doi: 10.1038/ncomms1843. [DOI] [PubMed] [Google Scholar]
- 15.Tanibata N, Noi K, Hayashi A, Kitamura N, Idemoto Y, Tatsumisago M. Chem Electro Chem. 2014;1:1130–1132. [Google Scholar]
- 16.Douvris C, Michl J. Chem Rev. 2013;113:PR179–PR233. doi: 10.1021/cr400059k. [DOI] [PubMed] [Google Scholar]
- 17.Shelly K, Reed CA. J Am Chem Soc. 1986;108:3118–3120. [Google Scholar]
- 18.Tutusaus O, Mohtadi R, Arthur TS, Mizuno F, Nelson EG, Sevryugina YV. Angew Chem Int Ed. 2015;54:7900–7904. doi: 10.1002/anie.201412202. [DOI] [PubMed] [Google Scholar]
- 19.Romerosa AM. Thermochim Acta. 1993;217:123–128. [Google Scholar]
- 20.Verdal N, Wu H, Udovic TJ, Stavila V, Zhou W, Rush JJ. J Solid State Chem. 2011;184:3110–3116. [Google Scholar]
- 21.Wu H, Tang WS, Zhou W, Stavila V, Rush JJ, Udovic TJ. CrystEngComm. 2015;17:3533–3540. [Google Scholar]
- 22.Her JH, Yousufuddin M, Zhou W, Jalisatgi SS, Kulleck JG, Zan JA, Hwang SJ, Bowman RC, Jr, Udovic TJ. Inorg Chem. 2008;47:9757–9759. doi: 10.1021/ic801345h. [DOI] [PubMed] [Google Scholar]
- 23.Her JH, Zhou W, Stavila V, Brown CM, Udovic TJ. J Phys Chem C. 2009;113:11187–11189. [Google Scholar]
- 24.Verdal N, Udovic TJ, Stavila V, Tang WS, Rush JJ, Skripov AV. J Phys Chem C. 2014;118:17483–17489. [Google Scholar]
- 25.The mention of all commercial suppliers in this paper is for clarity and does not imply the recommendation or endorsement of these suppliers by NIST.
- 26.Udovic TJ, Brown CM, Leão JB, Brand PC, Jiggetts RD, Zeitoun R, Pierce TA, Peral I, Copley JRD, Huang Q, Neumann DA, Fields RJ. Nucl Instr and Meth A. 2008;588:406–413. [Google Scholar]
- 27.Copley JRD, Cook JC. Chem Phys. 2003;292:477–485. [Google Scholar]
- 28.Azuah RT, Kneller LR, Qiu Y, Tregenna-Piggott PLW, Brown CM, Copley JRD, Dimeo RM. J Res Natl Inst Stan. 2009;114:341–358. doi: 10.6028/jres.114.025. [DOI] [PMC free article] [PubMed] [Google Scholar]
- 29.Larson AC, Von Dreele RB. General Structure Analysis System, Report LAUR 86–748. Los Alamos National Laboratory; NM: 1994. [Google Scholar]
- 30.Rodriguez-Carvajal J. Physica B. 1993;192:55–69. [Google Scholar]
- 31.Giannozzi P, et al. J Phys: Condens Matter. 2009;21:395502. doi: 10.1088/0953-8984/21/39/395502. [DOI] [PubMed] [Google Scholar]
- 32.Kresse G, Furthmuller J, Hafner J. Europhys Lett. 1995;32:729–734. [Google Scholar]
- 33.Yildirim T. Chem Phys. 2000;261:205–216. [Google Scholar]
- 34.Momma K, Izumi F. J Appl Crystallogr. 2011;44:1272–1276. [Google Scholar]
- 35.Rietveld HM. J Appl Crystallogr. 1969;2:65–71. [Google Scholar]
- 36.Zharov I, Weng T, Orendt A, Barich D, Penner-Hahn J, Grant D, Havlas Z, Michl J. J Am Chem Soc. 2004;126:12033–12046. doi: 10.1021/ja0475205. [DOI] [PubMed] [Google Scholar]
- 37.Verdal N, Zhou W, Stavila V, Her J-H, Yousufuddin M, Yildirim T, Udovic TJ. J Alloys Compds. 2011;509S:S694–S697. [Google Scholar]
- 38.Phonon animation files in the ESI for the DFT-optimized 0 K orthorhombic LiCB11H12 and NaCB11H12 structures, respectively, can be viewed using the V_Sim software at http://inac.cea.fr/L_Sim/V_Sim/.
- 39.Kamaya N, Homma K, Yamakawa Y, Hirayama M, Kanno R, Yonemura M, Kamiyama T, Kato Y, Hama S, Kawamoto K, Mitsui A. Nat Mater. 2011;10:682–686. doi: 10.1038/nmat3066. [DOI] [PubMed] [Google Scholar]
- 40.Hueso KB, Armand M, Rojo T. Energy Environ Sci. 2013;6:734–749. [Google Scholar]
- 41.Mizuno F, Hayashi A, Tadanaga K, Tatsumisago M. Adv Mater. 2005;17:918–921. [Google Scholar]
- 42.Kanno R, Murayama M. J Electrochem Soc. 2001;148:A742–A746. [Google Scholar]
- 43.Inaguma Y, Liquan C, Itoh M, Nakamura T. Solid State Commun. 1993;86:689–693. [Google Scholar]
- 44.Murugan R, Thangadurai V, Weppner W. Angew Chem Int Ed. 2007;46:7778–7781. doi: 10.1002/anie.200701144. [DOI] [PubMed] [Google Scholar]
- 45.Aono H, Sugimoto E, Sadaoka Y, Imanaka N, Adachi G. J Electrochem Soc. 1989;136:590–591. [Google Scholar]
- 46.Hooper A. J Phys D: Appl Phys. 1977;10:1487–1496. [Google Scholar]
- 47.Bohnke O, Ronchetti S, Mazza D. Solid State Ionics. 1999;122:127–136. [Google Scholar]
- 48.Dávalos JZ, González J, Guerrero A, Hnyk D, Holub J, Oliva JM. J Phys Chem C. 2013;117:1495–1501. [Google Scholar]
- 49.Giri S, Behera S, Jena P. Angew Chem Int Ed. 2014;53:13916–13919. doi: 10.1002/anie.201408648. [DOI] [PubMed] [Google Scholar]
- 50.Tubandt C, Lorenz E. Z Phys Chem. 1914;24:513–543. [Google Scholar]
- 51.Funke K. Prog Solid State Chem. 1976;11:345–402. [Google Scholar]
- 52.Lipscomb WH. Boron Hydrides. W. A. Benjamin, Inc; New York: 1963. [Google Scholar]
Associated Data
This section collects any data citations, data availability statements, or supplementary materials included in this article.