

Abstract
Background
Electrophysiological recording approaches are essential for understanding brain function. Among these approaches are various methods of performing single-unit recordings. However, a major hurdle to overcome when recording single units in vivo is stability. Poor stability results in a low signal-to-noise ratio, which makes it challenging to isolate neuronal signals. Proper isolation is needed for differentiating a signal from neighboring cells or the noise inherent to electrophysiology. Insufficient isolation makes it impossible to analyze full action potential waveforms. A common source of instability is an inadequate surgery. Problems during surgery cause blood loss, tissue damage and poor healing of the surrounding tissue, limited access to the target brain region, and, importantly, unreliable fixation points for holding the mouse’s head.
New Method
We describe an optimized surgical procedure that ensures limited tissue damage and delineate a method for implanting head plates to hold the animal firmly in place.
Results
Using the cerebellum as a model, we implement an extracellular recording technique to acquire single units from Purkinje cells and cerebellar nuclear neurons in behaving mice. We validate the stability of our method by holding single units after injecting the powerful tremorgenic drug harmaline. We performed multiple structural analyses after recording.
Comparison with Existing Methods
Our approach is ideal for studying neuronal function in active mice and valuable for recording single-neuron activity when considerable motion is unavoidable.
Conclusions
The surgical principles we present for accessing the cerebellum can be easily adapted to examine the function of neurons in other brain regions.
Keywords: electrophysiology, action potential, surgery, behavior, cerebellum, tremor
1. Introduction
There are now many methods available for studying brain function. Among these are various approaches for recording neurons in vivo (Chorev et al., 2009; Gilja et al., 2010; Long and Lee, 2012). The signals may be collected from populations of neurons using electrode arrays (Buzsaki, 2004; Khodagholy et al., 2015), tetrodes (Gao et al., 2012; Chaumont et al., 2013; Sauerbrei et al., 2015), or single electrodes to collect either local field potentials (LFPs; Miller and Wilson, 2008; Servais and Cheron, 2005) or action potentials from single cells (Bryant et al., 2009; White et al., 2014). For recording from individual neurons, signals can be acquired by using whole-cell techniques in which the electrode penetrates the cell to measure the internal milieu and cell membrane properties (Long and Lee, 2012), or the electrode can be placed in very close proximity to a cell of interest to record extracellular signals (Arancillo et al., 2015). In either case, the preparation has to be very stable in order to hold the cell for a sufficient length of time so that an adequate number of spikes can be collected for statistical analyses. Since limiting the animal’s movements and eliminating vibrations are major hurdles to overcome, stability is a particular challenge in acute recordings in behaving animals.
One of the most common sources of stability problems is an inadequate surgery. Low-quality surgeries can cause excessive blood loss, hypothermia (especially in smaller animals that lose body heat rapidly), major tissue damage at the surgical site resulting in limited healing of the surrounding tissues, and bone fragments that lacerate the brain due to poor bone drilling technique. These bone fragments, along with other tissue debris and excessive bleeding, also obscure visibility when trying to make a craniotomy of precise size and location. Ultimately, these issues make it very difficult to firmly implant head plates, which are essential for stabilizing the animal during the recording. If the animal is not stable, the signal-to-noise ratio becomes too low, single units become difficult to isolate (especially in brain regions that have a high density of neurons), and, even if spike sorting is possible, the single-unit activity (Wise et al., 2010; Viskontas et al., 2007; Cazakoff et al., 2014; Nakamura et al., 2014; Zhou et al., 2014) cannot be analyzed further as it is often hard to see the full action potential waveform (White et al., 2014). The exact shape of a waveform is important for accurately differentiating individual units and in some regions also for separating excitatory and inhibitory neurons. In this paper, we present a surgical procedure that overcomes many of these problems. We introduce a method for making clean craniotomies and describe how to firmly implant head plates in order to acquire stable extracellular single-unit recordings in vivo in behaving mice.
We use the cerebellum as a model to demonstrate the efficacy of our surgery and implantation techniques for recording neurons in vivo. The cerebellum is essential for diverse functions, including motor coordination and learning, posture, and balance. Therefore, damage to its circuits causes a number of motor disorders, such as ataxia, dystonia, and tremor (Orr, 2012; LeDoux and Lorden, 2002; Wilson and Hess, 2013; Louis et al., 2011). Cerebellar function in both normal and abnormal states has been intensely studied. As a result, its anatomy, circuitry, and neuronal firing properties are among the best understood in the brain (Ruigrok et al., 2011). We delineate how to obtain cerebellar recordings in moving mice (Fig. 1) and demonstrate the stability of our approach by injecting the tremorgenic drug harmaline (Handforth, 2012). Harmaline induces tremor within minutes after injection. Despite the continuous shaking of the animal during tremor, we were able to isolate clean single units from Purkinje cells with recognizable, quantifiable complex spike and simple spike action potential waveforms.
Fig. 1.

(A) Purkinje cells stained with an anti-CAR8 antibody demonstrating the cellular density and structural complexity of the cerebellum. In this 3D reconstruction, the red pseudo color indicates the structures that are closest to the surface whereas the blue reveals deeper structures. Extracellular recoding electrodes have to traverse these structures in order for a single-unit to be isolated, typically with the electrode tip near the soma. (B) Schematic of an electrode targeting the cerebellum for in vivo recordings in an alert adult mouse. The schematics on the right illustrate the basic architecture of the cerebellum with the electrode targeting either the Purkinje cells (left, pink) or the cerebellar nuclear neurons (right, black). The granule cells are gray.
2. Materials and methods
2.1 Animals
C57BL6/J mice were purchased from The Jackson Laboratory (Bar Harbor, ME) and were maintained in our animal colony. We bred the mice using timed pregnancies, and we designated noon on the day a vaginal plug was detected as embryonic day (E) 0.5. Some mice were mixed-background controls from previous breeding (White et al., 2014). Mice of both sexes were studied at postnatal day (P) 60 or beyond. All animal studies were carried out under an approved IACUC animal protocol according to the institutional guidelines at Baylor College of Medicine.
2.2 Perfusion and tissue preparation
Mice were deeply anesthetized with 2, 2, 2-Tribromoethanol (commonly known as Avertin) and then perfused with 0.1 M phosphate-buffered saline (PBS; pH 7.4), followed by 4% paraformaldehyde (4% PFA) diluted in PBS. The brains were post-fixed for 24 to 48 hours in 4% PFA and then cryoprotected stepwise in buffered sucrose solutions (15% and 30% diluted in PBS). Serial 40-um thick coronal or sagittal sections were cut on a cryostat and collected as free-floating sections in PBS. Some brains were embedded in paraffin and cut on a microtome at 10 μm. The staining was conducted directly on electrostatically coated slides (Sillitoe et al., 2008).
2.3 Tissue staining and histology
Immunohistochemistry was conducted on frozen sections as previously described (Sillitoe et al., 2003; Sillitoe et al., 2010; White and Sillitoe, 2013b; White et al., 2014). The paraffin-processed tissue was stained with antibodies or used for basic histology and morphology (Sillitoe et al., 2008). Cell death was detected using the ApopTag kit (Millipore, Temecula CA; Cat. # S7100).
2.4 Antibodies
Mouse monoclonal anti-carbonic anhydrase VIII (CAR8; Cat. # sc-166626, Santa Cruz Biotechnology, Santa Cruz, CA, USA; Fig. 1A) or rabbit polyclonal anti-CAR8 (Cat. # sc-67330, Santa Cruz Biotechnology) were used to visualize CAR8 expression (1:1000, 1:500, respectively) in Purkinje cells. Rabbit polyclonal anti-IP3R1 (inositol 1,4,5-triphosphate receptor type 1; Thermo Scientific, Waltham, MA, USA; Cat. # PA1-901) was also used to mark Purkinje cells. It was used at a concentration of 1:500 for dual staining with mouse anti-CAR8 (Fig. 1A). Mouse monoclonal anti-calbindin (Cat. # 300; Swant, Marly, Switzerland) was diluted 1:10,000. In the cerebellum, calbindin is expressed only in Purkinje cells. Rabbit polyclonal anti-parvalbumin (1:1000; Cat. # PV25) and rabbit polyclonal anti-calretinin (1:500, Cat. # CR7699/3H) were also purchased from Swant and mark inhibitory and excitatory neurons, respectively. Monoclonal anti-zebrinII (Brochu et al., 1990) was used directly from spent hybridoma culture medium at a concentration of 1:250 (gift from Dr. Richard Hawkes, University of Calgary, Alberta, Canada). ZebrinII recognizes an antigen on the AldolaseC protein (Ahn et al., 1994) and is a well-established marker for Purkinje cell zones. Rabbit anti-gamma-aminobutyric acid receptor α6 (GABARα6) is a granule cell marker that was purchased from Millipore (Billerica, MA, USA); we used it at a concentration of 1:500 (Cat. # AB5610). We also detected a small number of GABARα6 positive Purkinje cells that were scattered throughout the lobules with no particular pattern, which is consistent with the mRNA expression that is shown in the Allen Brain Atlas. Mouse monoclonal anti-neurofilament heavy (NFH, also called anti-SMI-32; 1:1500) was purchased from Covance (Princeton, NJ, USA). Anti-SMI-32 recognizes the non-phosphorylated form of NFH (see manufacturer product datasheet for details), which on tissue sections labels the soma, dendrites, and axons of adult Purkinje cells, and also basket cell axons and pinceau (Demilly et al., 2011). Rabbit anti-neurogranin (1:500) was raised against full-length recombinant rat neurogranin protein (Chemicon, Temecula, CA, USA; Cat. # AB5620). Neurogranin recognizes Purkinje cells in the perinatal cerebellum and Golgi cell interneurons in the adult cerebellum (Singec et al., 2003; Larouche et al., 2006). Rabbit polyclonal anti-cocaine- and amphetamine-related transcript peptide (CART 55-102; Cat. # H-003-62) was used at a concentration of 1:250 to detect climbing fibers (Reeber and Sillitoe, 2011) and was purchased from Phoenix Pharmaceuticals, Inc. (Burlingame, CA, USA). The CART signal was amplified using a biotinylated secondary antibody and the Vectastain Elite ABC method from VectorLabs (Burlingame, CA, USA; Reeber and Sillitoe, 2011). Anti-vesicular glutamate transporter 2 (VGLUT2; Synaptic Systems, Göttingen, Germany; Cat. # 135 403) was used to visualize excitatory mossy fiber terminals in the granular layer (rabbit 1:1000; Gebre et al., 2012), although it also detects excitatory climbing fiber terminals that project directly to the Purkinje cell dendrites in the molecular layer (Hisano et al., 2002).
Alexa-555 and -488 secondary goat anti-mouse and anti-rabbit antibodies (Molecular Probes Inc., Eugene, OR, USA) were diluted 1:1500. Horseradish peroxidase-conjugated secondary goat anti-mouse or anti-rabbit antibodies (DAKO, Carpinteria, CA, USA) were diluted to 1:200. Peroxidase binding was revealed by incubating the tissue in a 3,3′ –diaminobenzidine (DAB; Sigma-Aldrich, St Louis, MO, USA) solution consisting of a 100mg DAB tablet dissolved in 40 mL PBS and 10 μL 30% H2O2. The reaction was stopped when the optimal color intensity was reached. Some sections were mounted with medium containing DAPI (Vectastain H-1200; VectorLabs) before viewing under fluorescence.
2.5 Imaging and data analysis
Photomicrographs of tissue sections were captured using Zeiss AxioCam MRm (fluorescence) and AxioCam MRc5 (DAB-reacted tissue sections) cameras mounted on a Zeiss Axio Imager.M2 microscope, which is equipped with Zeiss CY3 (model #41007a), FITC (model #41001), and DAPI/Hoechst/AMCA (model #31000v2) filters. Images of tissue sections were acquired and analyzed with Zeiss AxioVision software (release 4.8) or Zeiss ZEN software (2012 edition). Purkinje cells were captured with Zeiss Apotome.2 and then analyzed using ZEN Module 3D VisArt. The raw data were imported into Adobe Photoshop CS5 and corrected for brightness and contrast levels. Schematics were drawn in Adobe Illustrator CS5.
2.6 Drug treatment
Harmaline HCl (Sigma-Aldrich) was dissolved in PBS immediately before use and then administered intraperitoneally at a dosage of 20 mg/kg. The mice were monitored carefully for signs of tremor, which usually arise within minutes of injection (Handforth, 2012). Harmaline-induced tremors are overt and easily recognizable by eye. However, in this study, harmaline induced tremor was recorded and quantitatively analyzed using a commercially available tremor monitor and software (San Diego Instruments, San Diego, CA, USA). We also examined the tremor phenotype by following Purkinje cell activity in mice that were injected with harmaline.
2.7 Surgical procedure for how to make a clean craniotomy and firmly implant head plates
The surgical procedure we developed was intended to allow acquisition of clean recordings from a recently-introduced electrophysiology recording set up (Chettih et al., 2011; Heiney et al., 2014a; Heiney et al., 2014b). Our group adapted the setup by making minor modifications (Arancillo et al., 2015). The main tools required for the surgery are dissection scissors (Fine Science Tools, Foster City, CA, USA; FST#14082-09), #55 forceps (FST #11255-20), and Dumont AA forceps (FST #11210-10), which we use for reflecting tissue, teasing apart fascia when access is needed, and lifting off any tissue debris from the surgical site. We use a bone drill (Ideal Micro-Drill Surgical Drills #726065) to make the craniotomy. Before starting, a thin ~30-gauge metal post should be cut to ~10 mm to serve as a marker for bregma; later, it will be cut to a length that roughly equals the height of the plastic recording chamber (see below). The mouse is anesthetized with 2–2.5% isoflurane by delivering the gas to a small box chamber (Parkland Scientific, Coral Springs, FL, USA). After 2 minutes, the isoflurane is decreased to 1–1.5% to maintain a stable plane of anesthesia. Before any tissues are cut, the mouse is injected with 0.75 mg/kg buprenorphine subcutaneously as a preoperative analgesic. The rest of the surgery is carried out using sterile techniques, which involves using autoclaved tools and wearing personal protective equipment such as sterile gown, gloves, and mask. Once the mouse does not respond to the toe pinch reflex test, we place it in the prone position on a sterile diaper pad that we lay over a DC current rechargeable heating pad (Kent Scientific, Torrington, CT, USA; #DCT-15). The procedure is performed under a surgery microscope (Zeiss Stemi 2000) that is mounted on a boom stand that also holds a fiber optic light source (Schott ACE I). We place the front teeth into the tooth holder of the stereotaxic frame, fit the animal’s nose snug into the ventilator mask, and then secure the ear bars in place (stereotaxic apparatus from David Kopf Instruments, Tujunga, CA, USA). Next, we remove the fur on the back of the head using depilatory cream (Nair lotion with body oil). We use 70% ethanol pads to disinfect the site in preparation for incision then apply povidone–iodine (BETADINE Solution Swab Aids, Purdue Pharma, Stamford, CT, USA; #67618-152-01) to clean the skin, followed by two more rounds of ethanol/Betadine cleaning. We apply eye drops to both eyes to prevent them from drying out (Celluvisc; NDC 0023-4554-30). We cut the skin overlying the skull from the frontal bone to the occipital bone overlying the posterior cerebellum (scalpel blade from Harvard Apparatus, Holliston, MA, USA; #728360; Fig. 2A). Next, we gently tease away the fascia overlying the skull, and then dry the entire area by dabbing with sterile cotton swabs to remove blood. It is a good idea to reflect the neck muscles laterally if they obstruct access to the interparietal and occipital bones or if they cause tension behind the neck, which can lead to difficulties in positioning the head for mounting the head plate. We find bregma (Fig. 2) and mark it with a pencil. Then, using standard mouse stereotaxic coordinates and a Vernier scale, we move 6.4 mm caudally in the y-axis and +1.3 mm laterally in the x-axis. Centering the craniotomy over these coordinates offers flexibility, allowing us to record from the cerebellar cortex of lobule V/VI and other lobules along the path, such as lobule X, in addition to the cerebellar nuclei. We mark this spot with a pencil, as it will serve as the future center of the craniotomy for recording from the cerebellum. We prepare screws (00-90x1/16 flat point stainless steel machine screws #B002SG89QQ) by soaking them in 70% ethanol and then allowing them to dry on a sterile gauze pad. While the 1/16 skull anchoring screws are drying, we screw the head plate (8 mm X 25 mm) onto a custom-made “U” shaped holder (Fig. 3), using a different set of stainless steel machine screws (18-8 pan head screws, #2-56x3/16). The U holder is lowered until the plate touches the skull, making sure bregma is at the center of the head plate hole. The head plate is designed with the hole in the center so that bregma is always visible. Once the head plate is positioned correctly in reference to bregma, we raise the head plate to allow room for the first application of Metabond (Parkell, Inc., Edgewood, NY, USA). We then apply translucent Metabond directly to the skull, and then lower the holder so that the head plate makes full contact with the skull (Fig. 3). More Metabond mix is applied to the top and the sides of the head plate, making sure that the head plate is flush against the skull before it is completely adhered. In order for the head to be securely locked into place during recording, we make sure that the head plate is positioned properly such that its surface is perfectly level. We wait 10 to 15 minutes to let the Metabond solidify. It should be rock-hard to the touch upon drying. We unscrew the head plate from the U holder (it should now be firmly adhered to the skull). We then drill a hole slightly smaller than the diameter of a 1/16 screw to the left of the cerebellar midline, with care not to penetrate the brain. We pick up one of the previously air-dried, sterile 1/16 screws with forceps and advance it a few turns into the drill hole using a screwdriver until it is firmly in place (this will now serve as an anchor for the dental cement; Fig. 4A). We find that one screw is enough to achieve the desire stability, however many experimenters prefer using two or more screws. While this can help, we feel that the additional risk of disrupting the brain is significant – if this occurs, tissue damage causes bleeding and pulsations to occur within the contralateral craniotomy. Also, note the choice of screw is critical; longer screws might give a more secure anchor but they also tend to penetrate the dura, which leads to loss of cerebrospinal fluid and problems with tissue health. Using the drill, we etch a circle ~5 mm in diameter (smaller craniotomies are also adequate). This will serve as the perimeter of the craniotomy (Fig. 4A). But before completing the craniotomy, we work on attaching the post. In order to do so, we put the post into the manipulator arm. Next we find bregma (at this point it should still be easy to see the pencil marking since the Metabond is translucent), lower the metal post onto it, and then apply Metabond around the post (and also around the sides of the head plate if additional stability is needed). We wait another 10 to 15 minutes for the Metabond to dry, and we use this time to continue and complete the craniotomy by drilling within the previously defined perimeter. Note that it is important to drill gently and with sweeping or spiraling motions, rather than directly through the bone. We complete the craniotomy using the Dumont forceps to tease away the thinned bone in order to expose the cerebellum (Fig. 2, Fig. 4). This is a critical step, as many experimenters drill through the bone too quickly and often this will cause bleeding and create the risk of drilling directly into the brain tissue. This is an important issue to consider as any contact of the drill with the cerebellum causes immediate problems with tissue damage. We suggest that this must be avoided because even a small lesion risks infection. Moreover, the rich blood supply over the cerebellum makes a seemingly harmless poke quickly escalate into internal brain bleeding that can often go undetected during the surgery. Once the craniotomy has been made, we place antibiotic ointment (Water-Jel NDC 59898-740-02 or Walgreens triple-antibiotic ointment) around the hole and also gently apply a thick layer directly over the exposed cerebellum. We find that the layer of ointment, regularly reapplied, is sufficient to protect the exposed tissue for several weeks. We use either a 5 mm diameter straw (~5–7 mm long) or a piece of plastic tubing as the “recording chamber” (Fig. 4B). The straw is dipped into Metabond, placed around the craniotomy, and then we seal the edges with a little more Metabond; the small amount of Metabond will hold the straw in place before dental cement is applied. It is critical that the Metabond is kept to a minimum at this step as any excess may leak into the craniotomy where it will damage the exposed brain tissue. After the Metabond dries, we apply dental cement (A-M Systems dental cement powder #525000 and solvent #526000) around the bottom and sides of the straw. We clean the excess dental cement, paying particular attention to cleaning any leakage inside of the straw (using #55 forceps). We make sure the straw is in the desired position before allowing the cement to dry for about 10 minutes. Dental cement is applied around the post. Then, we apply a second round of cement around the straw and post. We apply a third round of dental cement in order to secure all three “points” of the surgery: the screw, post, and straw. We turn the animal over and then apply a small amount of acrylic on the underside of the head plate. Last, we apply 3M Vetbond (#NC0304169) around the entire perimeter of the cement in order to close the skin around the neck by bonding it to the dental cement. The straw is filled with more triple-antibiotic ointment, if needed, after manipulating the mouse as described above. If the tools need cleaning mid-surgery, we use a glass bead sterilizer (FST; Steri 205). For postoperative care we inject 0.75 mg/kg buprenorphine subcutaneously. Immediately after the surgery is completed the mouse is removed from the stereotaxic frame and then placed into a warming box (V500, Peco Services Ltd., Cumbria, UK) to prevent hypothermia after surgery. We return the mouse to its home cage only when it is fully awake, moving independently, and self-righting such that there is no risk of bedding entering its eyes or nose. We place some moistened food pellets within the cage for easy access during their recovery. From this point onwards, the mouse is housed in its own cage to prevent other mice from interfering with the surgical site during recovery and the recording phase. The mouse is monitored and given post-operative buprenorphine every 6–12 hours, as needed, for at least 24 hours. During post-operative care, the antibiotic seal that is covering the craniotomy is also regularly checked and refreshed every 12–24 hours, as needed, starting from the recovery phase through to the end of the recording phase.
Fig. 2.

(A) Schematic of a mouse skull with the major bones labeled. (B) The same schematic shown in (A), but with the brain drawn below the surface in order to illustrate the relative position of the cerebellum with respect to the overlying bones. Access to the cerebellum during in vivo electrophysiology experiments typically involves a craniotomy made in the interparietal bone. (C) The schematic of the mouse skull with bregma labeled (red asterisk).
Fig. 3.
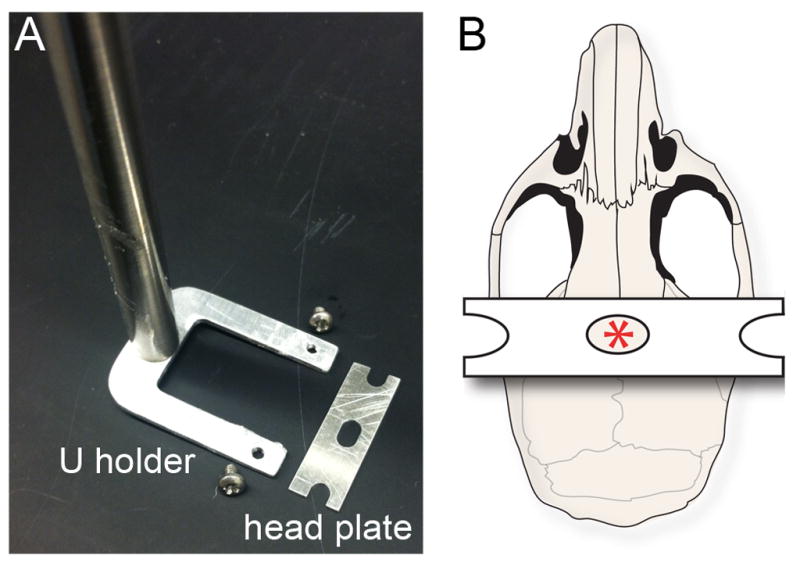
(A) A bird’s-eye view of the U holder, screws, and head plate. (B) Schematic of the mouse skull illustrating the position of the head plate. The hole in the center of the head plate allows visibility of bregma (red asterisk) throughout the procedure.
Fig. 4.

(A) After the head plate and 1/16 screw (green arrow) are secured, a craniotomy is initiated over the cerebellum (blue arrow). (B) The post is then positioned at bregma, the craniotomy completed, and a chamber adhered into place (blue arrowhead). (C) Schematic illustrating the positioning of the three major pieces of equipment that need to be secured: the head plate, the screw, and the recording chamber. The scale bar in (B) = 5 mm.
From start to finish, the entire surgical procedure can be performed in one hour, with some experience. Although rushing through the surgery is discouraged, it is best to work as quickly and as efficiently as possible in order to limit the duration of anesthesia. Long surgeries increase the risk of hypothermia and death. The aid of an assistant surgeon is therefore encouraged.
2.8 Training the mice for recording when they are head-fixed over a running wheel
The mouse is monitored closely over three days while it recovers. We make sure the mouse is active and eating and drinking normally. During this recovery period, we gently scruff the mouse and swab out the ointment from the craniotomy on a daily basis and replace it with fresh ointment. On day four, we begin training the mouse on the running wheel (Fig. 5), with two half-hour sessions per day. Once the mouse becomes acclimated to walking on the wheel while head-fixed, we start recording from neurons in the cerebellum.
Fig. 5.

(A) Image of a mouse head-fixed over a foam running wheel with an electrophysiology electrode targeted to the cerebellum. (B) Schematic illustrating the in vivo electrophysiology set up. The recording chamber is surgically adhered above the cerebellum allowing for the isolation of single units from Purkinje cells. (C) Single-unit activity was isolated from Purkinje cells less than one week (top raw trace) and more than one week (bottom raw trace) after the first recording. The asterisks mark Purkinje cell complex spikes. The x-axis scale bar = 50 ms, y-axis scale bar = 2 mV.
2.9 In vivo electrophysiology in behaving mice
After training, the mouse is fixed into place over the running wheel in preparation for recording (Fig. 5). The ointment is removed and replaced with 0.9% saline. The reference electrode rests over the straw with the non-insulated tip immersed in saline (Fig. 5A). Single-unit recordings are attained with 5–8 MΩ tungsten electrodes (Thomas Recording, Giessen, Germany) controlled by a motorized micromanipulator (MP-225; Sutter Instrument Co., Novato, CA, USA). Signals are band-pass filtered at 0.3–13 kHz, amplified with an ELC-03XS amplifier (NPI Electronic Instruments, Tamm, Germany), and then digitized (CED Power1401) and recorded using Spike2 software (CED, Cambridge, UK). Purkinje cells are identified by the presence of complex spikes, which are unique to Purkinje cells and initiated by climbing fibers. Analysis of continuous traces of >300 seconds is performed with Spike2, MS Excel, and MATLAB (Mathworks, Natick, MA, USA). Simple spikes, which are generated intrinsically, are analyzed for frequency (Hz = spikes/s), interspike intervals’ (ISI) coefficient of variance (CV = (standard deviation of ISIs)/(mean of ISIs)), and CV2, (CV2 = 2|ISIn+1–ISIn|/(ISIn+1+ISIn)) (Holt et al., 1996). Complex spikes are sorted independently for these analyses. Calculations are reported as mean ± standard error of the mean (SEM). Statistical analyses are performed with unpaired, two-tailed Student’s t-tests. The number of cells that are analyzed for each measurement is indicated with “n=”. After each recording session, a generous layer of fresh ointment is again applied to cover the craniotomy.
3. Results and discussion
We implanted the head plates and recorded from adult inbred C57BL6/J and mixed-background control mice (White et al., 2014). We have also performed the surgery and successfully acquired single-unit Purkinje cell recordings in outbred Swiss Webster mice (Arancillo et al., 2015). Purkinje cells were isolated from the anterior vermis (lobules I-V), central vermis (lobule VI), and posterior vermis (lobules VIII–IX) usually at a depth of up to 2.5 mm below the surface of the cerebellum (Fig. 5). Some cells were recorded deeper within the nodulus (lobule X), and also in the paravermis and CrusI/II of the hemispheres. The data from all the recorded Purkinje cells were pooled for analysis (n > 50). However, note that Purkinje cell activity is not homogeneous, but instead specific to different zonal modules that, in addition to specific firing properties, are also defined by their circuit connectivity, molecular properties, and developmental lineages (Zhou et al., 2014; Xiao et al., 2014; Cerminara et al., 2015; Hawkes, 2014; Zhou et al., 2015).
We also recorded the activity of cerebellar nuclear neurons (n > 20 for this study; Fig. 6A), which are the targets of the Purkinje cells and the main output of the cerebellum, at a depth of 2.5–3.0 mm below the surface of the cerebellum. We focused on the interposed nucleus as an exemplary region, which is located between the fastigial nucleus (most medial nucleus) and the dentate nucleus (most lateral nucleus) (Sillitoe et al., 2012).
Fig. 6.

(A) In vivo activity of a cerebellar nuclear neuron shown at lower power. (B) Higher power view of the raw trace in (A) showing individual spikes. The schematic illustrates the position of the electrode within the cerebellar nuclei. X-axis scale bar in (A) = 200 ms and (B) = 20 ms, y-axis scale bars = 2.5 mV.
3.1 Recordings over several weeks
One of the main advantages of recording neurons using this technique is the ability to examine neuronal properties over an extended time period in behaving animals. We tested whether our surgical preparation preserved the health of the tissue such that recordings could be acquired on multiple recording sessions. During each recording session, which usually last between 1 and 2 hours, we typically isolated 4–8 clean single units, with each raw trace showing simple spikes as well as obvious complex spikes that fire at an average rate of ~1 Hz (Fig. 5; also see Fig. 7A). A major benefit to performing successful surgeries is that the recordings can be acquired over several days to weeks (Fig. 5). We found that we could isolate clean single units well after a week post-surgery (Fig. 5C). Beyond three weeks post-surgery, we could isolate Purkinje cells, but the number of cells that we were able to find per recording session dropped off dramatically.
Fig. 7.

(A) All control mice exhibit baseline movement oscillations termed “physiological tremor”. The raw output waveform (middle left inset) has irregular peaks with low amplitude. Raw voltage trace (bottom inset) of a Purkinje cell shows the typical firing of simple spikes and complex spikes (asterisks) recorded in vivo. The higher power raw trace (middle right inset) shows the distinct features of the two types of Purkinje cell action potentials. (B) Harmaline induces a severe tremor that manifests as highly rhythmic oscillations. Despite the severe shaking, we could isolate and hold single-unit Purkinje cell activity successfully. Complex spike rate is significantly increased after injecting harmaline. Despite the shaking of the mice, the recordings were stable enough for distinguishing and analyzing individual complex spike and simple spike waveforms. For both panels, the x-axis scale bar in the lower power traces = 50 ms, y-axis scale bar = 2.5 mV, and in the higher power traces x-axis = 5 ms, y-axis = 5 mV.
3.2 Stability and quality of the recordings
We could identify Purkinje cells by their firing rate (65.7 ± 7.23 Hz; Fig. 7A) and the presence of clear complex spikes (1.26 ± 0.12 Hz frequency; Fig. 7A). We were able to hold single units for more than 300 seconds, which is critical when examining the dynamic properties of Purkinje cell spike patterns during behavior (Sauerbrei et al., 2015). Long spike trains are valuable since they allow for specific calculations such as simple spike CV and CV2 (CV: 0.79 ± 0.06, CV2: 0.58 ± 0.04; see also White et al., 2014; Arancillo et al., 2015). Using the surgical steps that we delineated for maintaining the visibility of bregma, we could successfully target the cerebellar nuclei using standard stereotaxic coordinates (Paxinos and Franklin, 2001). We could also hold single-unit cerebellar nuclei activity for extended periods of time (62.2 ± 5.2 Hz; Fig. 6B).
To further test the stability, we examined whether we could hold individual Purkinje cell units after injection of the tremorgenic drug harmaline. Harmaline induces a severe ~11–14 Hz tremor within minutes (Handforth, 2012). Its mechanism of action involves increased firing rate and synchrony of neurons in the inferior olive. In the cerebellar system, this presumably occurs because of electrotonic gap junction coupling plus the channel properties of olivary neurons. Together, these features promote rhythmic oscillations that impact cerebellar cortical output and the connected motor pathways (Sinton et al., 1989; Elble, 1998; Jacobson et al., 2009; Bazzigaluppi et al., 2012). Tremor was analyzed over single trials with a Tremor Monitor (San Diego Instruments). After harmaline injection, complex spike frequency increases significantly (compare 1.26 ± 0.12 Hz before harmaline to 6.11 ± 0.46 Hz after harmaline p < 0.0001; Fig. 7B). We found that we could still hold single-unit activity of Purkinje cells for more than 300 seconds despite the strong tremor-associated shaking that harmaline causes (Fig. 7B; video 1).
3.3 Circuit anatomy after functional analysis
In vivo electrophysiology performed in behaving animals is a powerful approach for understanding how circuits work. Complementary to this physiology, it is essential to examine the cellular and molecular organization of these circuits in order to fully appreciate their behavior. To accomplish this, we labeled the cerebellar tissue with an extensive panel of molecular markers after recording (Fig. 8; White et al., 2014). Using this panel, we examined the anatomy of each major cell type in the cerebellum, their layering within the cerebellar cortex (Fig. 8), the terminal field targeting of mossy and climbing fiber terminals, and the zonal patterning of the cerebellum into “stripes” (Fig. 9). The recorded side of the cerebellum that contained the craniotomy through which electrode penetrations were made was compared to the contralateral side where no electrode penetrations were performed.
Fig. 8.

(A) Schematic of the mouse skull and brain showing the approximate tissue-cutting planes (dotted lines) on each side of the cerebellar midline. (B) Schematic of a sagittal section cut through the cerebellum. The lobules are numbered with Roman numerals according to standard nomenclature (Larsell, 1952). (C) Tissue sections were stained with a series of markers to reveal the different cell types in the cerebellum and their architecture on the recorded and non-recorded sides of the cerebellum: CAR8 (Purkinje cells); parvalbumin (Purkinje cells, stellate cells, basket cells); GABARα6 (granule cells); neurogranin (Golgi cells), calretinin (unipolar brush cells in lobules IX and X). (D) The tissue was also stained for markers of afferents and projections: VGLUT2 (mossy fiber terminals in the granular layer and climbing fiber terminals in the molecular layer); CART (climbing fibers in lobule X); NFH (basket cell axons and Purkinje cells). (E) ApopTag staining revealed localized cell death only near the craniotomy (arrow). The ApopTag stained tissue was counterstained with hematoxylin (blue). In these regions (arrow), marker expression was weaker (e.g. parvalbumin). Abbreviations: ml; molecular layer, pcl; Purkinje cell layer; gl, granule cell layer. Scale bar = 50 μm in CAR8 panel (C), 200 μm in calretinin panel (C), 20 μm in NFH panel (D), and 100 μm in parvalbumin panel (E).
Fig. 9.

(A) Wholemount schematic illustrating the pattern of zebrinII. Refer to Larsell (1952) for lobule nomenclature. Refer to Apps and Hawkes (2009) for a full discussion of transverse zones (AZ, anterior zone; CZ central zone; PZ, posterior zone; NZ, nodular zone). (B, C) ZebrinII “stripe” expression is intact in the anterior and posterior zones on the recorded and non-recorded sides of the cerebellum. Background staining was detected in blood vessels (arrows). (D) Schematic illustrating the striped expression of HSP25 in the CZ and NZ. (E) Hsp25 reveals distinct stripes in lobules VI/VII and IX/X after recording. (F) The complementary patterns of HSP25 and NFH remain clear after recording. Scale bar = 250 in (B), 500 in (C), 100 in (F).
We tested whether the different cell types in the cerebellum can be visualized after surgery and multiple recording sessions over two weeks (Fig. 8). Using a panel of cell-specific markers, we could indeed identify each of the major cell types and afferent classes in the cerebellum: Purkinje cells, granule cells, stellate cells, basket cells and their projections, Golgi cells, unipolar brush cells, mossy fibers, and climbing fibers (Fig. 8). We also examined the tissue for widespread cell death that, in theory, could arise after multiple penetrations of the electrode. For this, we used ApopTag staining and found positive staining only in lobule VI, directly below the craniotomy (Fig. 8). ApopTag staining was localized to within 500 μm, a region substantially smaller than the craniotomy, which in most cases is ~ 5 mm in diameter. Minor damage was expected since access to the cerebellum requires removal of bone and disruption of meninges, and this process can result in local damage at the perimeter of the craniotomy window. The recording electrode itself does not seem to cause cell death. We also tested the extent to which local cell death impacts marker expression. This is demonstrated using parvalbumin staining, which marks GABAergic neurons (Fig. 8). We found that parvalbumin expression was only weaker in the cerebellar cortical layer located directly below the craniotomy (Fig. 8E). In the regions that were recorded, parvalbumin expression was unchanged and the cellular integrity was similar to the non-recorded tissue (Fig. 8C).
Next we tested whether zonal patterns were obscured by the surgical and electrophysiological procedures since previous studies reported slightly weaker staining for stripe markers after electrophysiological procedures (Chockkan and Hawkes, 1994). We could reveal zebrinII and HSP25 in Purkinje cells on the side of the cerebellum into which the electrode was inserted (Fig. 9, the craniotomy is on the right side of the cerebellum), and their expression patterns into zones were unaltered. Patterns in all four transverse zones (Sarna et al., 2006) were detected (Fig. 9), and the relationship between different patterns within a recorded zone was preserved (e.g. NFH and HSP25 in the nodular zone, Fig. 9E). However, we observed noticeable staining of zebrinII around blood vessels (arrows, Fig. 9B and 9C). We suspect that the electrode sometimes disrupts the vasculature, especially when multiple passes are made daily over several weeks. This could influence the quality of perfusion and the outcome of the staining in neurons and perhaps even glia. Regardless of these potential issues, we found that detailed patterning analyses are feasible after our in vivo recordings.
All together, the immunohistochemical analyses with cell- and pattern-specific markers allowed for the post-recording examination of circuit wiring as it relates to the modular architecture of the cerebellum, the targeting of axonal projections, excitatory and inhibitory interneuron identity, and synapse localization to the different layers (Sillitoe and Joyner, 2007; Apps and Hawkes, 2009; White and Sillitoe, 2013a; Cerminara et al., 2015). Therefore, the preservation of cerebellar anatomy after in vivo recording enables in-depth structural studies to be performed in the same tissue that was probed for circuit activity. This, in turn, is essential for dissecting apart the structural and functional attributes of cerebellar-related diseases (Reeber et al., 2013).
4. Conclusions
A central goal in neuroscience is to understand how neurons work in the context of their native circuits. One powerful method that can be used to achieve this goal is to record the activity of neurons in behaving animals. However, in vivo electrophysiology in awake animals requires surgical procedures to secure equipment onto the head of the animal. We have used a head-fixed approach to examine cerebellar Purkinje cell activity in active mice over several weeks (Fig. 5). In order to head-fix the mice, we must first implant a head plate that will be used to secure the animal in place. Securing the animal with a head plate ensures that stable, high-quality recordings can be attained. Notably, as it only restricts the position of the head, neuronal activity can still be related to motor behavior. Survival surgeries that are performed for the purpose of recording neurons over several days to weeks must be executed with remarkable care in order to maintain tissue health. We provided a step-by-step protocol that details an approach for implanting head plates, making a craniotomy for measuring neuronal activity, recording from single units, and assessing the tissue anatomically for cellular integrity and molecular identification of circuit patterns. The recommendations for stability that we have provided throughout the protocol can be easily adapted to successfully record from other brain regions, especially when much smaller structures or specific nuclei are targeted. Moreover, the simplicity and affordability of the head plates, holders, screws, etc. (Fig. 3) not only make the approach accessible to almost any neurophysiology laboratory but also allow for modifications that might increase the flexibility of the setup. Our anatomical data indicate that the tissue remains robust even after multiple penetrations (Fig. 8). However, covering the exposed brain with agar or another semi-solid protectant–in addition to the antibiotic ointment–might help extend the use of the preparation well beyond three weeks. As an adaptation, it would be entirely feasible to instead use glass electrodes for whole-cell recordings or juxtacellular labeling (Pinault, 1996). The craniotomy opening could also serve multiple simultaneous purposes such as recording plus live imaging (Badura et al., 2014; Najafi et al., 2014) or recording plus optogenetic manipulations (Heiney et al., 2014b; Hoogland et al., 2015; Lee et al., 2015). More generally, the details that we outline for successful fixation of head plates would also apply for the successful implantation of drives that are used to collect neuronal spike data in freely moving mice.
Supplementary Material
HIGHLIGHTS.
We describe a surgery that allows for routine isolation of single units in behaving mice
The high quality of the single units permits the analysis of action potential waveforms
The excellent wound healing of the craniotomy allows us to record over several weeks
The setup is stable enough for recording individual neurons in severely tremulous mice
Acknowledgments
This work was supported by funds from Baylor College of Medicine (BCM) and Texas Children’s Hospital. RVS also received support from the Bachmann-Strauss Dystonia and Parkinson Foundation, Inc., the Caroline Wiess Law Fund for Research in Molecular Medicine, a BCM IDDRC Project Development Award, BCM IDDRC Grant U54HD083092 from the Eunice Kennedy Shriver National Institute of Child Health and Human Development, Grant C06RR029965 from the National Center for Research Resources, and by NINDS R01NS089664. JJW is supported by NINDS F31NS092264, TLS by NINDS F31NS095491, and MA by a postdoctoral award from the National Ataxia Foundation (NAF). The content is solely the responsibility of the authors and does not necessarily represent the official views of the National Center for Research Resources or the National Institutes of Health. The BCM IDDRC Neuropathology Core performed the tissue staining and histopathology experiments after the surgeries and neuronal recordings. The tremor measurement was performed in the BCM IDDRC Mouse Neurobehavior Core.
Footnotes
Conflicts of Interest: We have nothing to disclose.
Publisher's Disclaimer: This is a PDF file of an unedited manuscript that has been accepted for publication. As a service to our customers we are providing this early version of the manuscript. The manuscript will undergo copyediting, typesetting, and review of the resulting proof before it is published in its final citable form. Please note that during the production process errors may be discovered which could affect the content, and all legal disclaimers that apply to the journal pertain.
References
- Ahn AH, Dziennis S, Hawkes R, Herrup K. The cloning of zebrin II reveals its identity with aldolase C. Development. 1994;120:2081–2090. doi: 10.1242/dev.120.8.2081. [DOI] [PubMed] [Google Scholar]
- Apps R, Hawkes R. Cerebellar cortical organization: a one-map hypothesis. Nature reviews Neuroscience. 2009;10:670–681. doi: 10.1038/nrn2698. [DOI] [PubMed] [Google Scholar]
- Arancillo M, White JJ, Lin T, Stay TL, Sillitoe RV. In vivo analysis of Purkinje cell firing properties during postnatal mouse development. J Neurophysiol. 2015;113:578–591. doi: 10.1152/jn.00586.2014. [DOI] [PMC free article] [PubMed] [Google Scholar]
- Badura A, Sun XR, Giovannucci A, Lynch LA, Wang SS. Fast calcium sensor proteins for monitoring neural activity. Neurophotonics. 2014;1:025008. doi: 10.1117/1.NPh.1.2.025008. [DOI] [PMC free article] [PubMed] [Google Scholar]
- Bazzigaluppi P, De Gruijl JR, van der Giessen RS, Khosrovani S, De Zeeuw CI, de Jeu MT. Olivary subthreshold oscillations and burst activity revisited. Frontiers in neural circuits. 2012;6:91. doi: 10.3389/fncir.2012.00091. [DOI] [PMC free article] [PubMed] [Google Scholar]
- Brochu G, Maler L, Hawkes R. Zebrin II: a polypeptide antigen expressed selectively by Purkinje cells reveals compartments in rat and fish cerebellum. J Comp Neurol. 1990;291:538–552. doi: 10.1002/cne.902910405. [DOI] [PubMed] [Google Scholar]
- Bryant JL, Roy S, Heck DH. A technique for stereotaxic recordings of neuronal activity in awake, head-restrained mice. J Neurosci Methods. 2009;178:75–79. doi: 10.1016/j.jneumeth.2008.11.014. [DOI] [PMC free article] [PubMed] [Google Scholar]
- Buzsaki G. Large-scale recording of neuronal ensembles. Nat Neurosci. 2004;7:446–451. doi: 10.1038/nn1233. [DOI] [PubMed] [Google Scholar]
- Cazakoff BN, Lau BY, Crump KL, Demmer HS, Shea SD. Broadly tuned and respiration–independent inhibition in the olfactory bulb of awake mice. Nat Neurosci. 2014;17:569–576. doi: 10.1038/nn.3669. [DOI] [PubMed] [Google Scholar]
- Cerminara NL, Lang EJ, Sillitoe RV, Apps R. Redefining the cerebellar cortex as an assembly of non-uniform Purkinje cell microcircuits. Nature reviews Neuroscience. 2015;16:79–93. doi: 10.1038/nrn3886. [DOI] [PMC free article] [PubMed] [Google Scholar]
- Chaumont J, Guyon N, Valera AM, Dugue GP, Popa D, Marcaggi P, Gautheron V, Reibel-Foisset S, Dieudonne S, Stephan A, Barrot M, Cassel JC, Dupont JL, Doussau F, Poulain B, Selimi F, Lena C, Isope P. Clusters of cerebellar Purkinje cells control their afferent climbing fiber discharge. Proc Natl Acad Sci U S A. 2013;110:16223–16228. doi: 10.1073/pnas.1302310110. [DOI] [PMC free article] [PubMed] [Google Scholar]
- Chettih SN, McDougle SD, Ruffolo LI, Medina JF. Adaptive timing of motor output in the mouse: the role of movement oscillations in eyelid conditioning. Frontiers in integrative neuroscience. 2011;5:72. doi: 10.3389/fnint.2011.00072. [DOI] [PMC free article] [PubMed] [Google Scholar]
- Chockkan V, Hawkes R. Functional and antigenic maps in the rat cerebellum: zebrin compartmentation and vibrissal receptive fields in lobule IXa. J Comp Neurol. 1994;345:33–45. doi: 10.1002/cne.903450103. [DOI] [PubMed] [Google Scholar]
- Chorev E, Epsztein J, Houweling AR, Lee AK, Brecht M. Electrophysiological recordings from behaving animals--going beyond spikes. Curr Opin Neurobiol. 2009;19:513–519. doi: 10.1016/j.conb.2009.08.005. [DOI] [PubMed] [Google Scholar]
- Demilly A, Reeber SL, Gebre SA, Sillitoe RV. Neurofilament heavy chain expression reveals a unique parasagittal stripe topography in the mouse cerebellum. Cerebellum. 2011;10:409–421. doi: 10.1007/s12311-010-0156-y. [DOI] [PubMed] [Google Scholar]
- Elble RJ. Animal models of action tremor. Mov Disord. 1998;13(Suppl 3):35–39. doi: 10.1002/mds.870131306. [DOI] [PubMed] [Google Scholar]
- Gao H, Solages C, Lena C. Tetrode recordings in the cerebellar cortex. J Physiol Paris. 2012;106:128–136. doi: 10.1016/j.jphysparis.2011.10.005. [DOI] [PubMed] [Google Scholar]
- Gebre SA, Reeber SL, Sillitoe RV. Parasagittal compartmentation of cerebellar mossy fibers as revealed by the patterned expression of vesicular glutamate transporters VGLUT1 and VGLUT2. Brain Struct Funct. 2012;217:165–180. doi: 10.1007/s00429-011-0339-4. [DOI] [PubMed] [Google Scholar]
- Gilja V, Chestek CA, Nuyujukian P, Foster J, Shenoy KV. Autonomous head-mounted electrophysiology systems for freely behaving primates. Curr Opin Neurobiol. 2010;20:676–686. doi: 10.1016/j.conb.2010.06.007. [DOI] [PMC free article] [PubMed] [Google Scholar]
- Handforth A. Harmaline tremor: underlying mechanisms in a potential animal model of essential tremor. Tremor Other Hyperkinet Mov (NY) 2012;2 doi: 10.7916/D8TD9W2P. [DOI] [PMC free article] [PubMed] [Google Scholar]
- Hawkes R. Purkinje cell stripes and long-term depression at the parallel fiber-Purkinje cell synapse. Frontiers in systems neuroscience. 2014;8:41. doi: 10.3389/fnsys.2014.00041. [DOI] [PMC free article] [PubMed] [Google Scholar]
- Heiney SA, Kim J, Augustine GJ, Medina JF. Precise control of movement kinematics by optogenetic inhibition of Purkinje cell activity. J Neurosci. 2014a;34:2321–2330. doi: 10.1523/JNEUROSCI.4547-13.2014. [DOI] [PMC free article] [PubMed] [Google Scholar]
- Heiney SA, Wohl MP, Chettih SN, Ruffolo LI, Medina JF. Cerebellar-dependent expression of motor learning during eyeblink conditioning in head-fixed mice. J Neurosci. 2014b;34:14845–14853. doi: 10.1523/JNEUROSCI.2820-14.2014. [DOI] [PMC free article] [PubMed] [Google Scholar]
- Hisano S, Sawada K, Kawano M, Kanemoto M, Xiong G, Mogi K, Sakata-Haga H, Takeda J, Fukui Y, Nogami H. Expression of inorganic phosphate/vesicular glutamate transporters (BNPI/VGLUT1 and DNPI/VGLUT2) in the cerebellum and precerebellar nuclei of the rat. Brain Res Mol Brain Res. 2002;107:23–31. doi: 10.1016/s0169-328x(02)00442-4. [DOI] [PubMed] [Google Scholar]
- Holt GR, Softky WR, Koch C, Douglas RJ. Comparison of discharge variability in vitro and in vivo in cat visual cortex neurons. J Neurophysiol. 1996;75:1806–1814. doi: 10.1152/jn.1996.75.5.1806. [DOI] [PubMed] [Google Scholar]
- Hoogland TM, De Gruijl JR, Witter L, Canto CB, De Zeeuw CI. Role of Synchronous Activation of Cerebellar Purkinje Cell Ensembles in Multi-joint Movement Control. Curr Biol. 2015;25:1157–1165. doi: 10.1016/j.cub.2015.03.009. [DOI] [PMC free article] [PubMed] [Google Scholar]
- Jacobson GA, Lev I, Yarom Y, Cohen D. Invariant phase structure of olivo-cerebellar oscillations and its putative role in temporal pattern generation. Proc Natl Acad Sci U S A. 2009;106:3579–3584. doi: 10.1073/pnas.0806661106. [DOI] [PMC free article] [PubMed] [Google Scholar]
- Khodagholy D, Gelinas JN, Thesen T, Doyle W, Devinsky O, Malliaras GG, Buzsaki G. NeuroGrid: recording action potentials from the surface of the brain. Nat Neurosci. 2015;18:310–315. doi: 10.1038/nn.3905. [DOI] [PMC free article] [PubMed] [Google Scholar]
- Larouche M, Che PM, Hawkes R. Neurogranin expression identifies a novel array of Purkinje cell parasagittal stripes during mouse cerebellar development. J Comp Neurol. 2006;494:215–227. doi: 10.1002/cne.20791. [DOI] [PubMed] [Google Scholar]
- Larsell O. The morphogenesis and adult pattern of the lobules and fissures of the cerebellum of the white rat. Journal Comp Neurol. 1952;97:281–356. doi: 10.1002/cne.900970204. [DOI] [PubMed] [Google Scholar]
- LeDoux MS, Lorden JF. Abnormal spontaneous and harmaline-stimulated Purkinje cell activity in the awake genetically dystonic rat. Exp Brain Res. 2002;145:457–467. doi: 10.1007/s00221-002-1127-4. [DOI] [PubMed] [Google Scholar]
- Lee KH, Mathews PJ, Reeves AM, Choe KY, Jami SA, Serrano RE, Otis TS. Circuit mechanisms underlying motor memory formation in the cerebellum. Neuron. 2015;86:529–540. doi: 10.1016/j.neuron.2015.03.010. [DOI] [PMC free article] [PubMed] [Google Scholar]
- Long MA, Lee AK. Intracellular recording in behaving animals. Curr Opin Neurobiol. 2012;22:34–44. doi: 10.1016/j.conb.2011.10.013. [DOI] [PMC free article] [PubMed] [Google Scholar]
- Louis ED, Faust PL, Vonsattel JP. Purkinje cell loss is a characteristic of essential tremor. Parkinsonism and related disorders. 2011;17:406–409. doi: 10.1016/j.parkreldis.2011.05.004. [DOI] [PMC free article] [PubMed] [Google Scholar]
- Miller EK, Wilson MA. All my circuits: using multiple electrodes to understand functioning neural networks. Neuron. 2008;60:483–488. doi: 10.1016/j.neuron.2008.10.033. [DOI] [PubMed] [Google Scholar]
- Najafi F, Giovannucci A, Wang SS, Medina JF. Sensory-driven enhancement of calcium signals in individual Purkinje cell dendrites of awake mice. Cell reports. 2014;6:792–798. doi: 10.1016/j.celrep.2014.02.001. [DOI] [PMC free article] [PubMed] [Google Scholar]
- Nakamura S, Nakayama K, Mochizuki A, Sato F, Haque T, Yoshida A, Inoue T. Electrophysiological and morphological properties of rat supratrigeminal premotor neurons targeting the trigeminal motor nucleus. J Neurophysiol. 2014;111:1770–1782. doi: 10.1152/jn.00276.2013. [DOI] [PubMed] [Google Scholar]
- Orr HT. Cell biology of spinocerebellar ataxia. J Cell Biol. 2012;197:167–177. doi: 10.1083/jcb.201105092. [DOI] [PMC free article] [PubMed] [Google Scholar]
- Paxinos G, Franklin K. The Mouse Brain in Stereotaxic Coordinates. 2. San Diego: Academic Press; 2001. [Google Scholar]
- Pinault D. A novel single-cell staining procedure performed in vivo under electrophysiological control: morpho-funcitonal features of juxtacellularly labeled thalamic cells and other central neurons wth biocytin and neurobiotin. J Neurosci Methods. 1996;65:113–136. doi: 10.1016/0165-0270(95)00144-1. [DOI] [PubMed] [Google Scholar]
- Reeber SL, Sillitoe RV. Patterned expression of a cocaine- and amphetamine-regulated transcript peptide reveals complex circuit topography in the rodent cerebellar cortex. J Comp Neurol. 2011;519:1781–1796. doi: 10.1002/cne.22601. [DOI] [PubMed] [Google Scholar]
- Reeber SL, Otis TS, Sillitoe RV. New roles for the cerebellum in health and disease. Frontiers in systems neuroscience. 2013;7:83. doi: 10.3389/fnsys.2013.00083. [DOI] [PMC free article] [PubMed] [Google Scholar]
- Ruigrok TJ, Hensbroek RA, Simpson JI. Spontaneous activity signatures of morphologically identified interneurons in the vestibulocerebellum. J Neurosci. 2011;31:712–724. doi: 10.1523/JNEUROSCI.1959-10.2011. [DOI] [PMC free article] [PubMed] [Google Scholar]
- Sarna JR, Marzban H, Watanabe M, Hawkes R. Complementary stripes of phospholipase Cbeta3 and Cbeta4 expression by Purkinje cell subsets in the mouse cerebellum. J Comp Neurol. 2006;496:303–313. doi: 10.1002/cne.20912. [DOI] [PubMed] [Google Scholar]
- Sauerbrei BA, Lubenov EV, Siapas AG. Structured Variability in Purkinje Cell Activity during Locomotion. Neuron. 2015;87:840–852. doi: 10.1016/j.neuron.2015.08.003. [DOI] [PMC free article] [PubMed] [Google Scholar]
- Servais L, Cheron G. Purkinje cell rhythmicity and synchronicity during modulation of fast cerebellar oscillation. Neuroscience. 2005;134:1247–1259. doi: 10.1016/j.neuroscience.2005.06.001. [DOI] [PubMed] [Google Scholar]
- Sillitoe RV, Joyner AL. Morphology, molecular codes, and circuitry produce the three-dimensional complexity of the cerebellum. Annu Rev Cell Dev Biol. 2007;23:549–577. doi: 10.1146/annurev.cellbio.23.090506.123237. [DOI] [PubMed] [Google Scholar]
- Sillitoe RV, Vogel MW, Joyner AL. Engrailed homeobox genes regulate establishment of the cerebellar afferent circuit map. J Neurosci. 2010;30:10015–10024. doi: 10.1523/JNEUROSCI.0653-10.2010. [DOI] [PMC free article] [PubMed] [Google Scholar]
- Sillitoe RV, Fu Y, Watson C. Cerebellum. In: Watson C, Paxinos G, Puelles L, editors. The Mouse Nervous System. Australia: Elsevier; 2012. pp. 360–397. [Google Scholar]
- Sillitoe RV, Hulliger M, Dyck R, Hawkes R. Antigenic compartmentation of the cat cerebellar cortex. Brain Res. 2003;977:1–15. doi: 10.1016/s0006-8993(03)02569-1. [DOI] [PubMed] [Google Scholar]
- Sillitoe RV, Stephen D, Lao Z, Joyner AL. Engrailed homeobox genes determine the organization of Purkinje cell sagittal stripe gene expression in the adult cerebellum. J Neurosci. 2008;28:12150–12162. doi: 10.1523/JNEUROSCI.2059-08.2008. [DOI] [PMC free article] [PubMed] [Google Scholar]
- Singec I, Knoth R, Ditter M, Frotscher M, Volk B. Neurogranin expression by cerebellar neurons in rodents and non-human primates. J Comp Neurol. 2003;459:278–289. doi: 10.1002/cne.10600. [DOI] [PubMed] [Google Scholar]
- Sinton C, Krosser B, Walton K, Llinas R. The effectiveness of different isomers of octanol as blockers of harmaline-induced tremor. European Journal of Physiology. 1989;414:31–36. doi: 10.1007/BF00585623. [DOI] [PubMed] [Google Scholar]
- Viskontas IV, Ekstrom AD, Wilson CL, Fried I. Characterizing interneuron and pyramidal cells in the human medial temporal lobe in vivo using extracellular recordings. Hippocampus. 2007;17:49–57. doi: 10.1002/hipo.20241. [DOI] [PubMed] [Google Scholar]
- White JJ, Sillitoe RV. Development of the cerebellum: from gene expression patterns to circuit maps. Wiley Interdiscip Rev Dev Biol. 2013a;2:149–164. doi: 10.1002/wdev.65. [DOI] [PubMed] [Google Scholar]
- White JJ, Sillitoe RV. Postnatal development of cerebellar zones revealed by neurofilament heavy chain protein expression. Front Neuroanat. 2013b;7:9. doi: 10.3389/fnana.2013.00009. [DOI] [PMC free article] [PubMed] [Google Scholar]
- White JJ, Arancillo M, Stay T, George-Jones NA, Levy SL, Heck DH, Sillitoe RV. Cerebellar Zonal Patterning Relies on Purkinje Cell Neurotransmission. J Neurosci. 2014;34:8231–8245. doi: 10.1523/JNEUROSCI.0122-14.2014. [DOI] [PMC free article] [PubMed] [Google Scholar]
- Wilson BK, Hess EJ. Animal models for dystonia. Mov Disord. 2013;28:982–989. doi: 10.1002/mds.25526. [DOI] [PMC free article] [PubMed] [Google Scholar]
- Wise AK, Cerminara NL, Marple-Horvat DE, Apps R. Mechanisms of synchronous activity in cerebellar Purkinje cells. J Physiol. 2010;588:2373–2390. doi: 10.1113/jphysiol.2010.189704. [DOI] [PMC free article] [PubMed] [Google Scholar]
- Xiao J, Cerminara NL, Kotsurovskyy Y, Aoki H, Burroughs A, Wise AK, Luo Y, Marshall SP, Sugihara I, Apps R, Lang EJ. Systematic regional variations in Purkinje cell spiking patterns. PloS one. 2014;9:e105633. doi: 10.1371/journal.pone.0105633. [DOI] [PMC free article] [PubMed] [Google Scholar]
- Zhou H, Voges K, Lin Z, Ju C, Schonewille M. Differential Purkinje cell simple spike activity and pausing behavior related to cerebellar modules. J Neurophysiol. 2015;113:2524–2536. doi: 10.1152/jn.00925.2014. [DOI] [PMC free article] [PubMed] [Google Scholar]
- Zhou H, Lin z, Voges K, Ju C, Gao Z, Bosman LW, Ruigrok TJ, Hoebeek FE, De Zeeuw CI, Schonewille M. Cerebellar modules operate at different frequencies. elife. 2014 doi: 10.7554/eLife.02536. [DOI] [PMC free article] [PubMed] [Google Scholar]
Associated Data
This section collects any data citations, data availability statements, or supplementary materials included in this article.